 Data Quality
R Implementation of Pairwise correlation
Description
The des_scatterplot_matrix function provides Pearson
correlation (r) for groups of numerical variables in the study data.
These variable groups (expecting to show Pearson correlation) have to be
specified in the cross-item level metadata.
The function provides a table with the list of variables and their
correlation and pairwise correlation plots.
Usage and arguments
des_scatterplot_matrix(study_data = sd1,
                       meta_data = "item_level",
                       label_col = LABEL,
                       meta_data_cross_item = "cross-item_level")
The function has the following arguments:
- study_data: mandatory, the data frame containing the measurements;
- meta_data: mandatory, the data frame containing the item_level metadata.
- meta_data_cross_item: mandatory, the data frame containing the cross-item_level metadata.
- label_col: optional, the column in the metadata data frame containing the labels of all the variables in the study data.
Example output
To illustrate the output, we use the example synthetic data and metadata that are bundled with the dataquieR package. See the introductory tutorial for instructions on importing these files into R, as well as details on their structure and contents.
prep_load_workbook_like_file("meta_data_v2")
sd1 <- prep_get_data_frame("study_data")
## "https://dataquality.qihs.uni-greifswald.de/extdata/study_data.RData": Found
## only few (0 %) column names that look like meta data but 'keep_types' was set
## to "FALSE" -- did you read the file as text-only on purpose, this is not
## suitable for study data. Colunm names: "v00000", "v00001", "v00002", "v00003",
## "v00004", "v00005", "v01003", "v01002", "v00103", "v00006", "v00007", "v00008",
## "v00009", "v00109", "v00010", "v00011", "v00012", "v00013", "v00014", "v00015",
## "v00016", "v00017", "v00018", "v01018", "v00019", "v00020", "v00021", "v00022",
## "v00023", "v00024", "v00025", "v00026", "v00027", "v00028", "v00029", "v00030",
## "v00031", "v00032", "v00033", "v00034", "v00035", "v00036", "v00037", "v00038",
## "v00039", "v00040", "v00041", "v00042", "v10000", "v20000", "v30000", "v40000",
## "v50000"des_scat <- des_scatterplot_matrix(study_data = sd1)The function generates 3 outputs VariableGroupData,
VariableGroupTable, and VariableGroupPlotList.
The first two (VariableGroupData and
VariableGroupTable) are exactly the same in this case, but
used differently in the creation of a report.
Output 1: Summary data frame
The summary data frame is called using
des_scat$VariableGroupData:
Either as an interactive data.tables table:
DT::datatable(des_scat$VariableGroupData, escape = FALSE)Or as a kable:
| VARIABLE_LIST | cors | max_cor | in_range | range |
|---|---|---|---|---|
| SBP_0 | DBP_0 | cor(DBP_0, SBP_0) = 0.766 | 0.7655034 | TRUE | (0.7;Inf) |
Output 2: Pairwise correlation plots
The matrix of the Pairwise correlation plots is called using
des_scat$VariableGroupPlotList:
## Found the following inadmissible categorical values in 'EDUCATION_1': "7" --
## I've removed them.
## Found the following inadmissible categorical values in 'FAM_STAT_0': "0", "1",
## "2", "3" -- I've removed them.## Found the following inadmissible categorical values in 'SMOKE_SHOP_0': "5" --
## I've removed them.## Found the following inadmissible categorical values in 'MEDICATION_0': "3", "2"
## -- I've removed them.## Found the following inadmissible categorical values in 'USR_SOCDEM_0':
## "USR_120" -- I've removed them.## $`Blood pressure checks`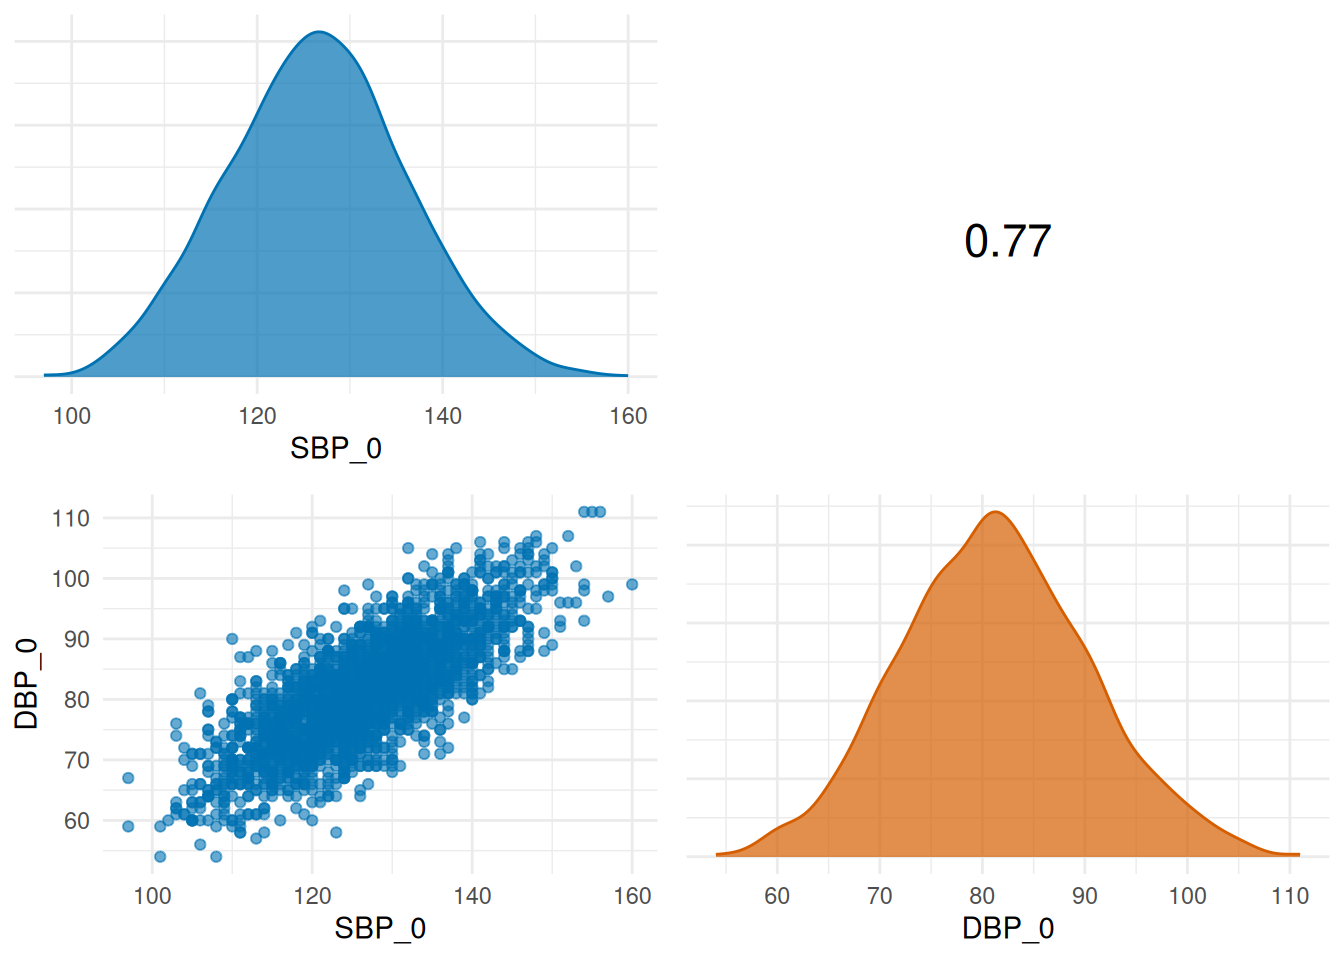
Please ignore the warning error messages about GGally
and the error about argument "i", both come from the
package GGally, and both are pointless.
Interpretation
Algorithm of the implementation
- From the cross-item metadata, determine group of variables for which is expected to calculate the Pairwise correlation.
- Calculate Pairwise correlation value for the specified variables.
Concept relations
- Data quality Indicator Unexpected association strength
