R function to visualize applicability of DQ implementations
Description
pro_applicability_matrix is preparatory support function
that compares study data with associated metadata. A prerequisite of
this function is that the number of columns in the study data complies
with the number of rows in the metadata.
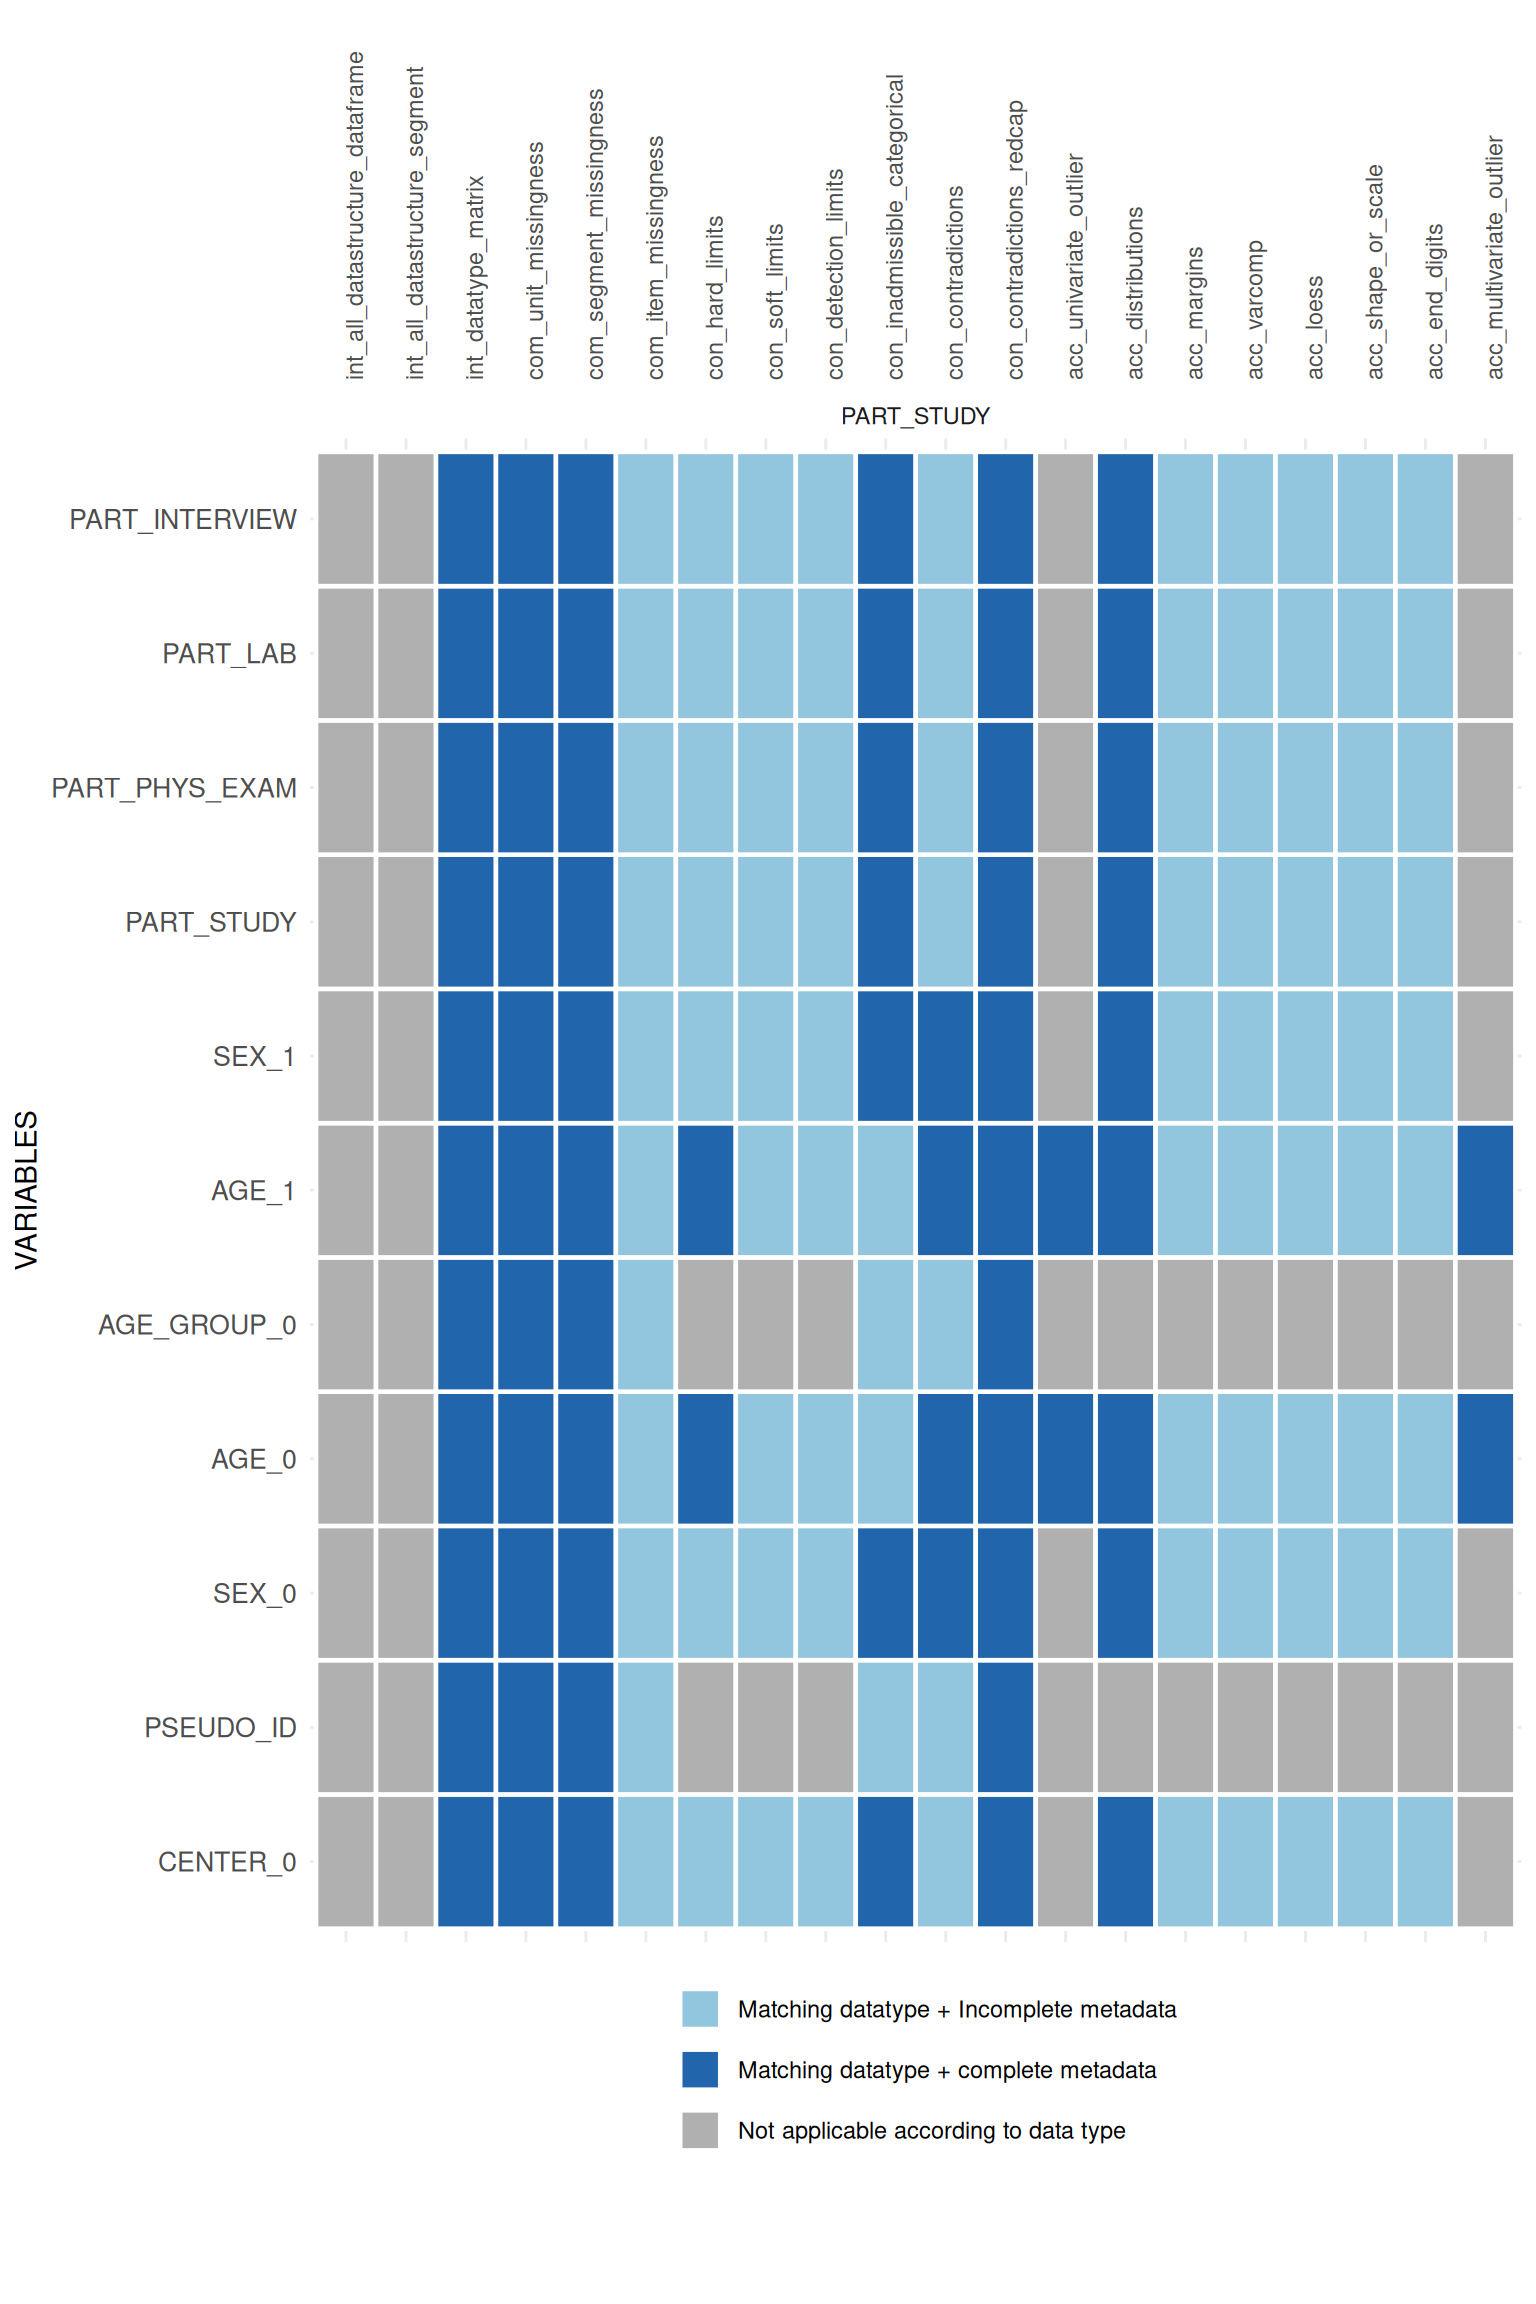
For each existing R-implementation the function searches for the necessary static metadata and returns a heatmap-like matrix indicating the applicability of each data quality implementation.
Additionally, the data type defined in the metadata is compared with
the observed data type in the study data. Thus,
pro_applicability_matrix is an implementation of the Data type mismatch indicator, which
belongs to the Value format error
domain in the Integrity
dimension.
For more details, see the user’s manual and source code.
Usage and arguments
pro_applicability_matrix(
  study_data = sd1,
  meta_data = md1,
  split_segments = FALSE,
  label_col = NULL,
  max_vars_per_plot = 20
)
The pro_applicability_matrix function has the following
arguments:
- study_data: mandatory, the data frame containing the measurements.
- meta_data: mandatory, the data frame containing the study data’s metadata.
- split_segments: logical, should the output return one matrix per study segment?
- label_col: optional, the column in the metadata data frame containing the labels of all the variables in the study data.
- max_vars_per_plot: optional, the maximum number of variables per plot.
Example output
To illustrate the output, we use the example synthetic data and metadata that are bundled with the dataquieR package. See the introductory tutorial for instructions on importing these files into R, as well as details on their structure and contents.
Calling the pro_applicability_matrix function requires
only two inputs. However, if the metadata includes the
LABEL column, it is recommended to use it in case
VAR_NAMES are not self-explanatory:
appmatrix <- pro_applicability_matrix(
  study_data = sd1,
  meta_data = md1,
  label_col = LABEL
)
Call the heatmap-like plot:
appmatrix$ApplicabilityPlot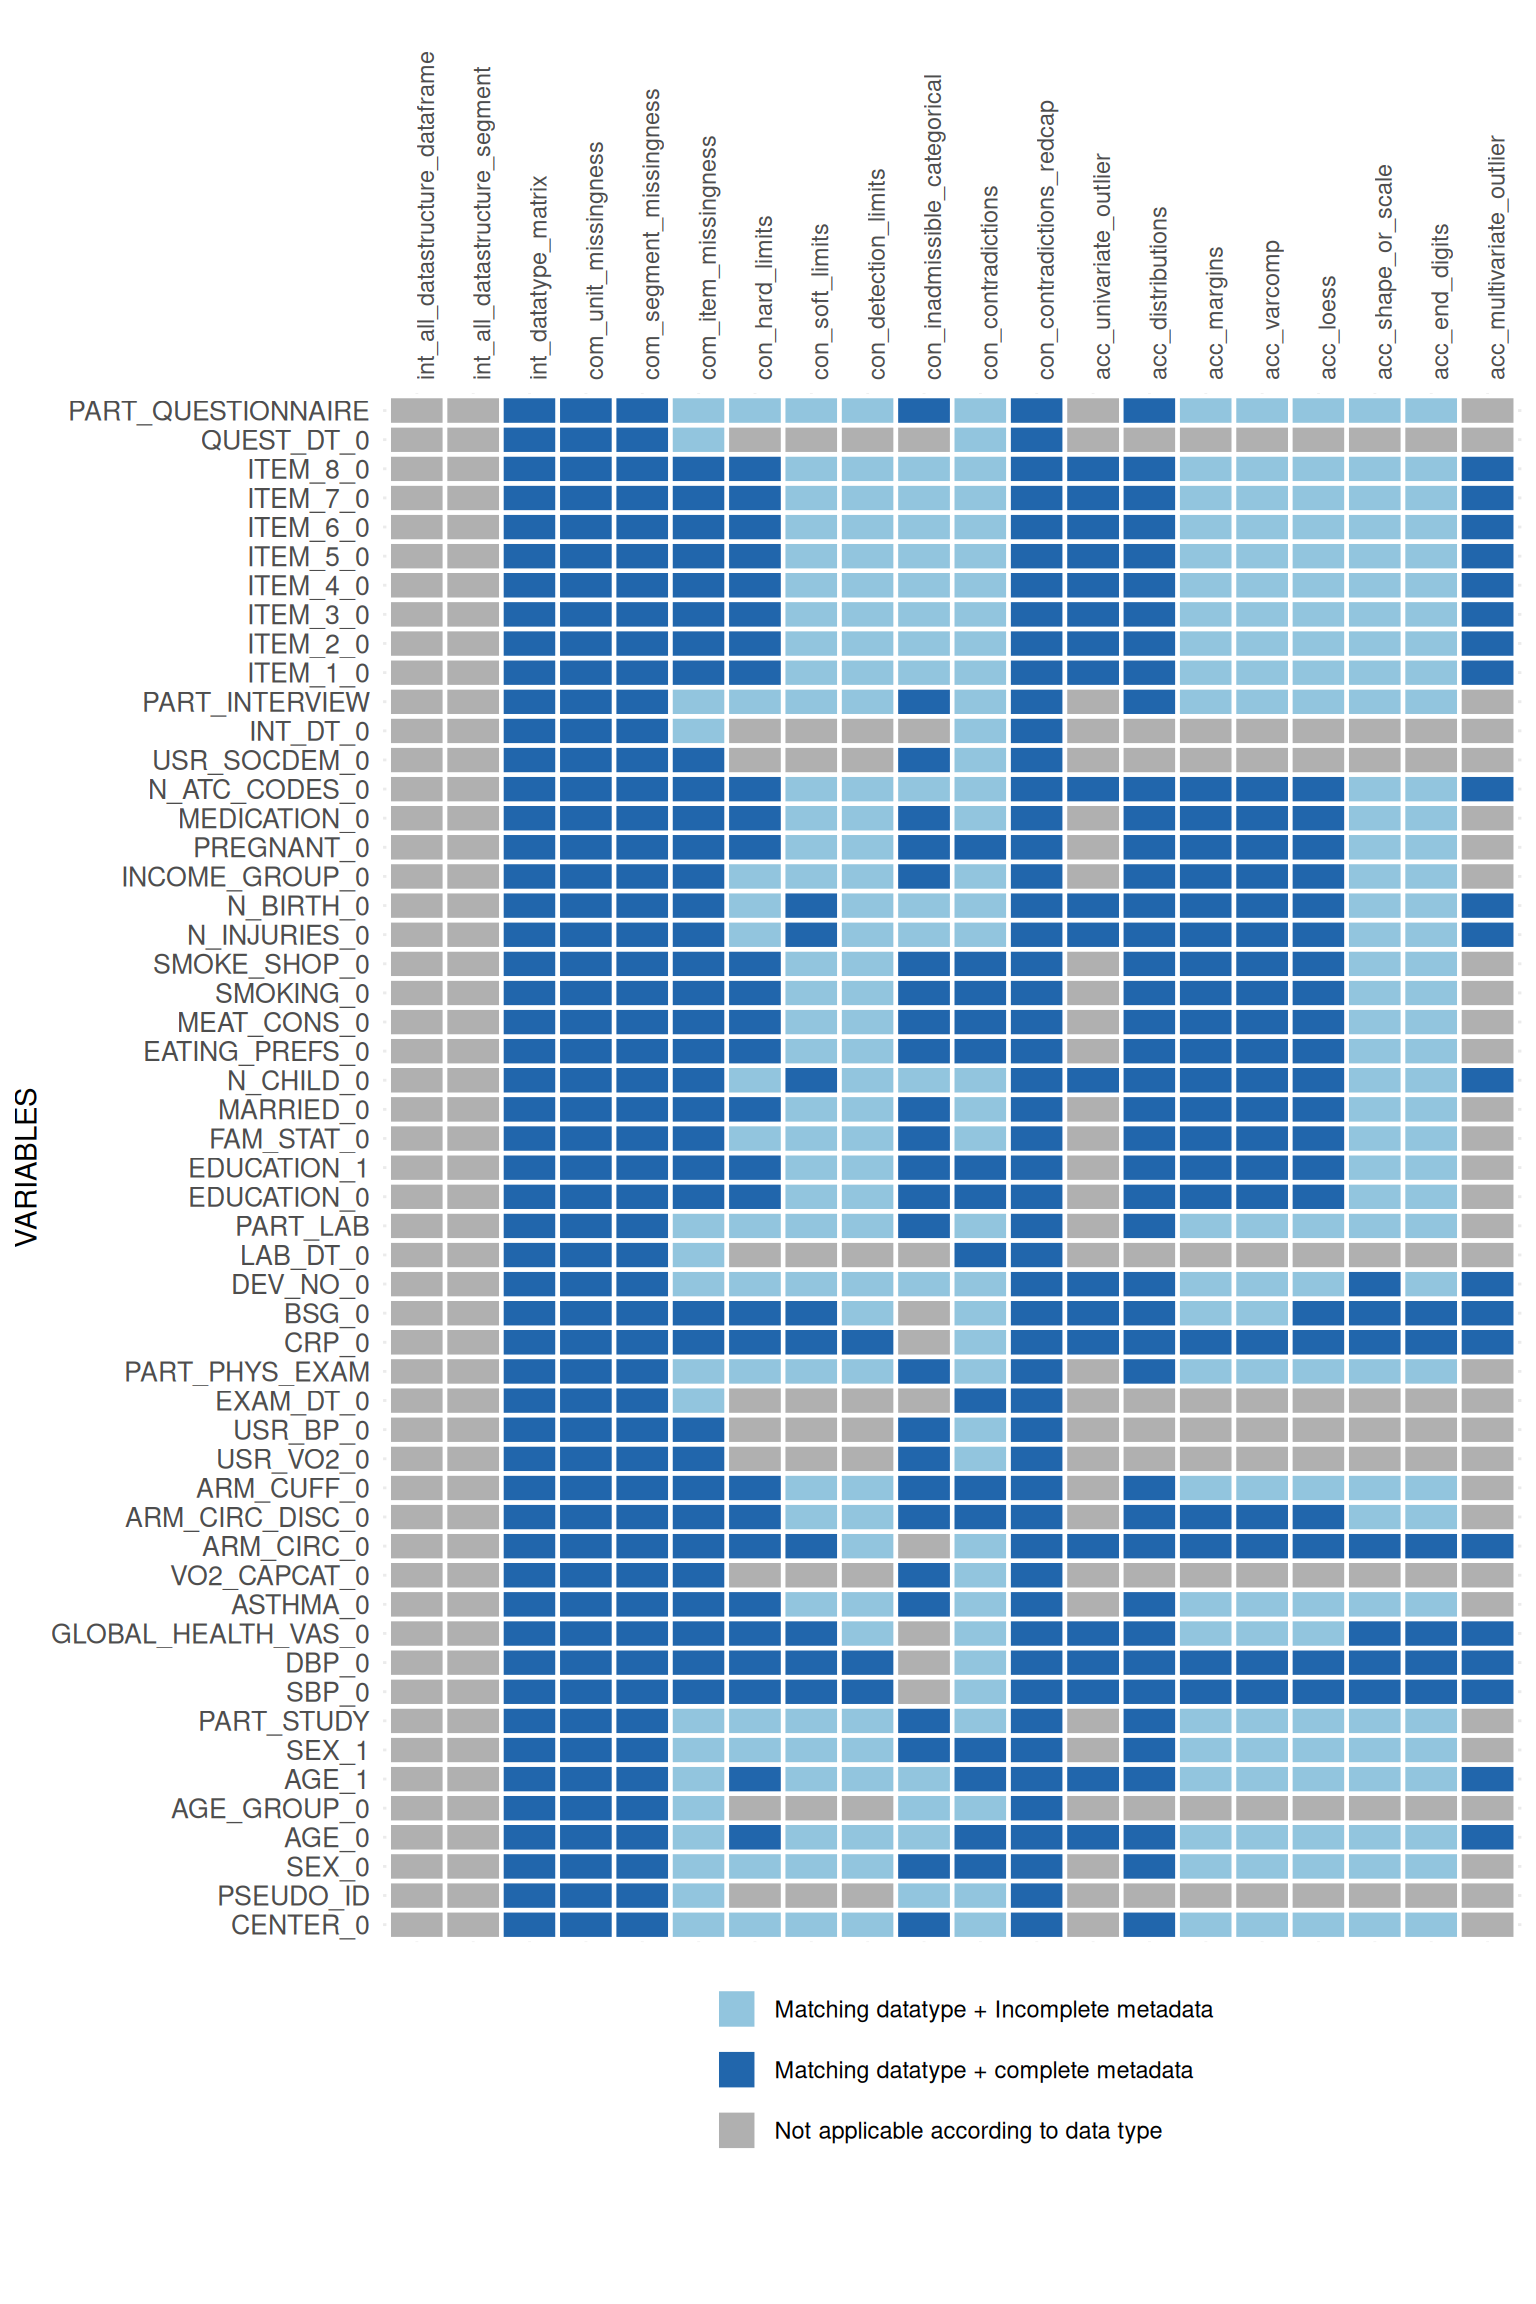
If KEY_STUDY_SEGMENT is defined in the metadata for all
variables, the split_segments argument can be used to
divide the plot:
appmatrix <- pro_applicability_matrix(
  study_data = sd1,
  meta_data = md1,
  label_col = LABEL,
  split_segments = TRUE
)
## Missing some or all entries in 'SCALE_LEVEL' column in item-level meta_data.
## Predicting it from the data -- please verify these predictions, they may be
## wrong and lead to functions claiming not to be reasonably applicable to a
## variable.appmatrix$ApplicabilityPlotList## $PART_INTERVIEW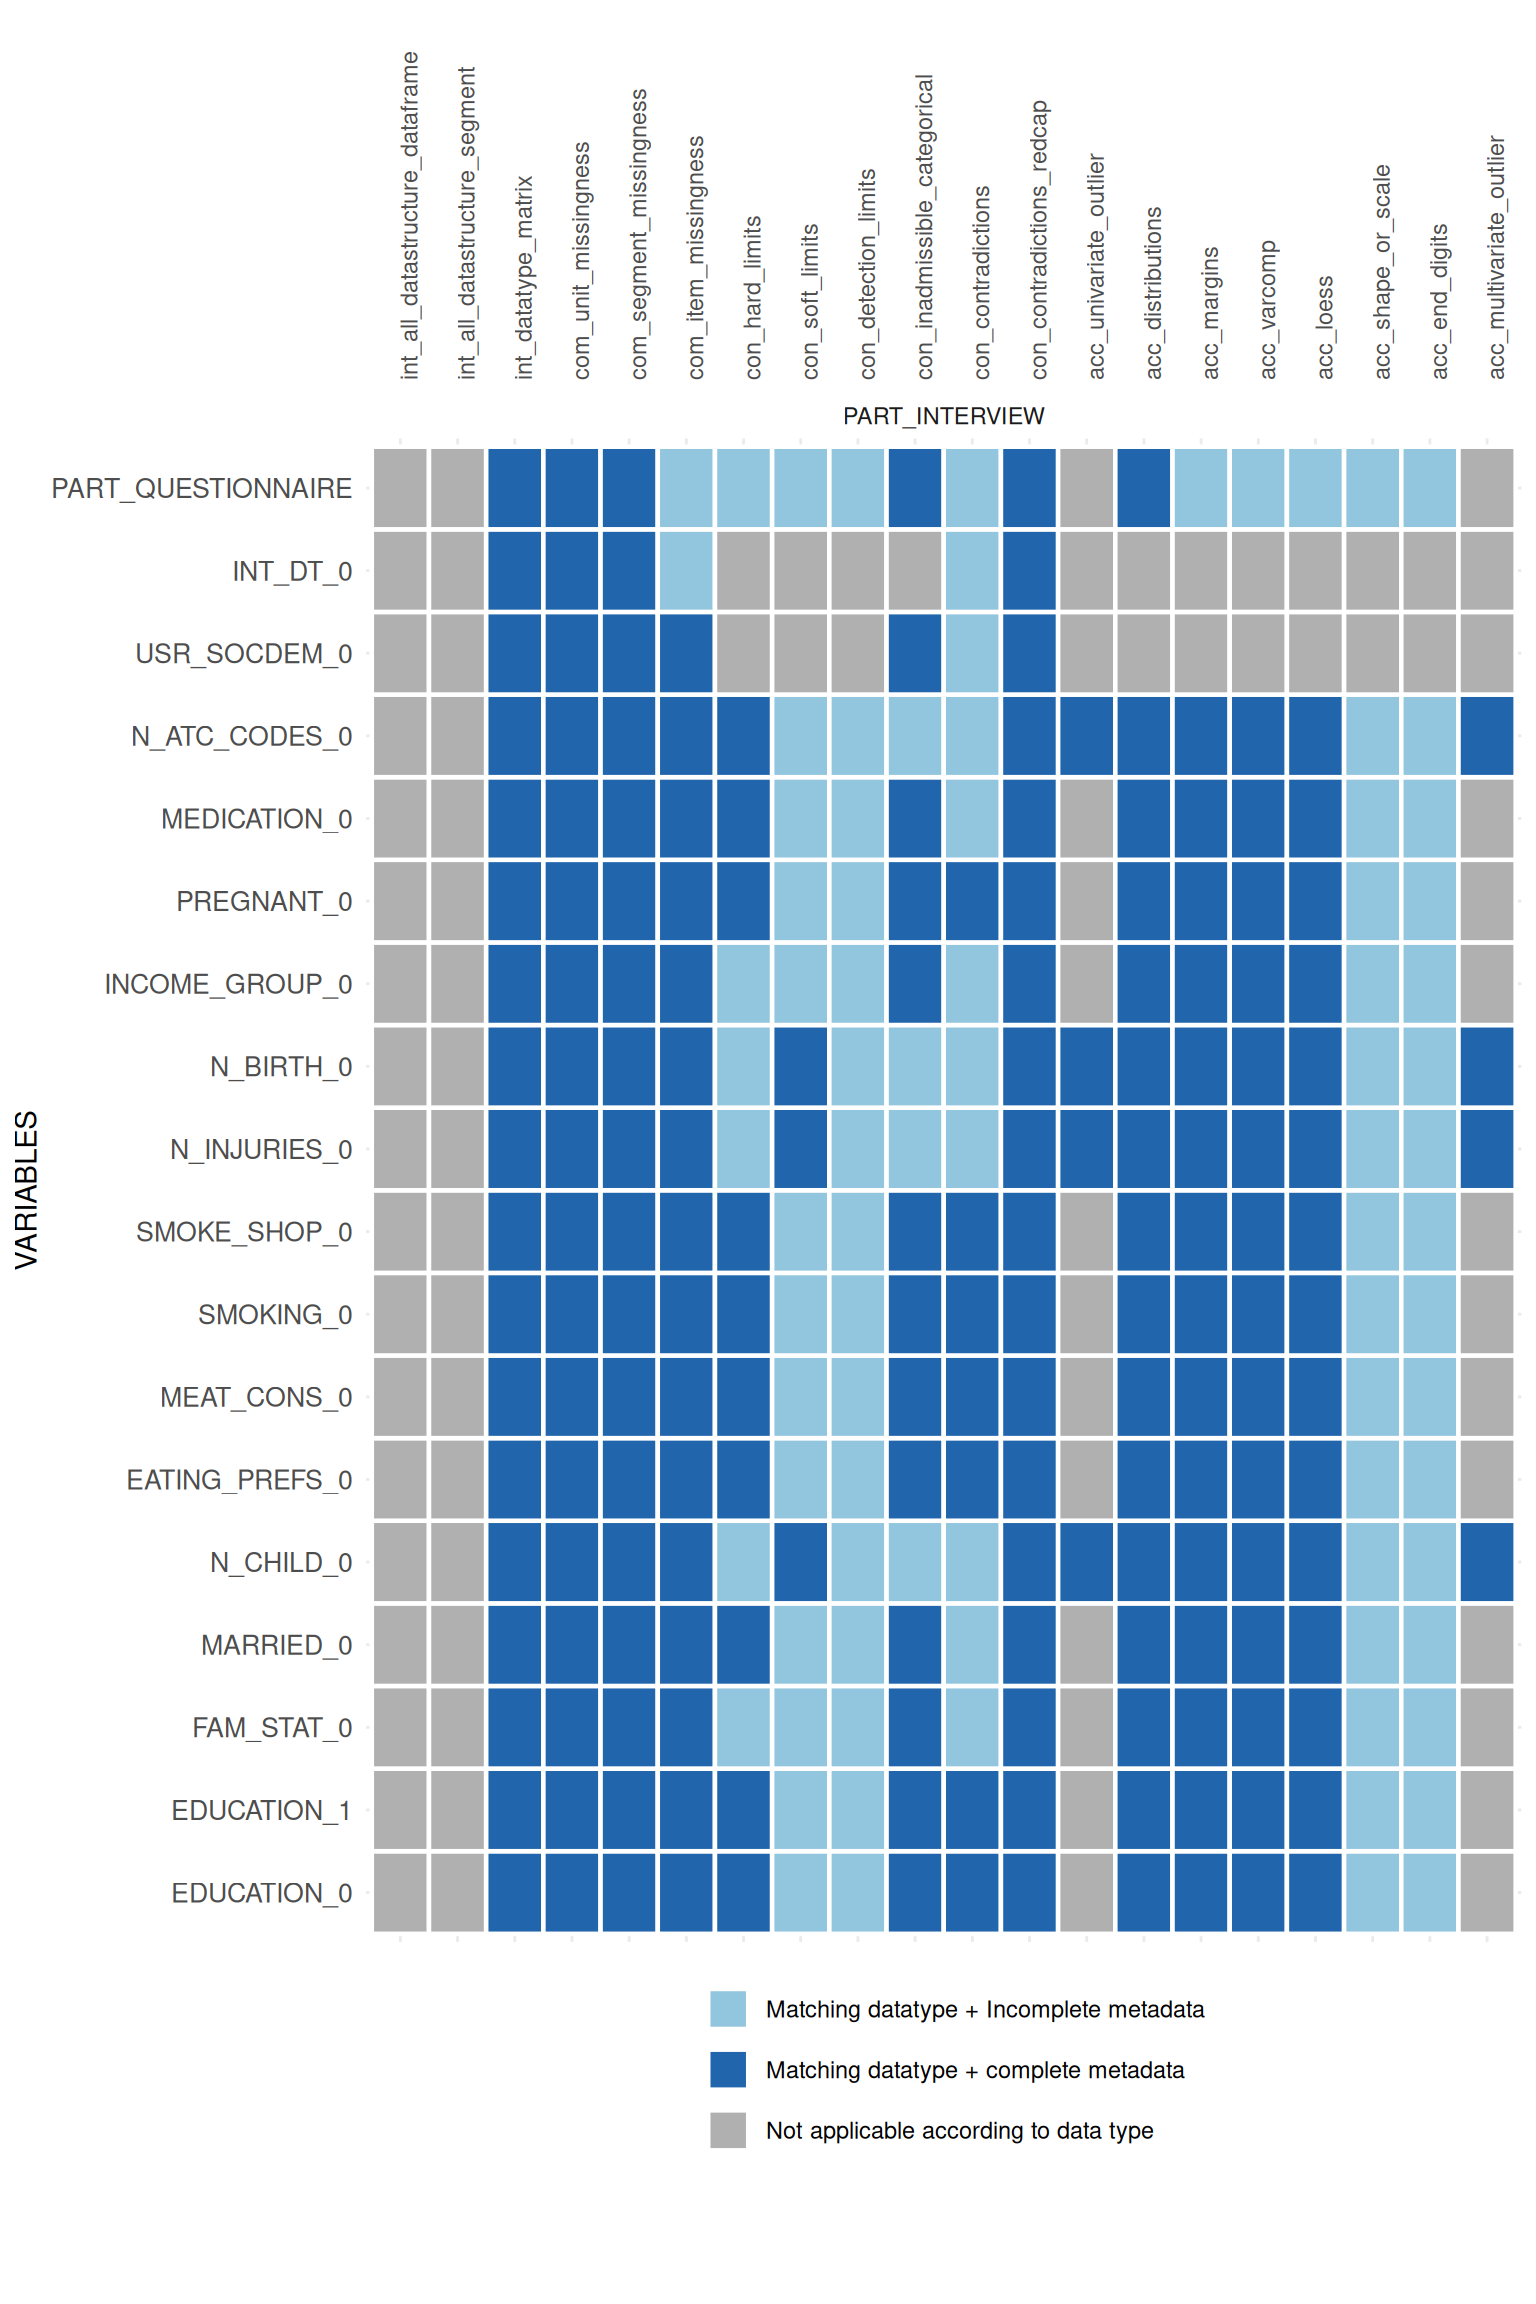
##
## $PART_LAB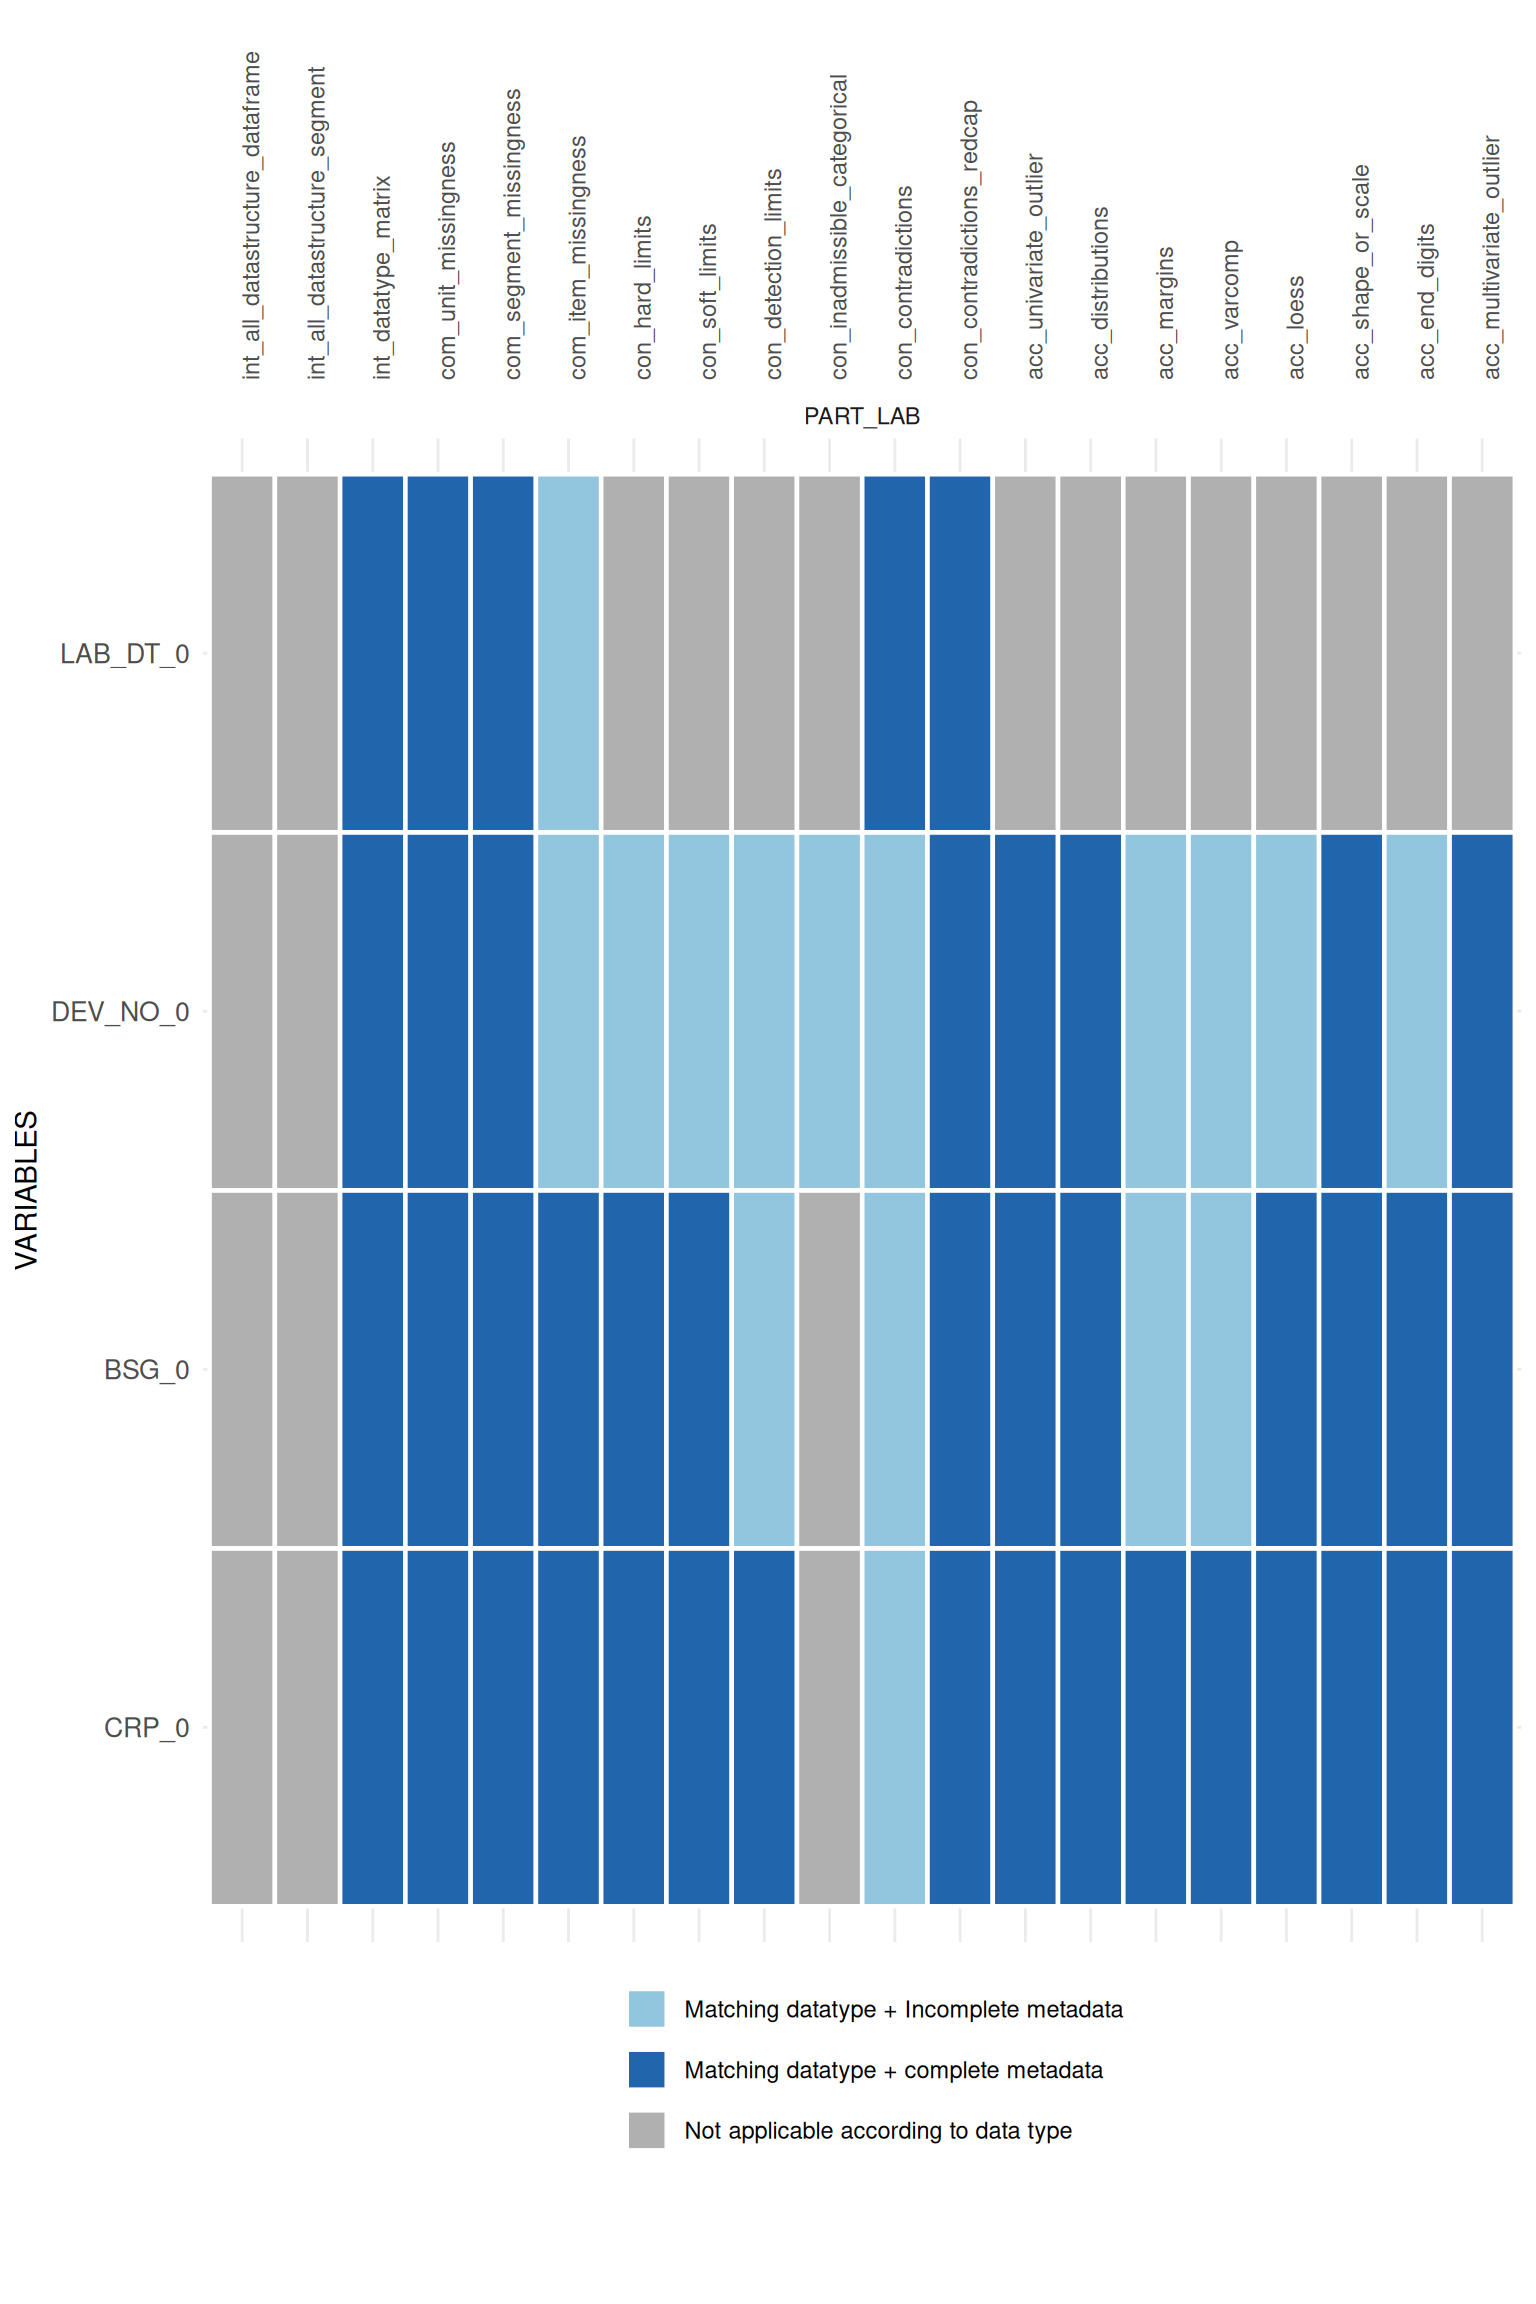
##
## $PART_PHYS_EXAM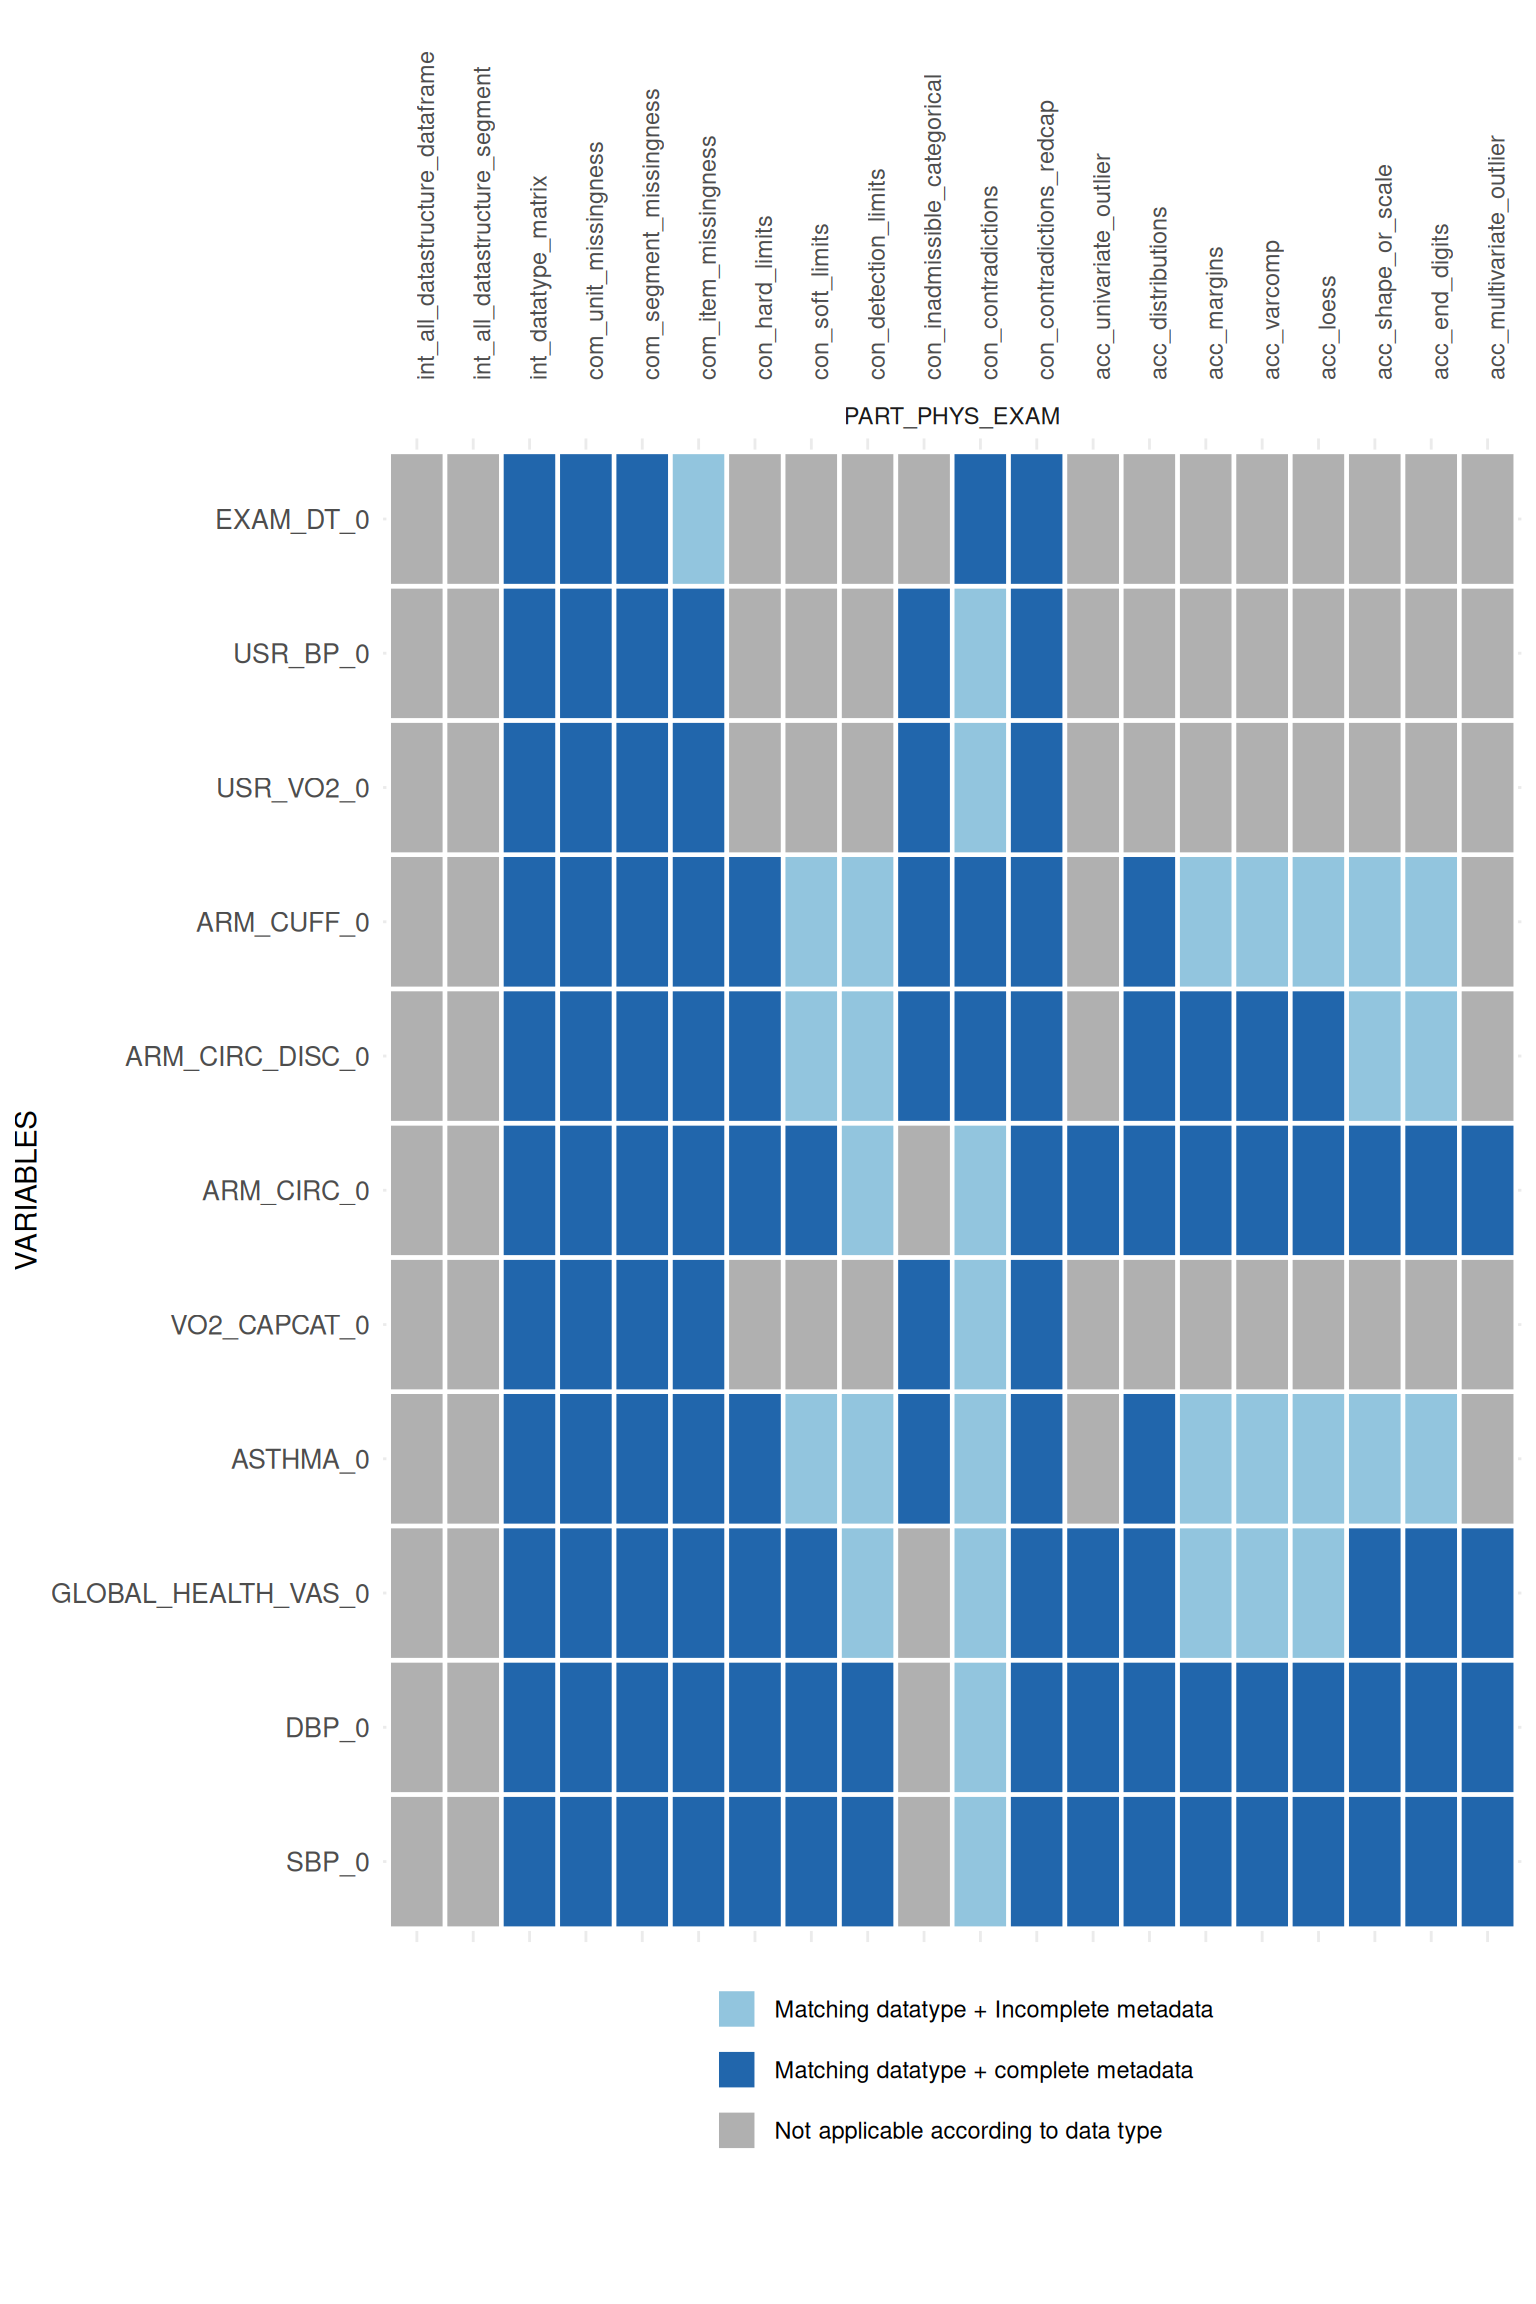
##
## $PART_QUESTIONNAIRE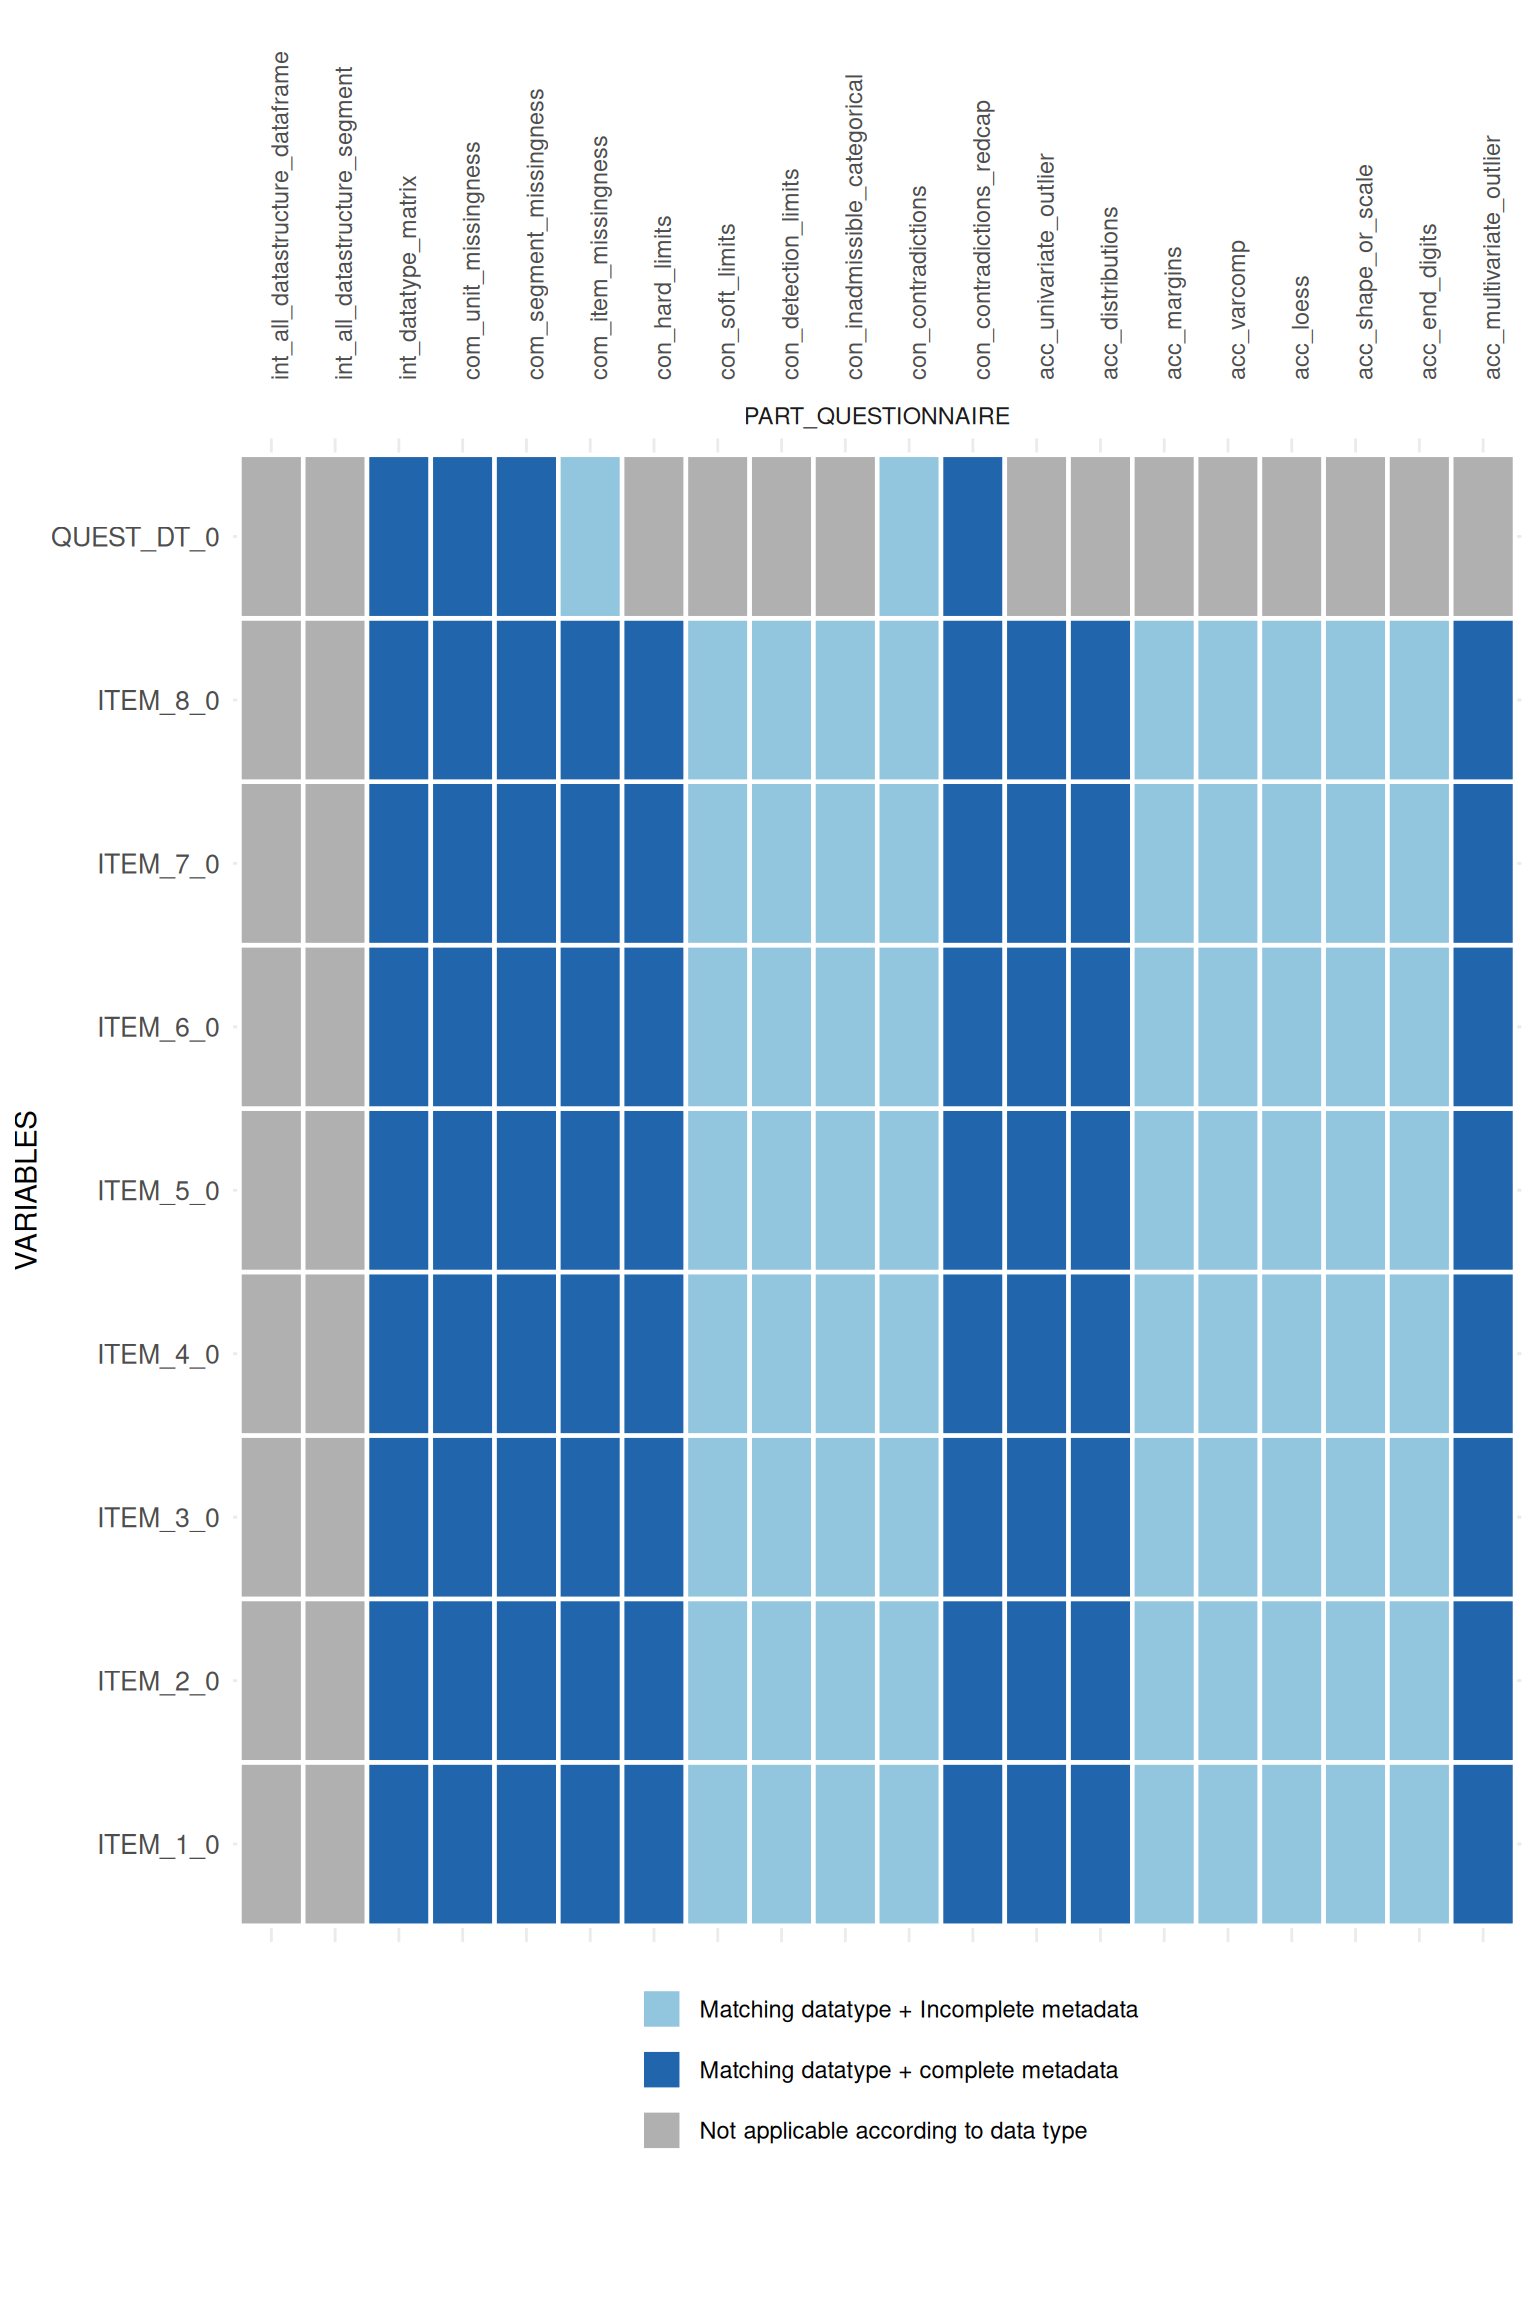
##
## $PART_STUDY