DEV_BP_0
dev_bp DEV_BP_0
Provides descriptive statistics for a subset or all categorical variables in the study data
Check if the declared data types in the metadata match the observed data types in the study data.
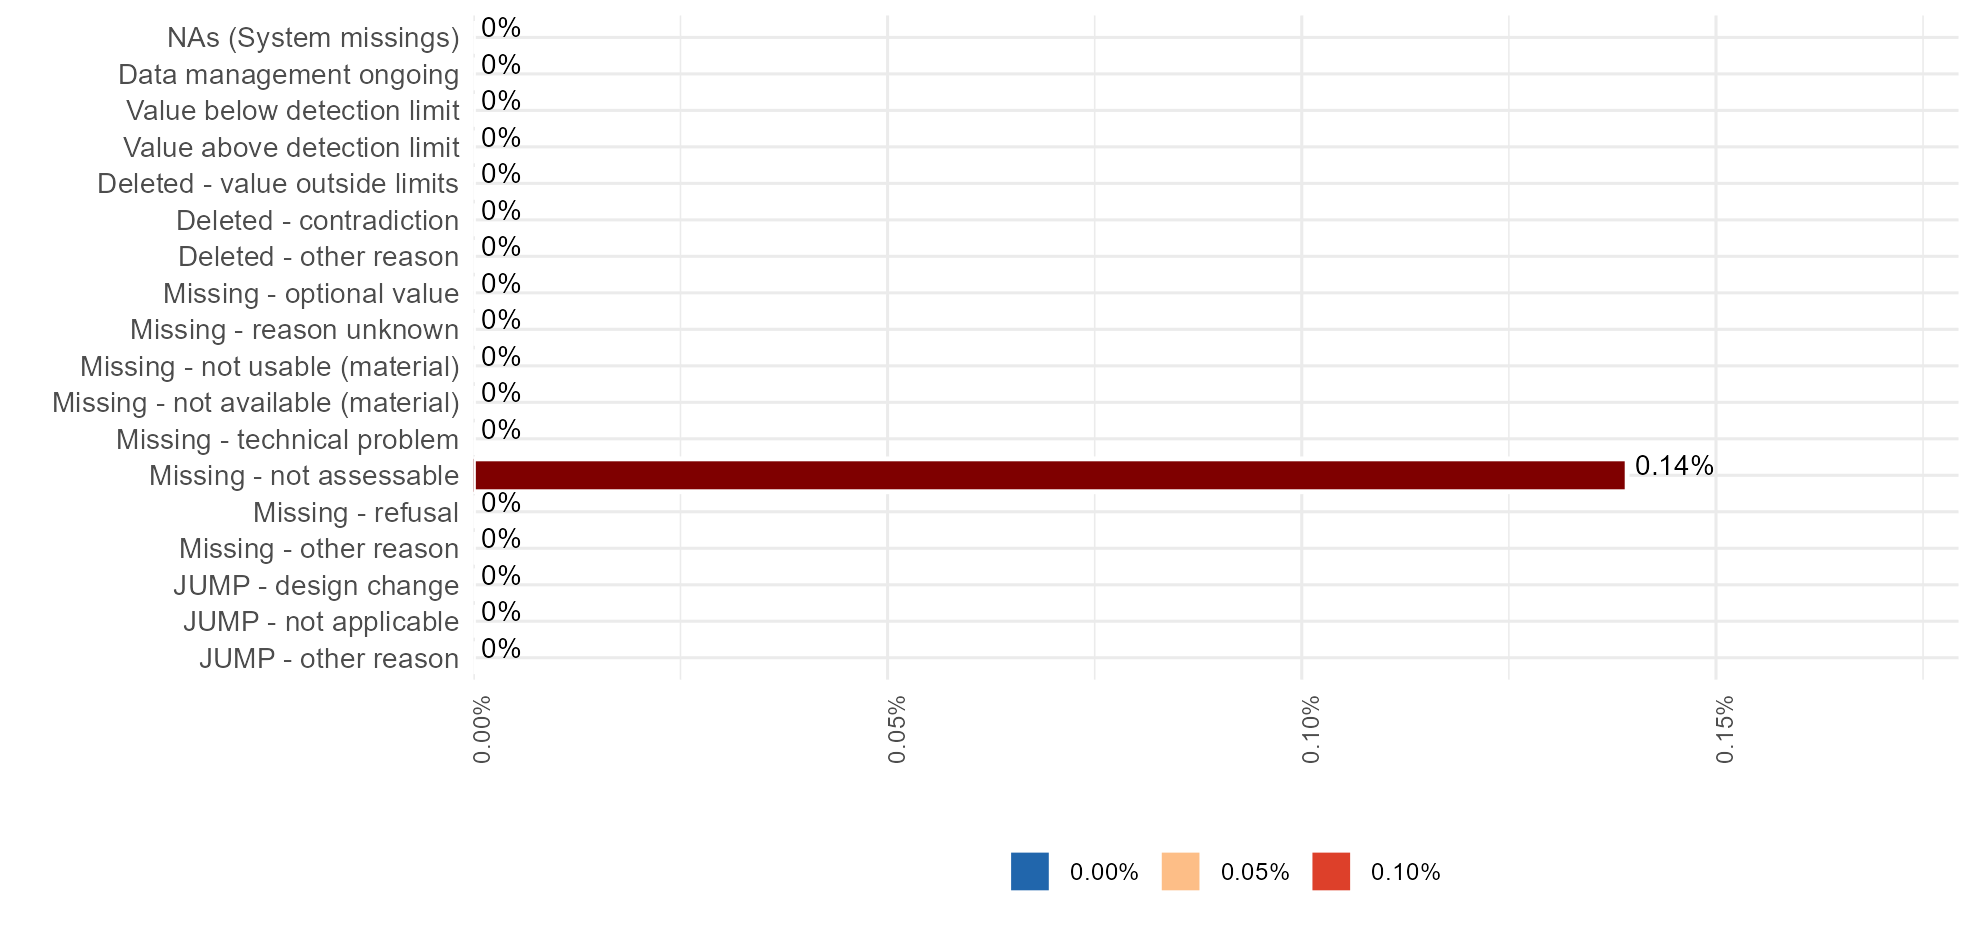
Presence and amount of missing data for each variable, separated by class of missingness (i.e., system missingness (NA), used missing codes and jump codes). The higher the number or percentage of missing values, the lower the data quality.
Note:
1. “ADDED: SysMiss” or “Sysmiss N” refers to NA’s (i.e., system-indicated missing values);
2. The percentage of all the columns in the table (except Measurements N (%)) are calculated over the Observation N. The percentage of Measurement N is calculated by dividing the value (Measurement N) by the difference between the number of observations and the number of jumps (Observation N - Jumps N).
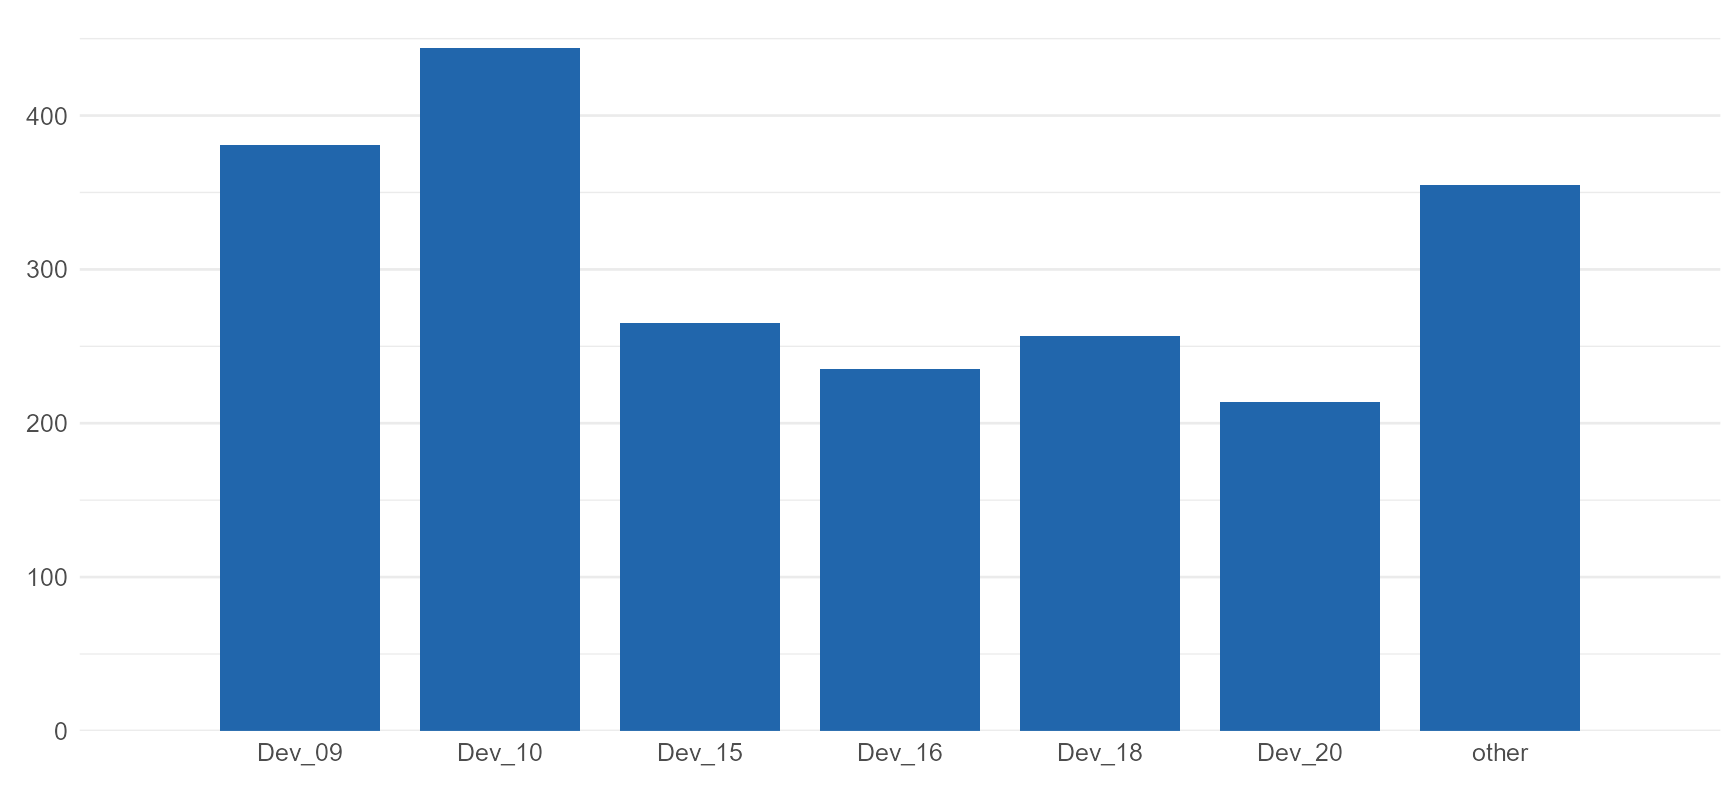
The higher the number of variables with unexpected location or proportions, the lower the data quality. Deviations from the expected central tendency or unexpected proportions might indicate data issues and should be further investigated. There is no formal interpretation rule for the histograms and bar plots; expert background knowledge on expected distribution of the targeted outcome variable in the studied sample is necessary.
Item-level Metadata