DIAB_AGE_ONSET_0
diab_age DIAB_AGE_ONSET_0
Provides descriptive statistics for a subset or all continuous variables in the study data
Check if the declared data types in the metadata match the observed data types in the study data.
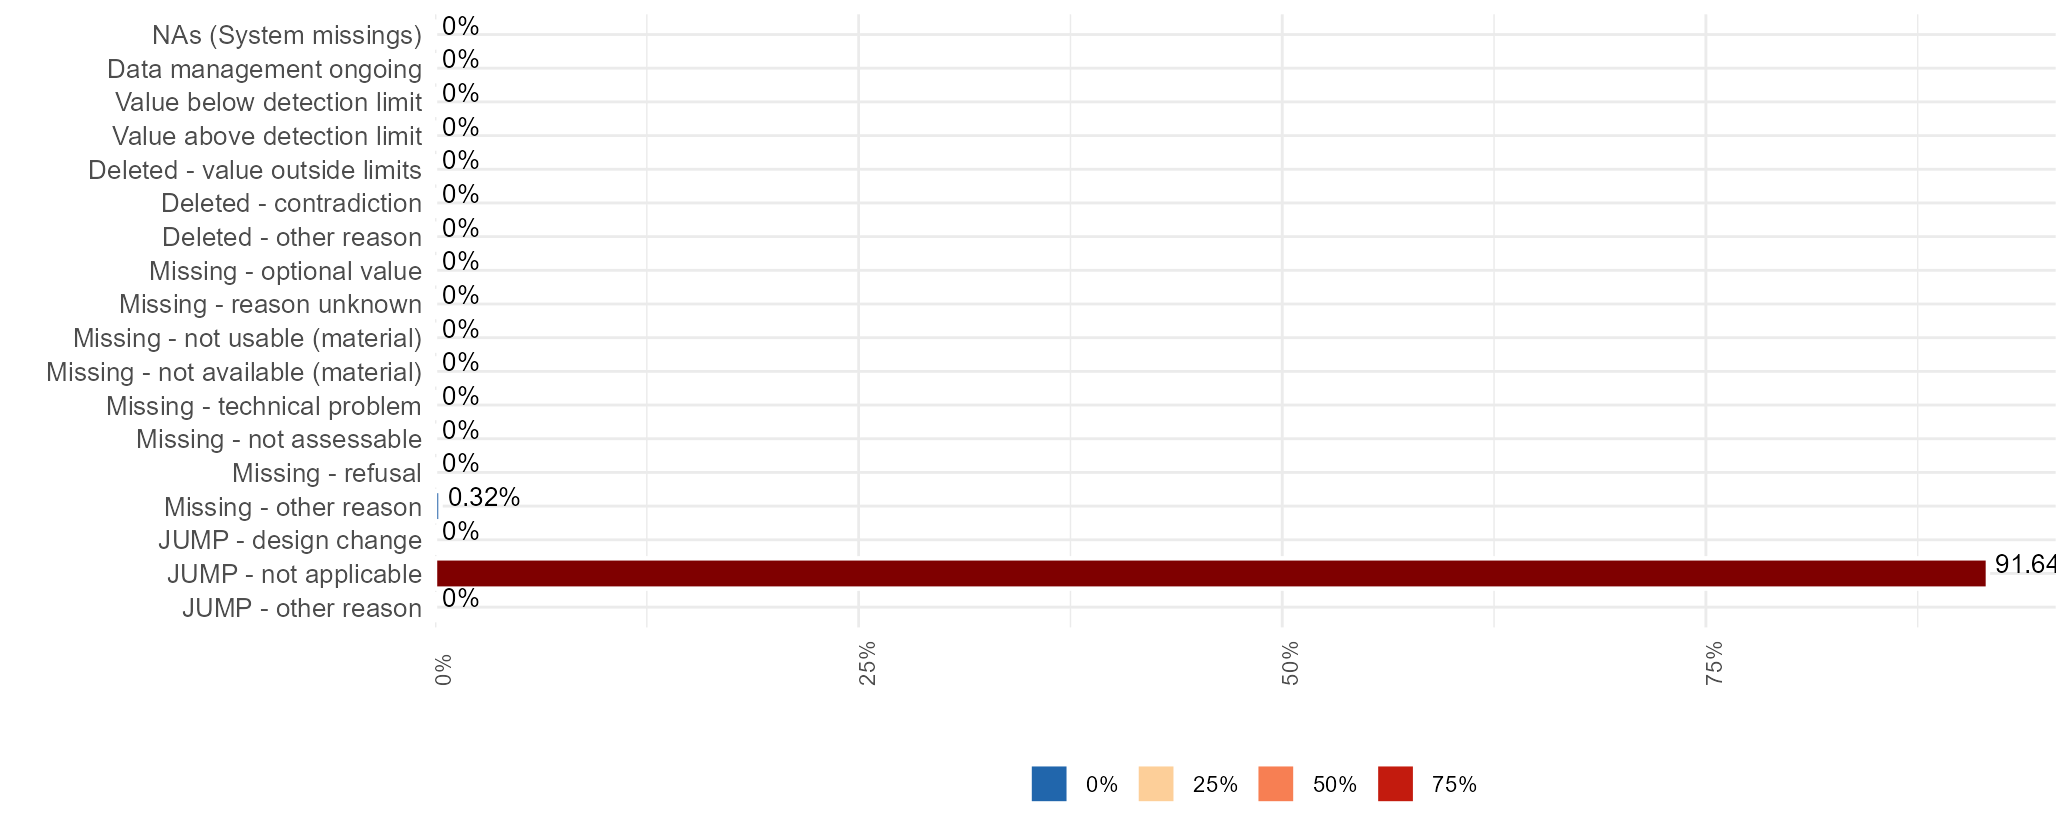
Presence and amount of missing data for each variable, separated by class of missingness (i.e., system missingness (NA), used missing codes and jump codes). The higher the number or percentage of missing values, the lower the data quality.
Note:
1. “ADDED: SysMiss” or “Sysmiss N” refers to NA’s (i.e., system-indicated missing values);
2. The percentage of all the columns in the table (except Measurements N (%)) are calculated over the Observation N. The percentage of Measurement N is calculated by dividing the value (Measurement N) by the difference between the number of observations and the number of jumps (Observation N - Jumps N).
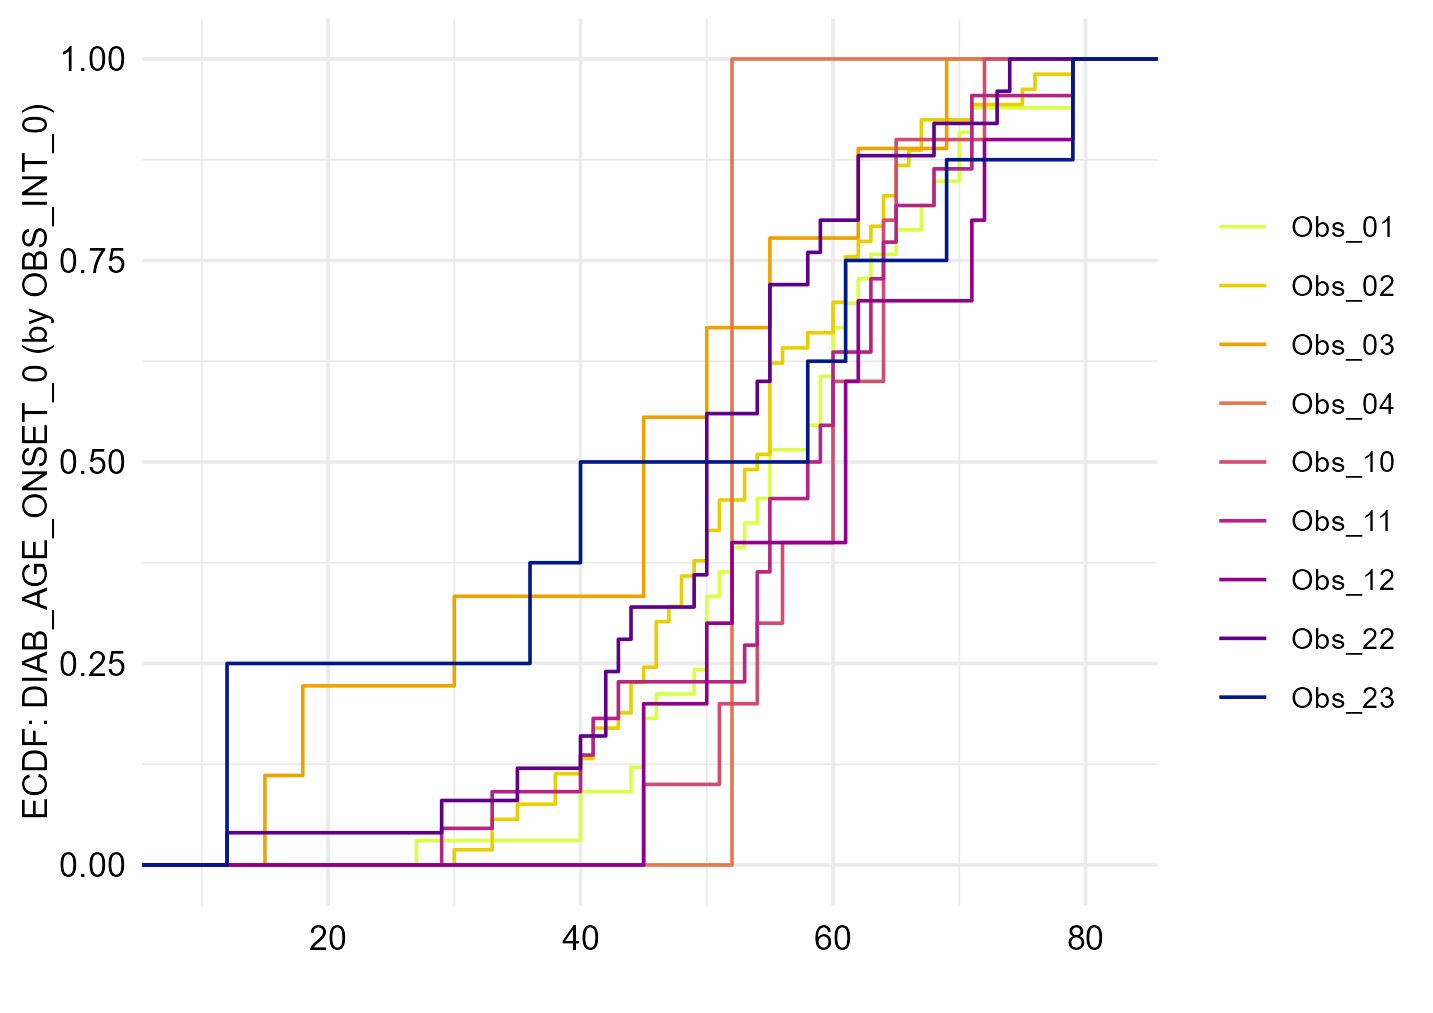
No description found for "acc_distributions_ecdf_observer"
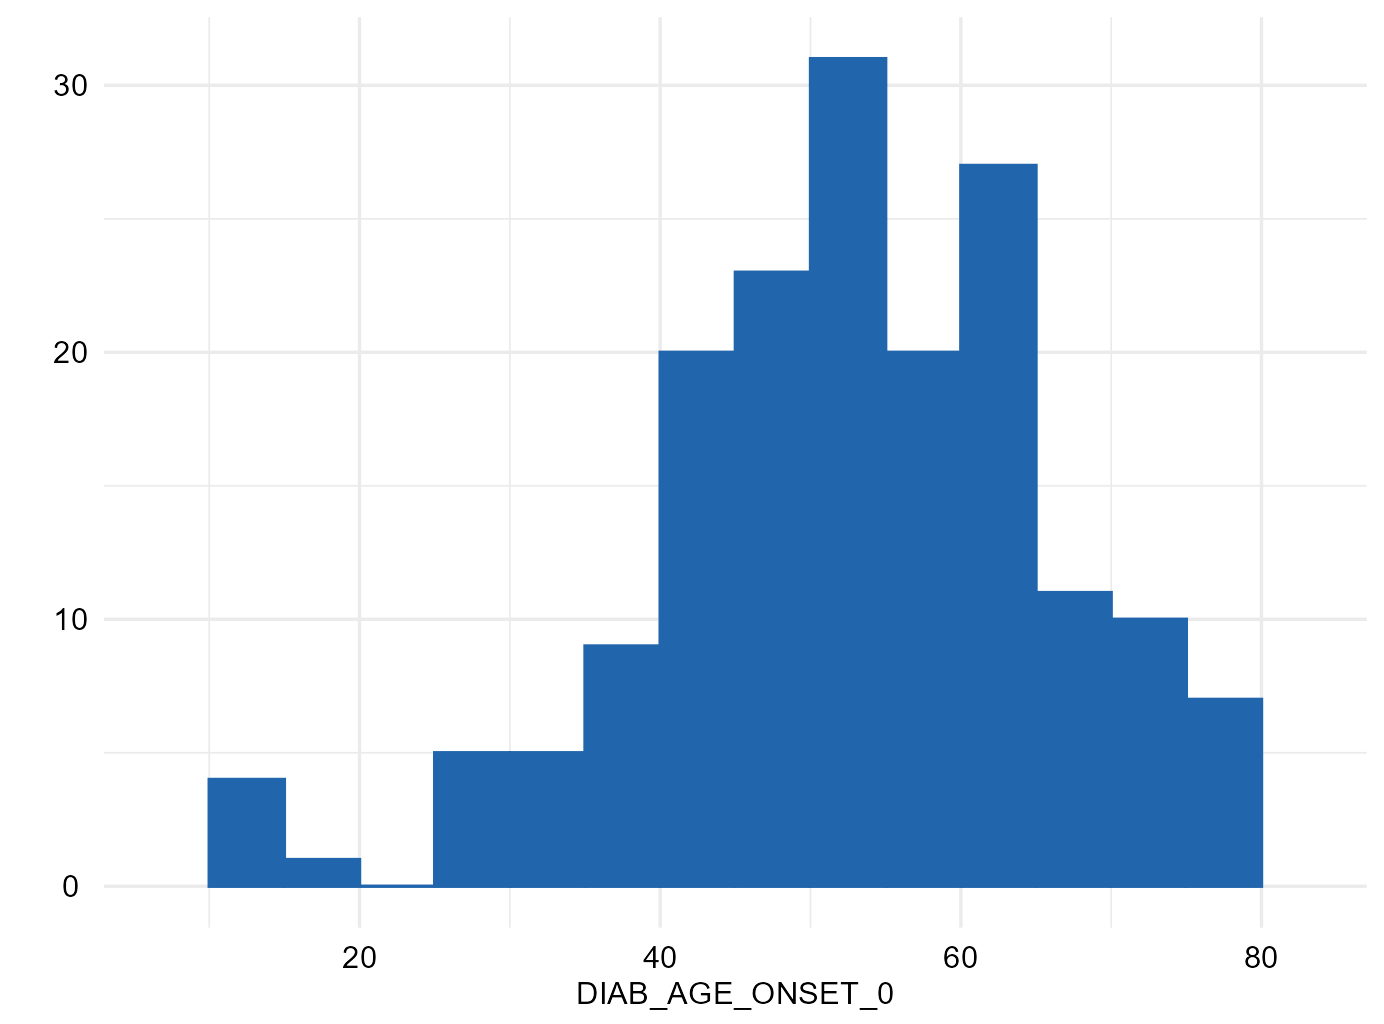
Distribution plots for the variables in the study data (distributions are described using bar plots in case of categorical data and histograms for numerical data).
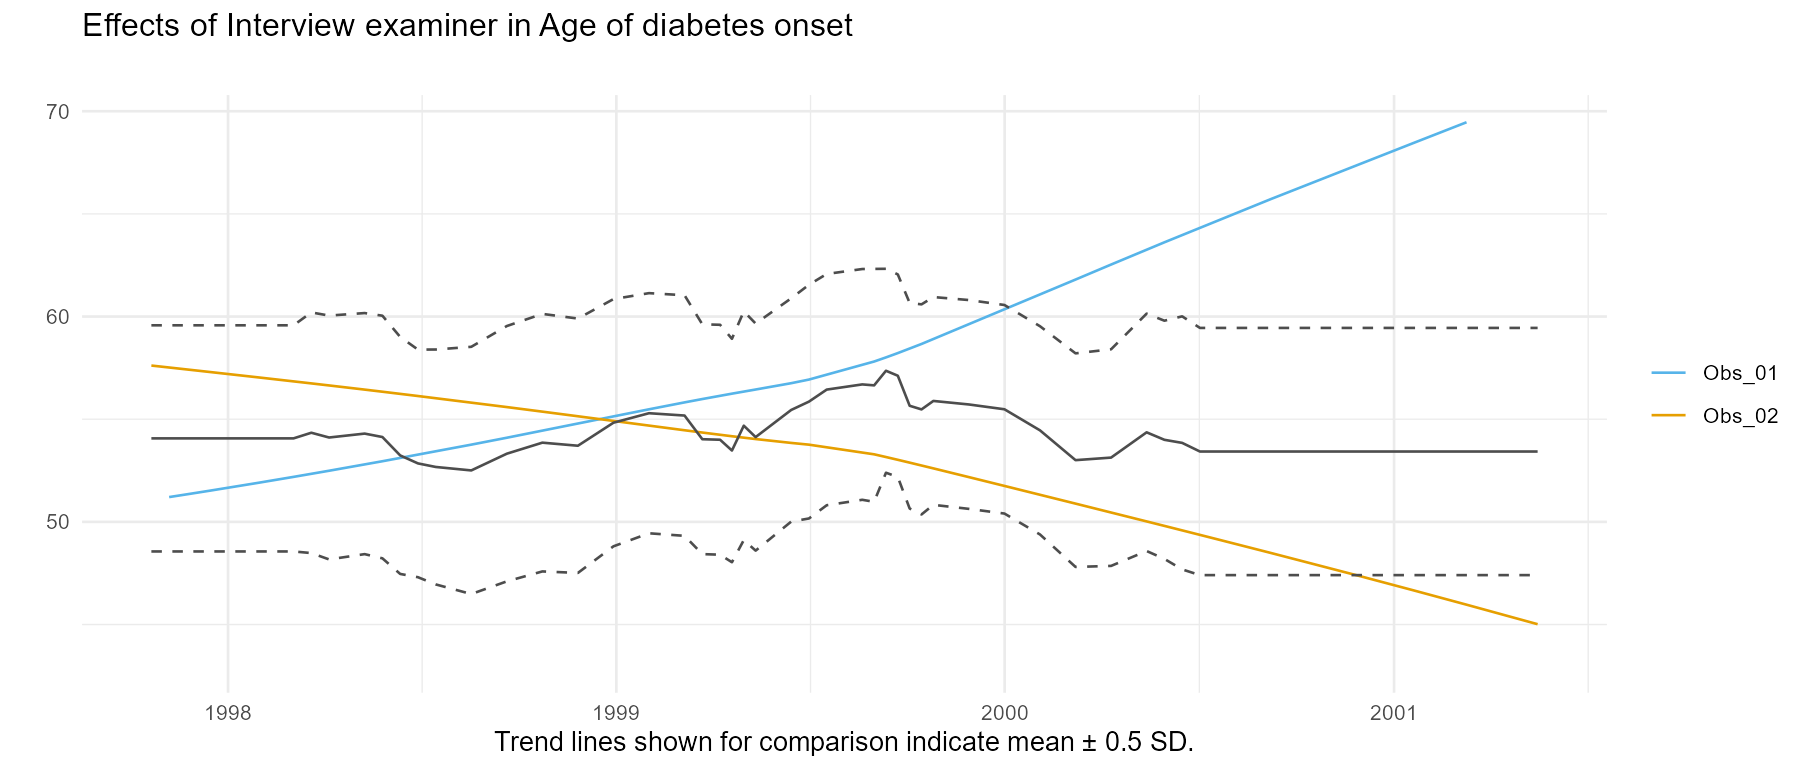
No description found for "acc_loess_observer"
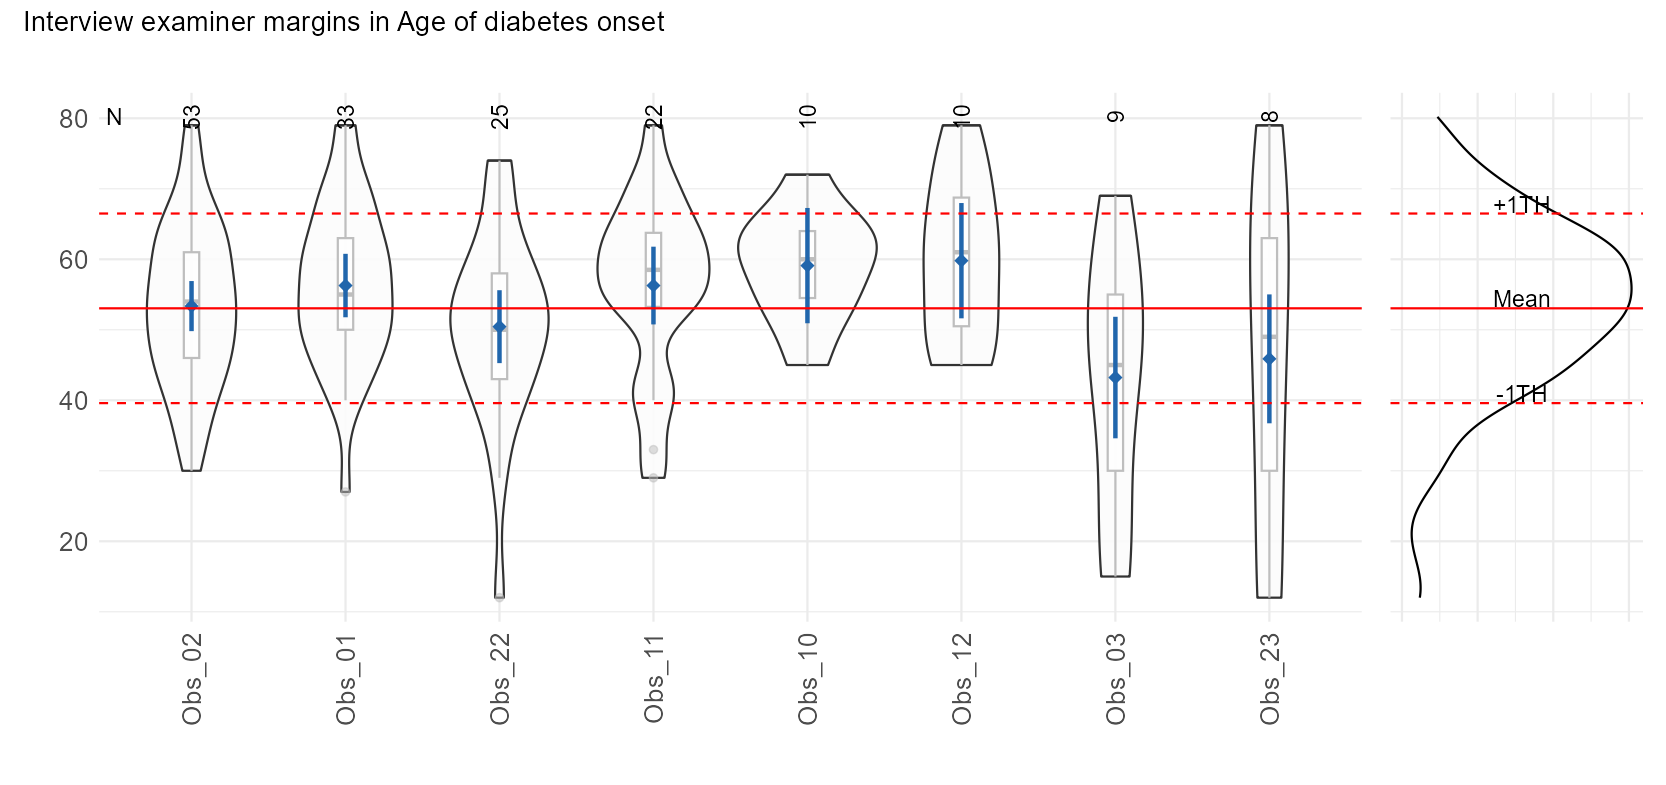
No description found for "acc_margins_observer"
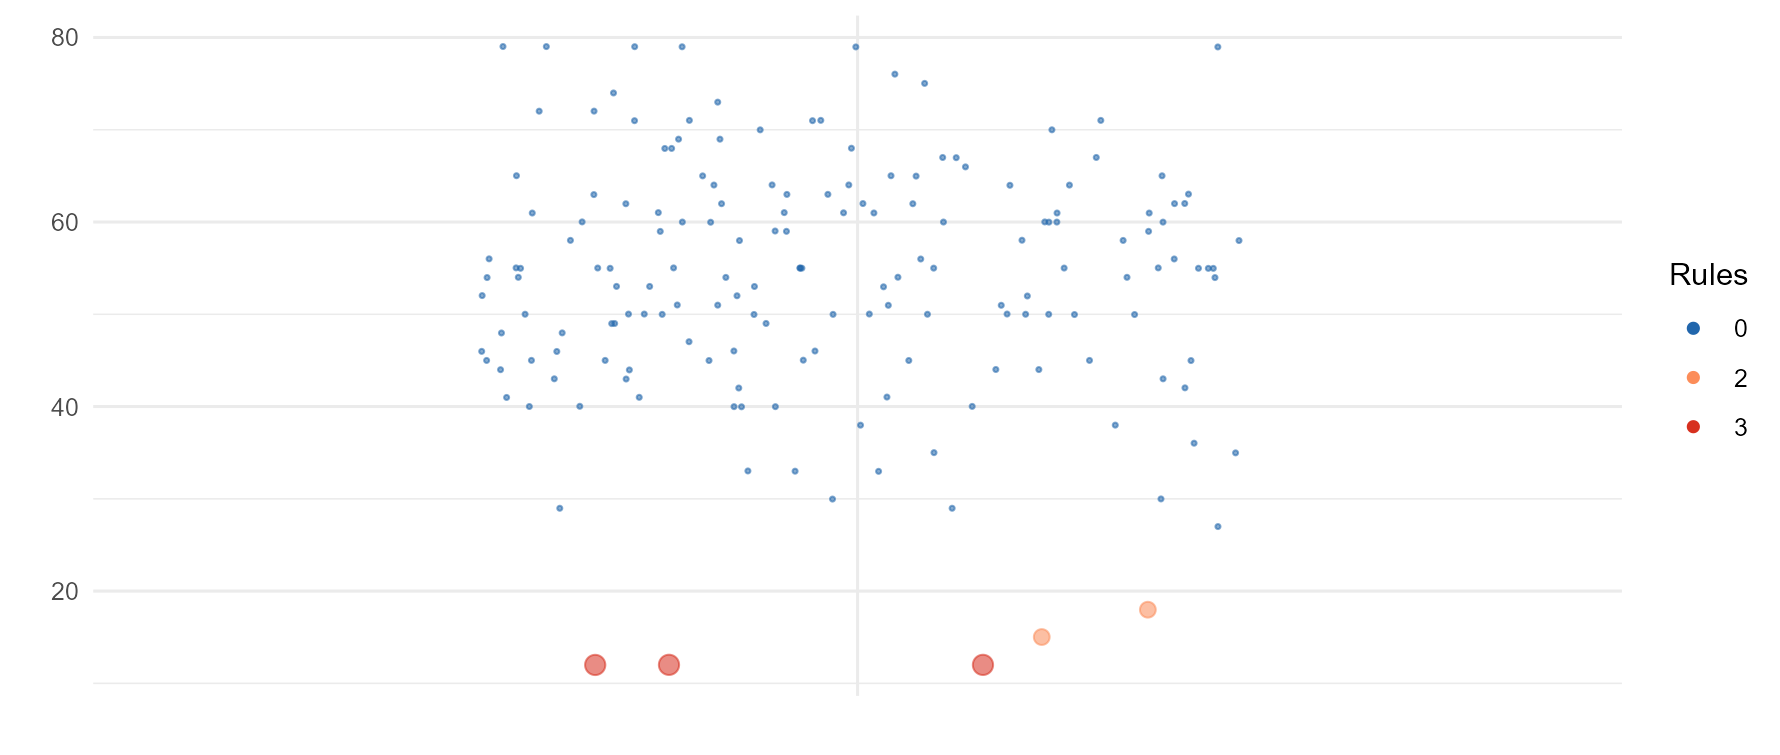
Presence of outliers in the study data are checked using 4 approaches (Tukey, 3SD, Hubert, and SigmaGap). For each value it is indicated how many approaches identifies it as outlier (0 = not an outlier, 4 = an outlier based on 4 approaches).
The higher the number or percentage of identified outliers, the lower potentially the data quality.
No description found for "acc_varcomp_observer"
Item-level Metadata