Distribution
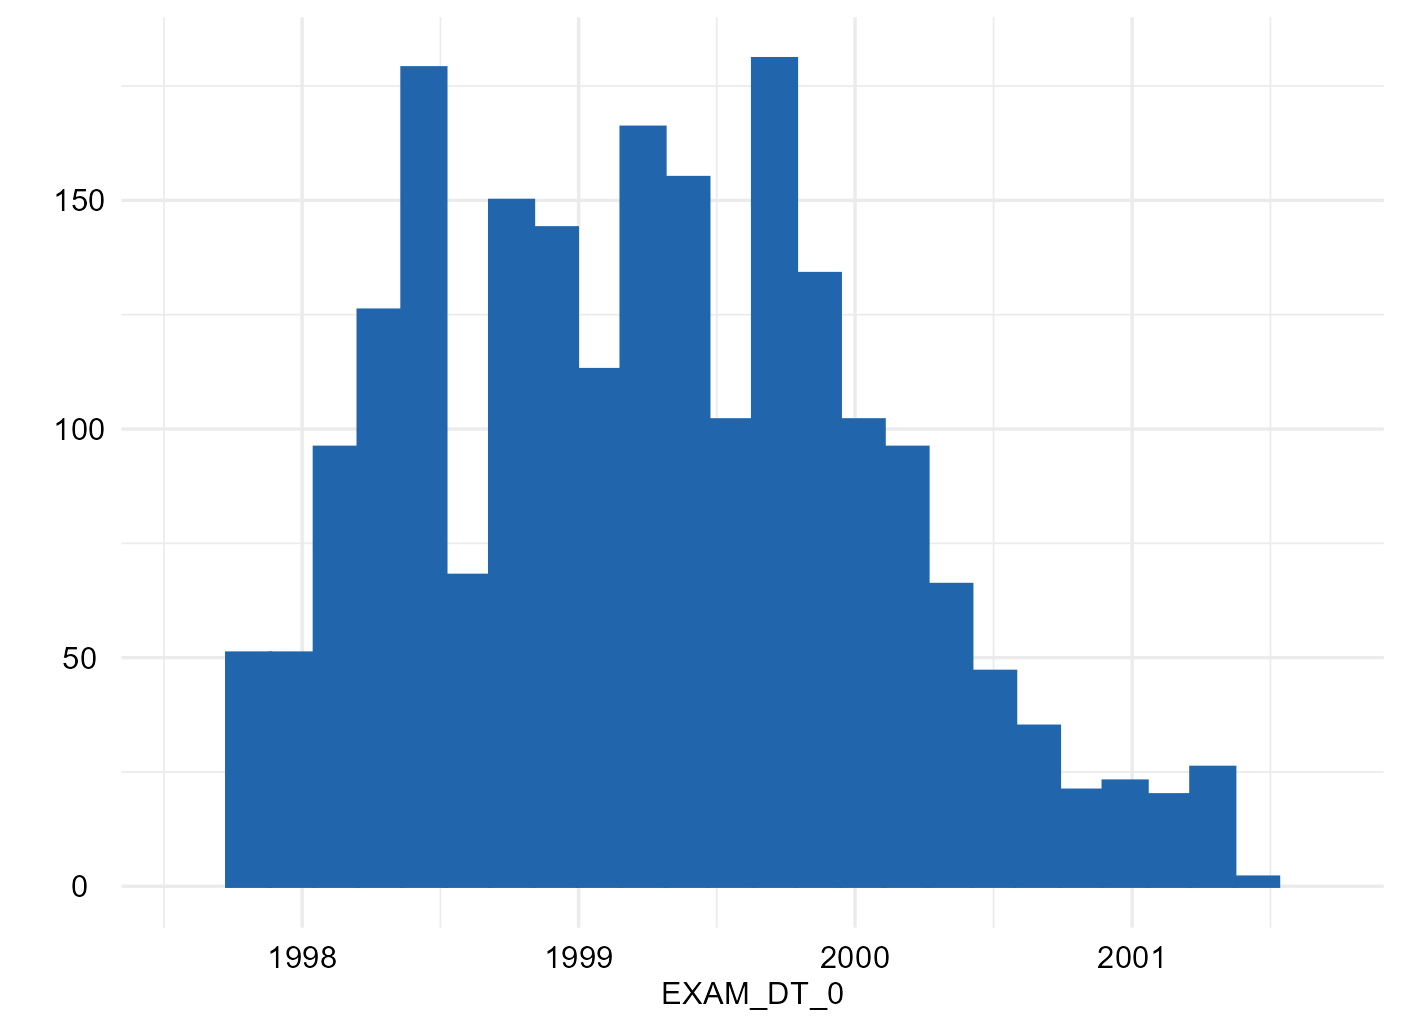
EXAM_DT_0
exdate
Examination date and time
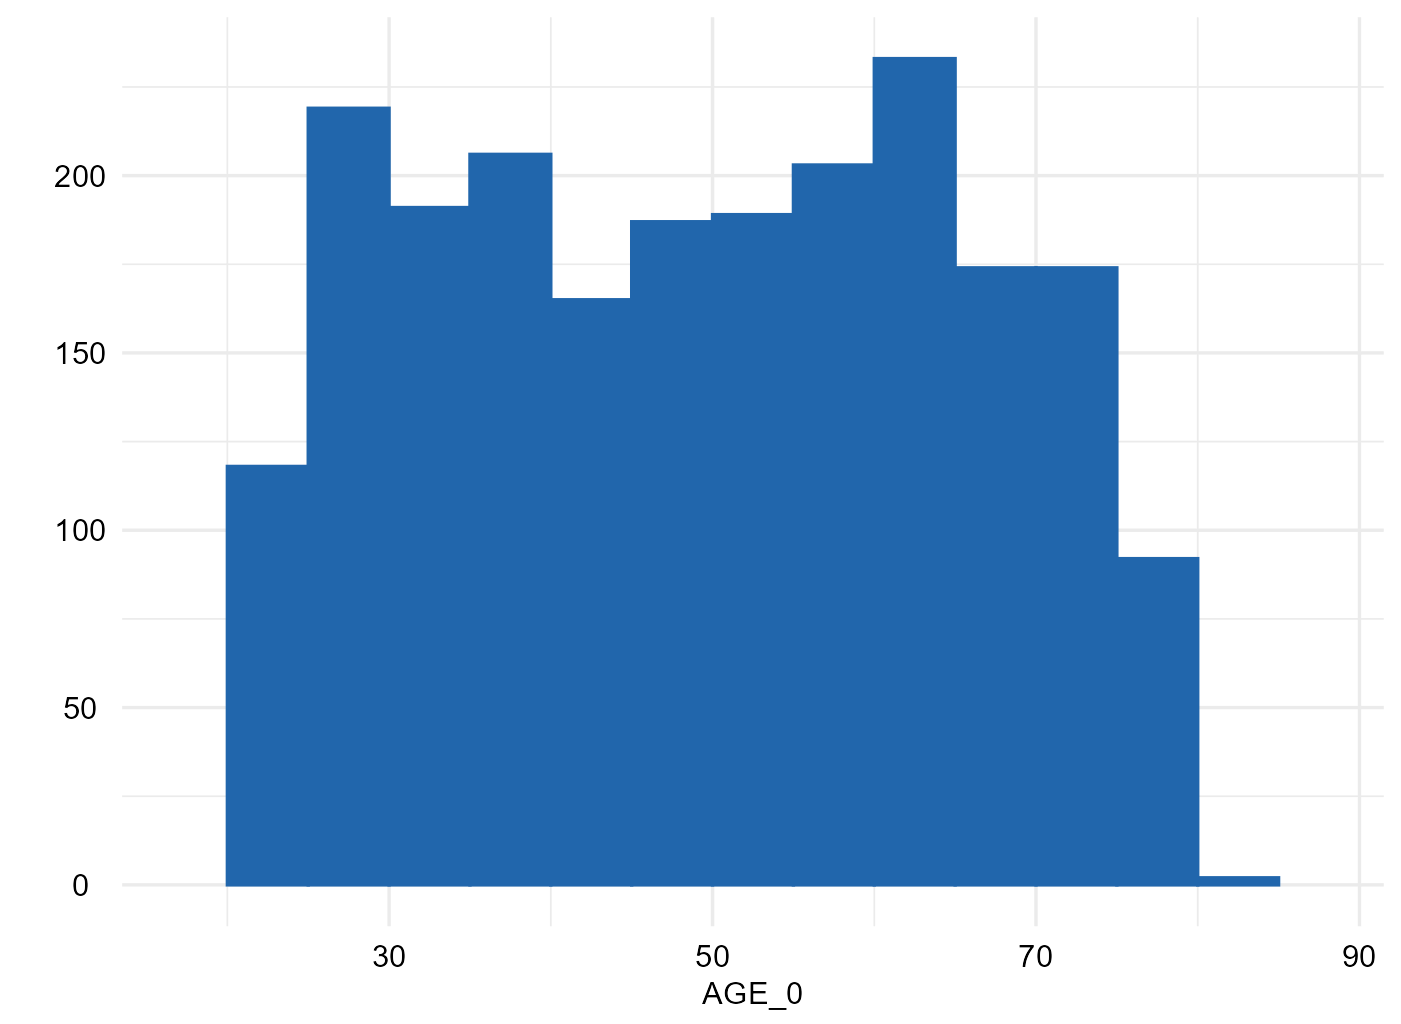
AGE_0
age
Age
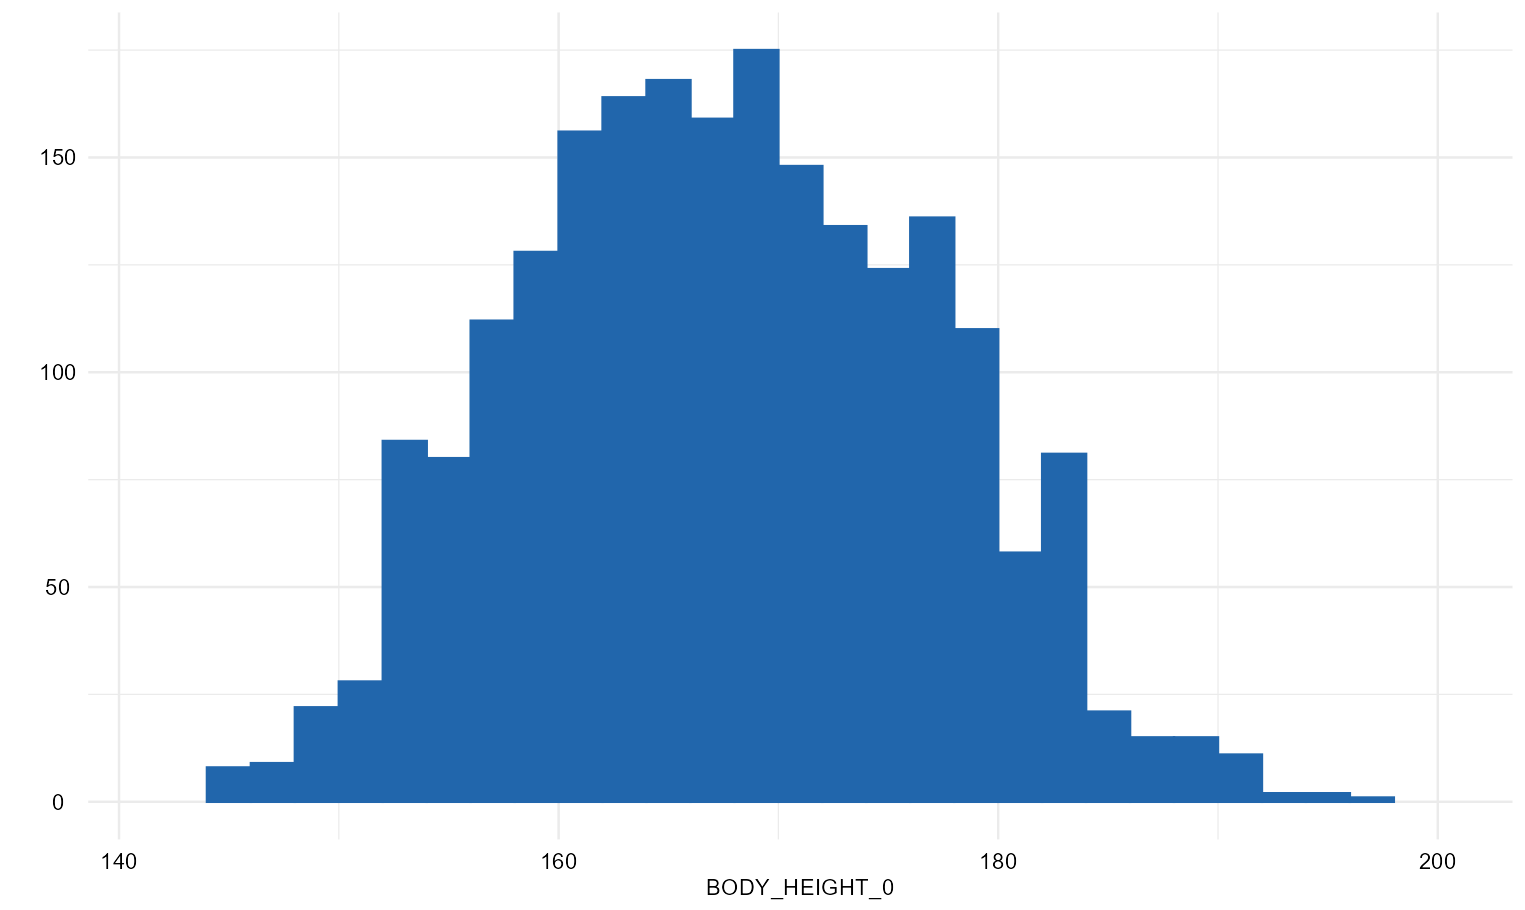
BODY_HEIGHT_0
height
Body height
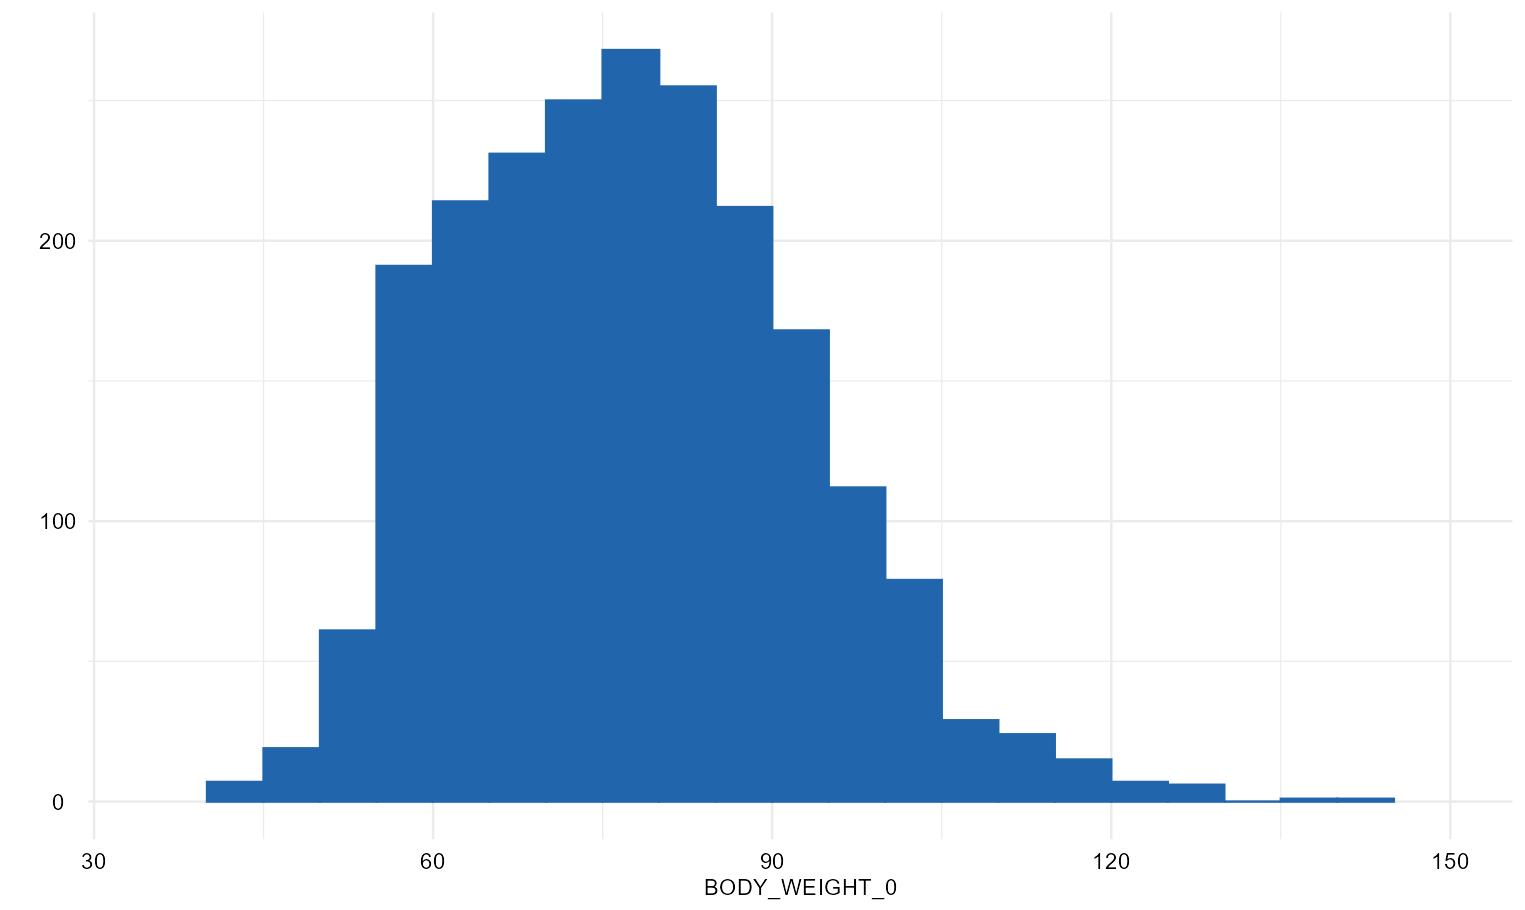
BODY_WEIGHT_0
weight
Body weight
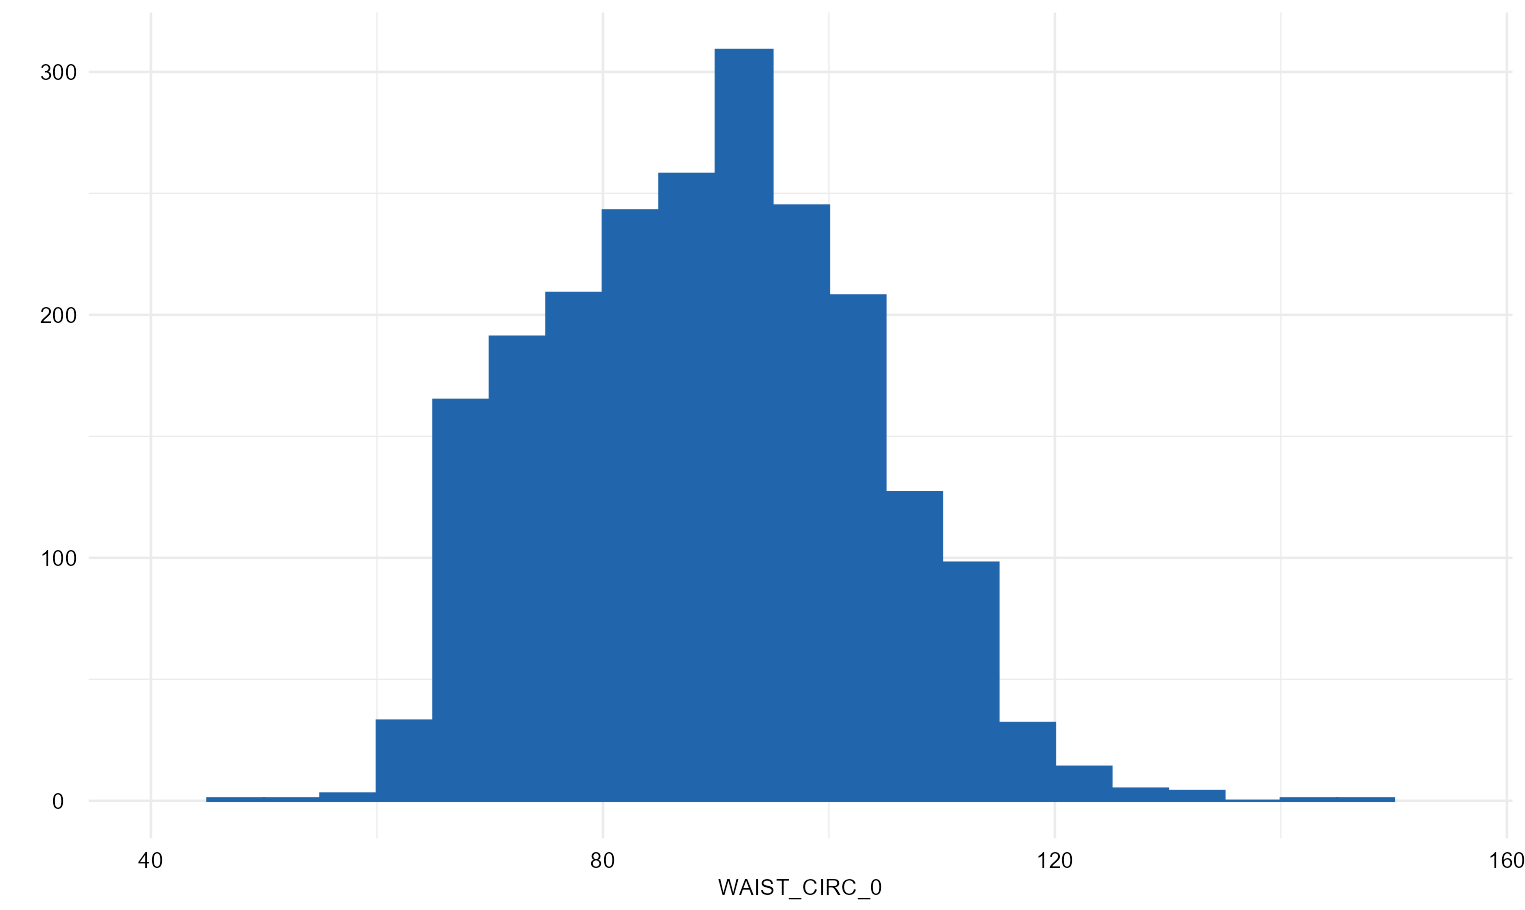
WAIST_CIRC_0
waist
Waist circumference
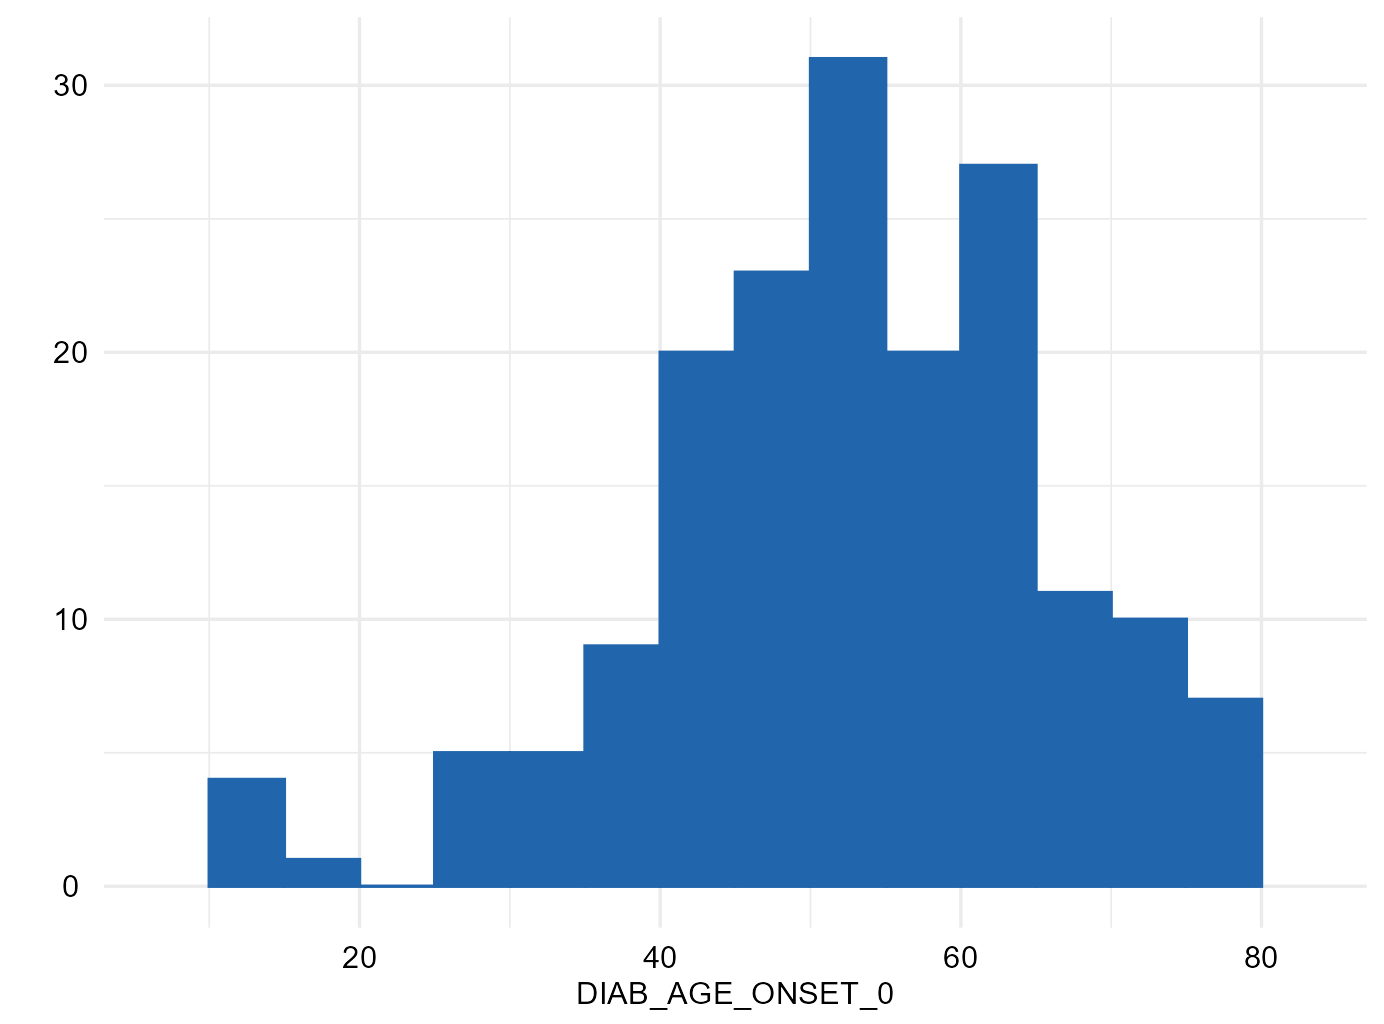
DIAB_AGE_ONSET_0
diab_age
Age of diabetes onset
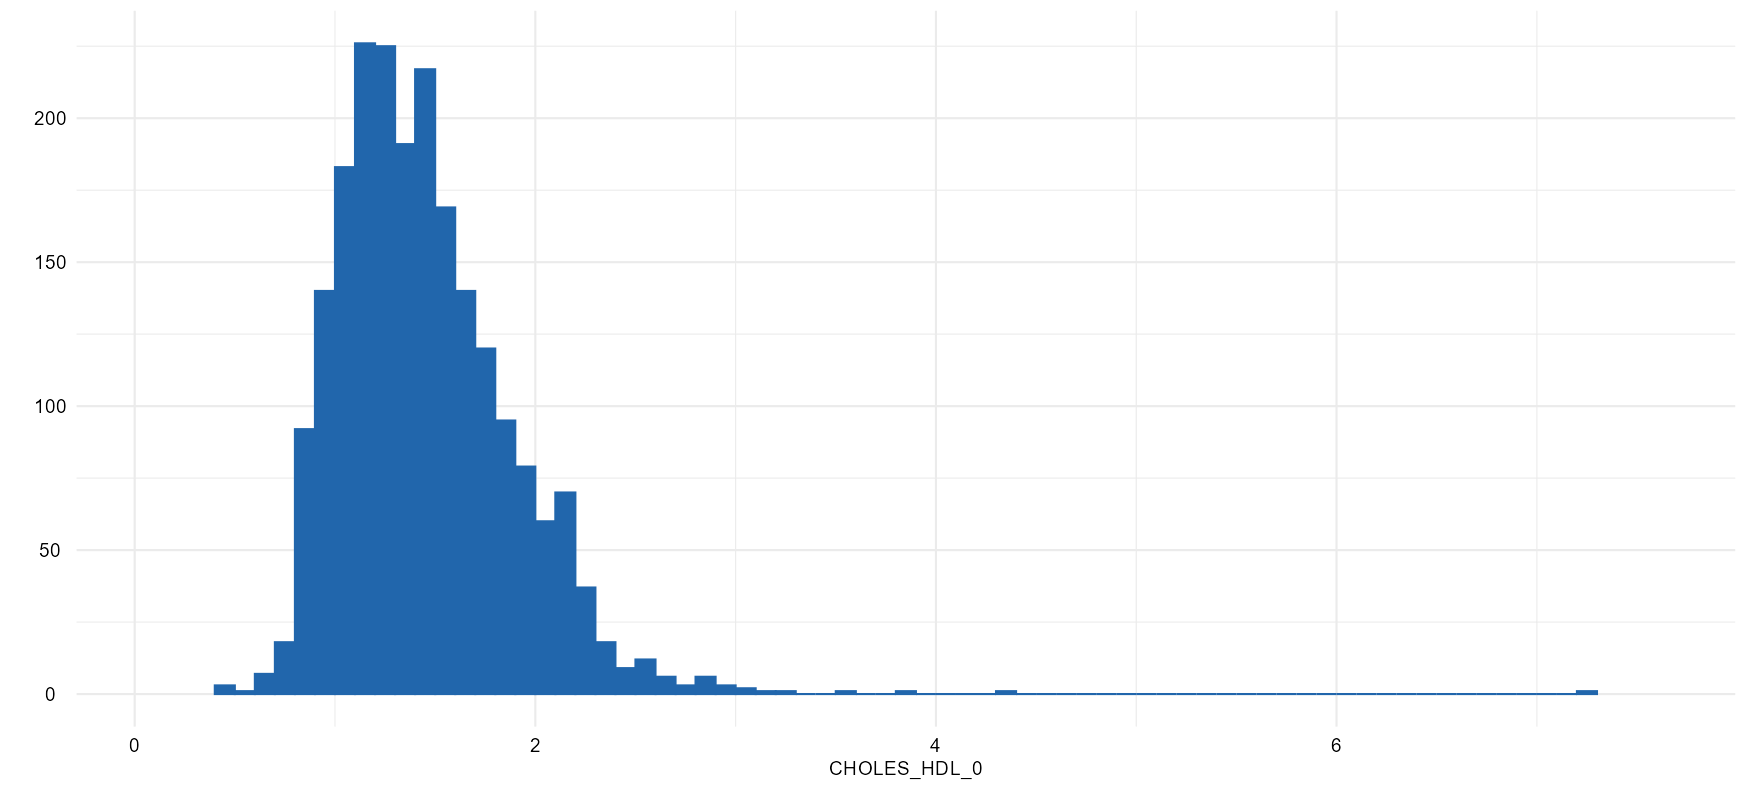
CHOLES_HDL_0
hdl
HDL-cholesterol
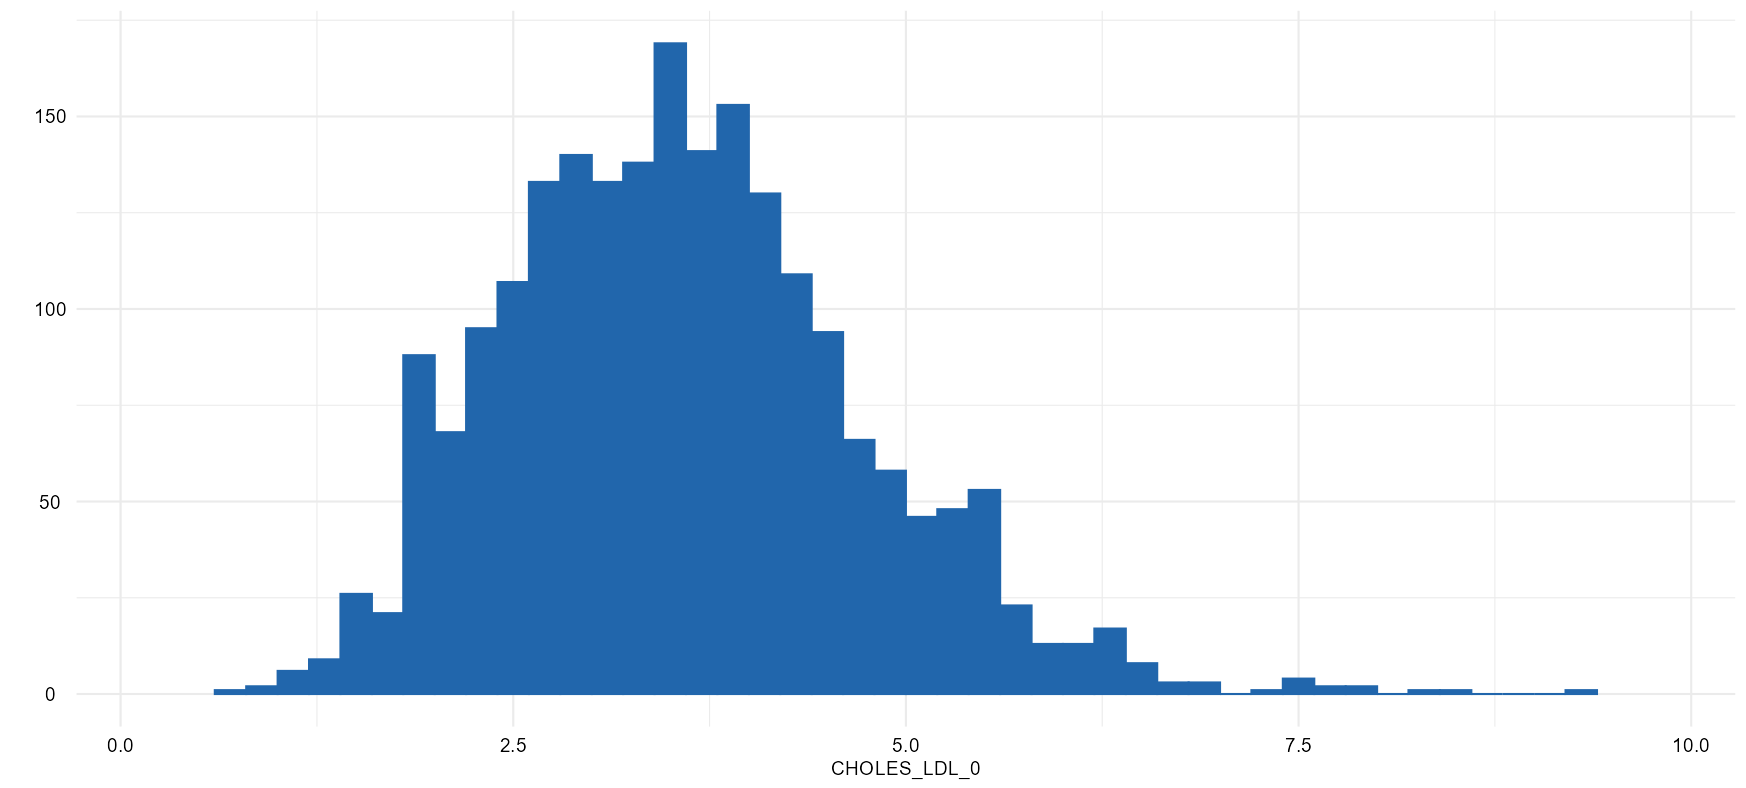
CHOLES_LDL_0
ldl
LDL-cholesterol
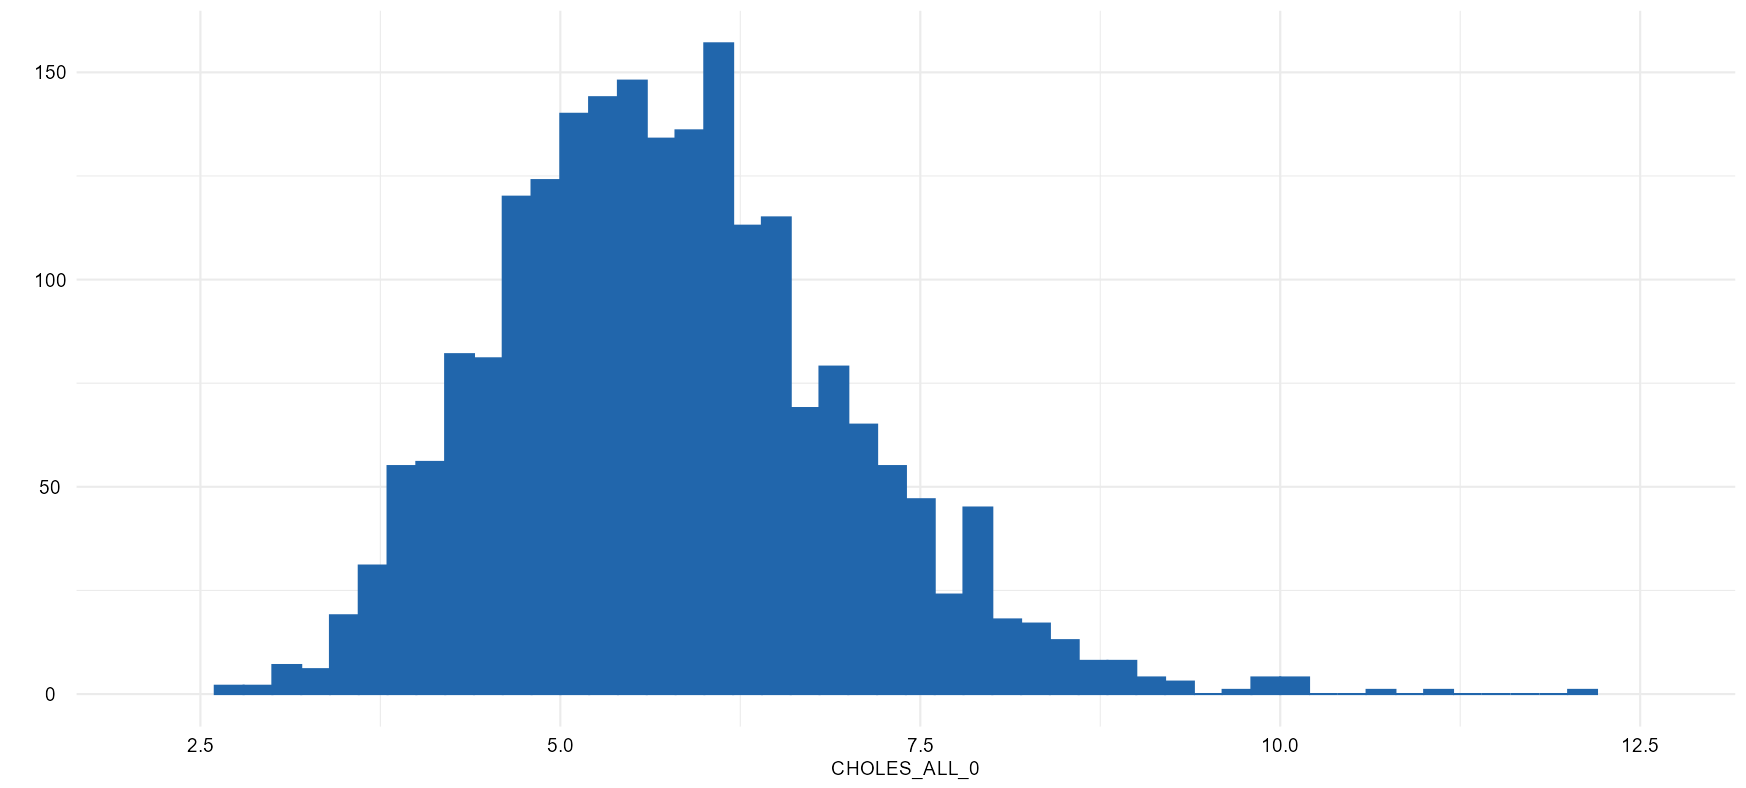
CHOLES_ALL_0
cholesterol
Total cholesterol