 Data Quality
Segment level data quality assessment example
Introduction
We may be interested in an examination set or a group of examinations within a study for a data quality evaluation. In this case, we refer to the segment level when we use a subset of the data elements in the study database for data quality reporting. Here, for example, we might want to know whether we have the correct subset of participants for a given examination. This tutorial shows how to compute data quality indicators at the segment level using dataquieR.
Example data
To illustrate the functionalities, we use a subset of the example SHIP data that are bundled with the dataquieR package. See the introductory tutorial for instructions on importing these files into R, as well as details on their structure and contents.
The basic workflow is:
library(dataquieR)
sd1 <- prep_get_data_frame("ship")
Required metadata
To evaluate data quality at the segment level, we must provide descriptions and expectations about sections of the study data in dataquieR’s metadata format. For instance, for the SHIP example data, the metadata may be loaded as follows:
prep_load_workbook_like_file("ship_meta_v2") # load the metadata workbook ship_meta_v2.xlsx
meta_data_item <- prep_get_data_frame("item_level") # load the item_level sheet from ship_meta_v2.xlsx
meta_data_segment <- prep_get_data_frame("segment_level") # load the segment_level sheet from ship_meta_v2.xlsx| STUDY_SEGMENT | SEGMENT_RECORD_COUNT | SEGMENT_ID_REF_TABLE | SEGMENT_RECORD_CHECK | SEGMENT_ID_VARS | SEGMENT_UNIQUE_ROWS | SEGMENT_PART_VARS |
|---|---|---|---|---|---|---|
| INTRO | 2154 | expected_id_segment | exact | id | TRUE | seg_part_intro |
| SOMATOMETRY | 500 | expected_id_segment | exact | id | TRUE | seg_part_somatometry |
| INTERVIEW | 2150 | expected_id_segment | exact | id | TRUE | seg_part_interview |
| LABORATORY | 500 | expected_id_segment | subset | id | TRUE | seg_part_laboratory |
A detailed description of how to set up this metadata file is available here. See here for an overview of dataquieR’s metadata usage.
Data quality indicators at the segment level
Some quality indicators at the segment level are related to the Integrity of the data. These are: Unexpected data element set, Unexpected data record count, and Duplicates. These data quality
indicators are implemented in the
int_all_datastructure_dataframe function.
Additionally, one may compute some Completeness indicators: Missing values, Non-response rate and Refusal rate using the
com_segment_missingness function.
See int_all_datastructure_segment’s
documentation, as well as com_segment_missingness
for a detailed explanation of the input and output of the functions.
Example usage and output
Integrity
To evaluate Integrity at the segment level, we apply the function
int_all_datastructure_segment in the following way:
segment_structure <- int_all_datastructure_segment(
  study_data = sd1,
  meta_data = meta_data_item,
  meta_data_segment = meta_data_segment
)
The function returns a nested list with the elements
SegmentTable, SegmentData and
SegmentDataList. SegmentTable is used for
reporting purposes, so the results are abbreviated. Hence, here we focus
on the readable output from SegmentData and
SegmentDataList. SegmentData shows a summary
of all the indicators computed per segment:
segment_structure$SegmentData| Segment | Unexpected data record count N (%) | Unexpected data record count (Grading) | Unexpected data record set N (%) | Unexpected data record set (Grading) | Duplicates N (%) | Duplicates (Grading) | Unexp. Variables | Unexpected data element set N (%) | Unexpected data element set (Grading) |
|---|---|---|---|---|---|---|---|---|---|
| INTERVIEW | 4 (0.19%) | 1 | 3 (0.07%) | 1 | 0 (0%) | 0 | NA | 0 (0%) | 0 |
| INTRO | 0 (0%) | 0 | 0 (0%) | 0 | 0 (0%) | 0 | NA | 0 (0%) | 0 |
| LABORATORY | 1640 (328%) | 1 | 1642 (62.22%) | 1 | 0 (0%) | 0 | NA | 0 (0%) | 0 |
| SOMATOMETRY | 1653 (330.6%) | 1 | 1654 (62.37%) | 1 | 0 (0%) | 0 | NA | 0 (0%) | 0 |
Note that a Grading is given per indicator and segment
to show whether there are data quality issues (Grading = 1)
or not (Grading = 0).
SegmentDataList contains a more detailed output with six
data frames (one or more per indicator), each with a
Segment column, indicating the name of each part of the
study. The data frames are the following:
Unexpected data record count
segment_structure$SegmentDataList$`Unexpected data record count`| Segment | Check | Unexpected records | Number of records in data | Number of records in metadata | Number of mismatches | Percentage of mismatches | GRADING |
|---|---|---|---|---|---|---|---|
| INTRO | Records | FALSE | 2154 | 2154 | 0 | 0.000 | 0 |
| SOMATOMETRY | Records | TRUE | 2153 | 500 | 1653 | 330.600 | 1 |
| INTERVIEW | Records | TRUE | 2154 | 2150 | 4 | 0.186 | 1 |
| LABORATORY | Records | TRUE | 2140 | 500 | 1640 | 328.000 | 1 |
The table reports the level of the check (in this case only records
are relevant), whether unexpected records were found, the number of
records present in the study data, the number of records expected
according to the metadata, and, if unexpected records are detected, the
number and percentage of mismatches. According to this result, a binary
GRADING is also provided. Here, only the INTRO segment
agrees with the expectations provided in the metadata, so
GRADING = 0.
ID duplicates
segment_structure$SegmentDataList$Duplicates| Check | Segment | Any duplicates | Number of duplicates | Percentage of duplicates | GRADING | ID Vars |
|---|---|---|---|---|---|---|
| IDs | INTRO | FALSE | 0 | 0 | 0 | id |
| IDs | SOMATOMETRY | FALSE | 0 | 0 | 0 | id |
| IDs | INTERVIEW | FALSE | 0 | 0 | 0 | id |
| IDs | LABORATORY | FALSE | 0 | 0 | 0 | id |
These results are based on IDs. The columns indicate whether any
duplicates were found, and if so, the number and percentage of
duplicates is reported. Any duplicated entries are also returned in a
vector. According to the result of the assessment, GRADING
= 0 as there are no duplicate IDs in any segment.
Row duplicates
segment_structure$SegmentDataList$int_sts_dupl_content| Check | Segment | Any duplicates | Number of duplicates | Percentage of duplicates | GRADING |
|---|---|---|---|---|---|
| Duplicate records | INTRO | FALSE | 0 | 0.000 | 0 |
| Duplicate records | SOMATOMETRY | FALSE | 0 | 0.000 | 0 |
| Duplicate records | INTERVIEW | TRUE | 978 | 45.404 | 1 |
| Duplicate records | LABORATORY | FALSE | 0 | 0.000 | 0 |
These results are based on row content (i.e. the uniqueness of rows
in the study data). The columns indicate whether any duplicates were
found, and if so, the number and percentage of duplicates is reported.
Any duplicated entries are also returned in a vector.
GRADING = 0 in this case because there are no
duplicates.
Unexpected data element set
segment_structure$SegmentDataList$`Unexpected data element set`| Segment | MISSING | Unexpected data element set (Percentage (0 to 100)) | Unexpected data element set (Number) | resp_vars | GRADING |
|---|---|---|---|---|---|
| INTRO | NA | 0 | 0 | NA | 0 |
| SOMATOMETRY | NA | 0 | 0 | NA | 0 |
| INTERVIEW | NA | 0 | 0 | NA | 0 |
| LABORATORY | NA | 0 | 0 | NA | 0 |
If there is an unexpected element set, the column
MISSING indicates whether it is missing from the study data
or the metadata. The next columns show the percentage and number of
unexpected element sets, respectively, while resp_vars
contains the names of the affected elements. According to the presence
of unexpected element sets, a binary GRADING is also
provided to flag the discrepancies.
Completeness
To evaluate Completeness at the segment level, we apply the functions
com_segment_missingness and
com_qualified_segment_missingness.
Missing values
Missingness per segment can be calculated using:
seg_miss <- com_segment_missingness(
  study_data = sd1,
  meta_data = meta_data_item,
  meta_data_segment = meta_data_segment,
  label_col = "LONG_LABEL"
)
This check identifies subjects without any measurements within each
of the four study segments. The output is a list containing
ResultData and ReportSummaryTable.
ReportSummaryTable is an abbreviated table produced for
reporting purposes. ResultData shows an expanded output
with the number and percentage of missing values per segment:
seg_miss$ResultData| Group | Examinations | No. Participants | No. missing segments | (%) of missing segments | threshold | direction |
|---|---|---|---|---|---|---|
| 1 | INTRO | 2154 | 0 | 0.00 | 10 | above |
| 1 | SOMATOMETRY | 2154 | 1 | 0.05 | 10 | above |
| 1 | INTERVIEW | 2154 | 0 | 0.00 | 10 | above |
| 1 | LABORATORY | 2154 | 14 | 0.65 | 10 | above |
The result is also displayed as a plot:
seg_miss$ReportSummaryTable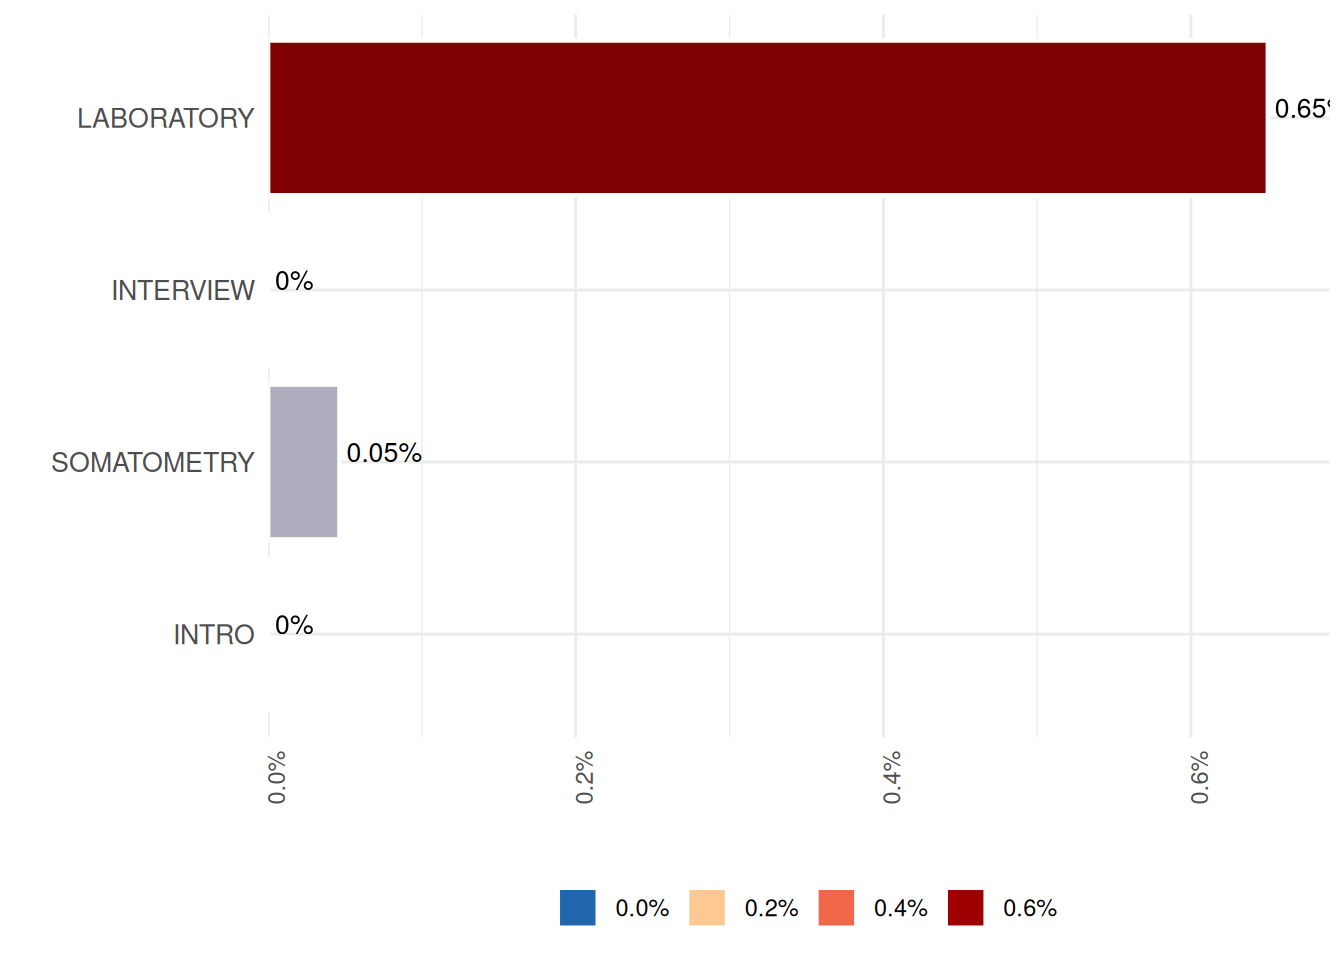
Exploring segment missingness over time requires additional information in the study data. For instance, that specifies the years of the examination:
# create a discretized version of the examination year
sd1$exyear <- as.integer(lubridate::year(sd1$exdate))
Information regarding this new exyear variable can be
added to the metadata using the function
prep_add_to_meta:
# add metadata for this variable
meta_data_item <- prep_add_to_meta(
  VAR_NAMES = "exyear",
  DATA_TYPE = "integer",
  SCALE_LEVEL = "ordinal",
  LABEL = "EX_YEAR_0",
  VALUE_LABELS = "1997 = 1st | 1998 = 2nd | 1999 = 3rd | 2000 = 4th | 2001 = 5th",
  VARIABLE_ROLE = "process",
  STUDY_SEGMENT = "INTRO",
  meta_data = meta_data_item
)
Using this discretized variable for examination year, the occurrence
pattern by year can subsequently be assessed using
com_segment_missingness:
MissSegs <- com_segment_missingness(
  study_data = sd1,
  meta_data = meta_data_item,
  threshold_value = 1,
  label_col = LABEL,
  group_vars = "EX_YEAR_0",
  direction = "high",
  exclude_roles = "process"
)

MissSegs$SummaryPlot
## Error in base::tryCatch(base::withCallingHandlers({ :
## Internal error: inherits(r$ReportSummaryTable, "ReportSummaryTable") is
## not TRUE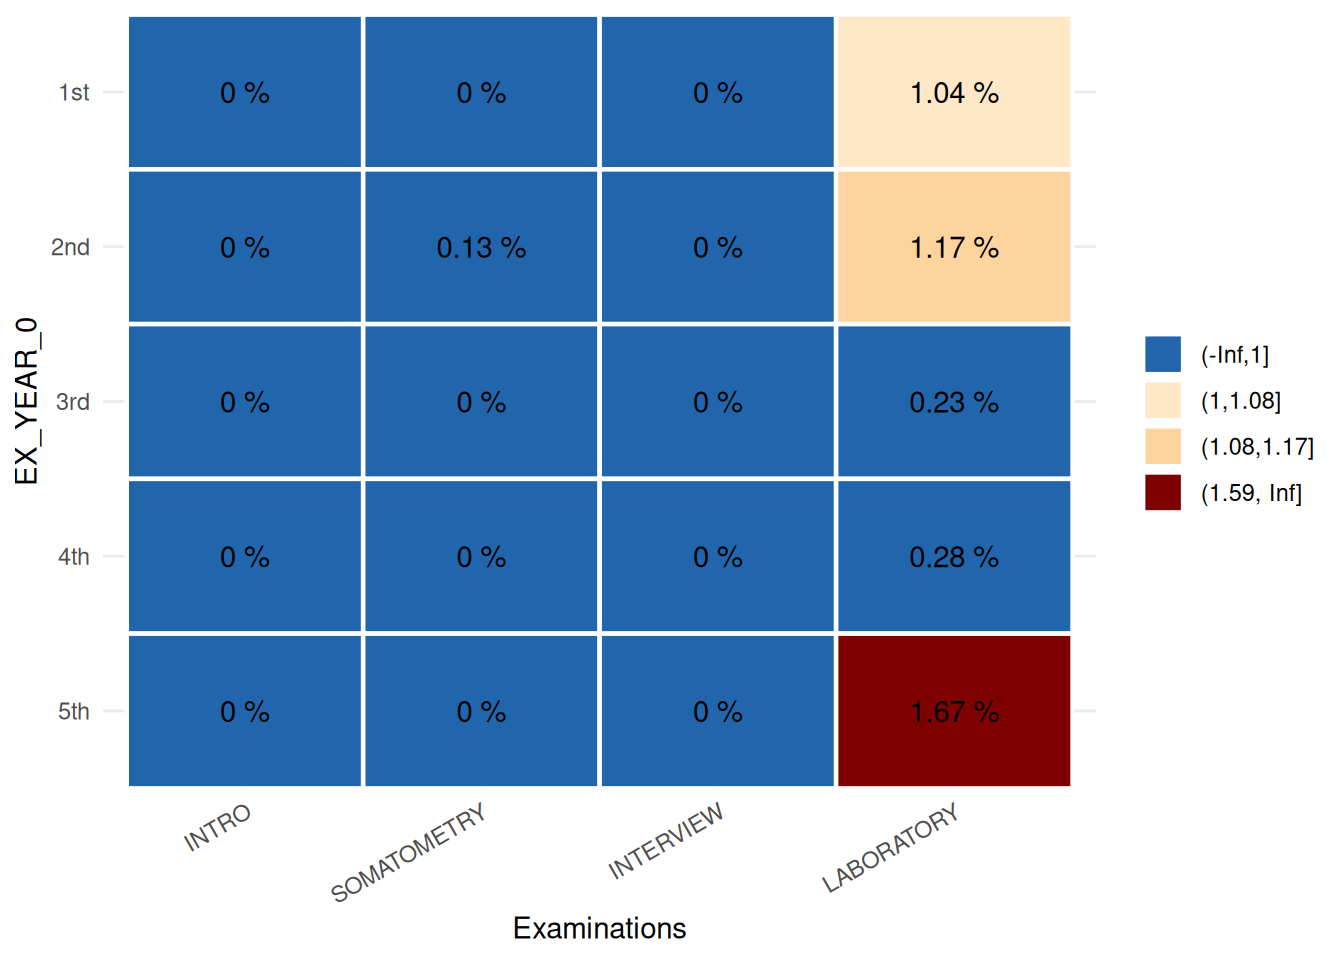
The plot is a descriptor of the indicator Missing values. It illustrates that missing information from the laboratory examination is distributed unequally across examination years, with the highest proportion of missing data occurring in the 1st, 2nd, and 5th years.
Non-response and refusal rates
A more refined measure of missingness can be obtained when missing codes and intepretations for
these are provided in the metadata. In this example, the column
MISSING_LIST_TABLE in the item level metadata contains the
name of another table where missing codes are given per variable or
segment:
| VAR_NAMES | MISSING_LIST_TABLE |
|---|---|
| id | NA |
| exdate | NA |
| sex | NA |
| age | NA |
| obs_bp | missing_table |
| dev_bp | missing_table |
| sbp1 | NA |
| sbp2 | NA |
| dbp1 | NA |
| dbp2 | NA |
| obs_soma | missing_table |
| height | missing_table |
| dev_length | missing_table |
| weight | missing_table |
| dev_weight | missing_table |
| waist | missing_table |
| obs_int | missing_table |
| school | missing_table |
| family | missing_table |
| smoking | missing_table |
| stroke | missing_table |
| myocard | missing_table |
| diab_known | missing_table |
| diab_age | missing_table |
| contraception | missing_table |
| income | missing_table |
| hdl | missing_table |
| ldl | missing_table |
| cholesterol | missing_table |
| seg_part_intro | segment_missing_table |
| seg_part_somatometry | segment_missing_table |
| seg_part_interview | segment_missing_table |
| seg_part_laboratory | segment_missing_table |
| exyear | NA |
The missing tables contain the following information:
| CODE_VALUE | CODE_LABEL | CODE_INTERPRET | CODE_CLASS |
|---|---|---|---|
| 99800 | JUMP - other reason | NE | JUMP |
| 99801 | JUMP - not applicable | NE | JUMP |
| 99802 | JUMP - design change | O | JUMP |
| 99900 | Missing - other reason | O | MISSING |
| 99901 | Missing - refusal | R | MISSING |
| 99902 | Missing - not assessable | NC | MISSING |
| 99903 | Missing - technical problem | O | MISSING |
| 99904 | Missing - not available (material) | O | MISSING |
| 99905 | Missing - not usable (material) | O | MISSING |
| 99906 | Missing - reason unknown | UO | MISSING |
| 99907 | Missing - optional value | NE | MISSING |
| 99908 | Deleted - other reason | O | MISSING |
| 99909 | Deleted - contradiction | O | MISSING |
| 99910 | Deleted - value outside limits | O | MISSING |
| 99912 | Value above detection limit | O | MISSING |
| 99913 | Value below detection limit | O | MISSING |
| 99914 | Data management ongoing | O | MISSING |
This allows us to calculate missingnes rates using
com_qualified_segment_missingness:
seg_miss_qual <- com_qualified_segment_missingness(
    study_data = sd1,
    meta_data = meta_data_item,
    meta_data_segment = meta_data_segment,
    label_col = "LONG_LABEL"
)
The output contains the elements SegmentTable and
SegmentData. SegmentTable is the abbreviated
output for reporting, while SegmentData shows the
missingnes rates:
seg_miss_qual$SegmentData| Segment | Non-response rate (Percentage (0 to 100)) | Refusal rate (Percentage (0 to 100)) |
|---|---|---|
| INTRO | 0% | 0% |
| SOMATOMETRY | 0.19% | 0.05% |
| INTERVIEW | 0.51% | 0.32% |
| LABORATORY | 0.79% | 0.05% |
