HDL-cholesterol
hdl CHOLES_HDL_0
Descriptive statistics (Continuous)
Provides descriptive statistics for a subset or all continuous variables in the study data
Data type mismatch
Check if the declared data types in the metadata match the observed data types in the study data.
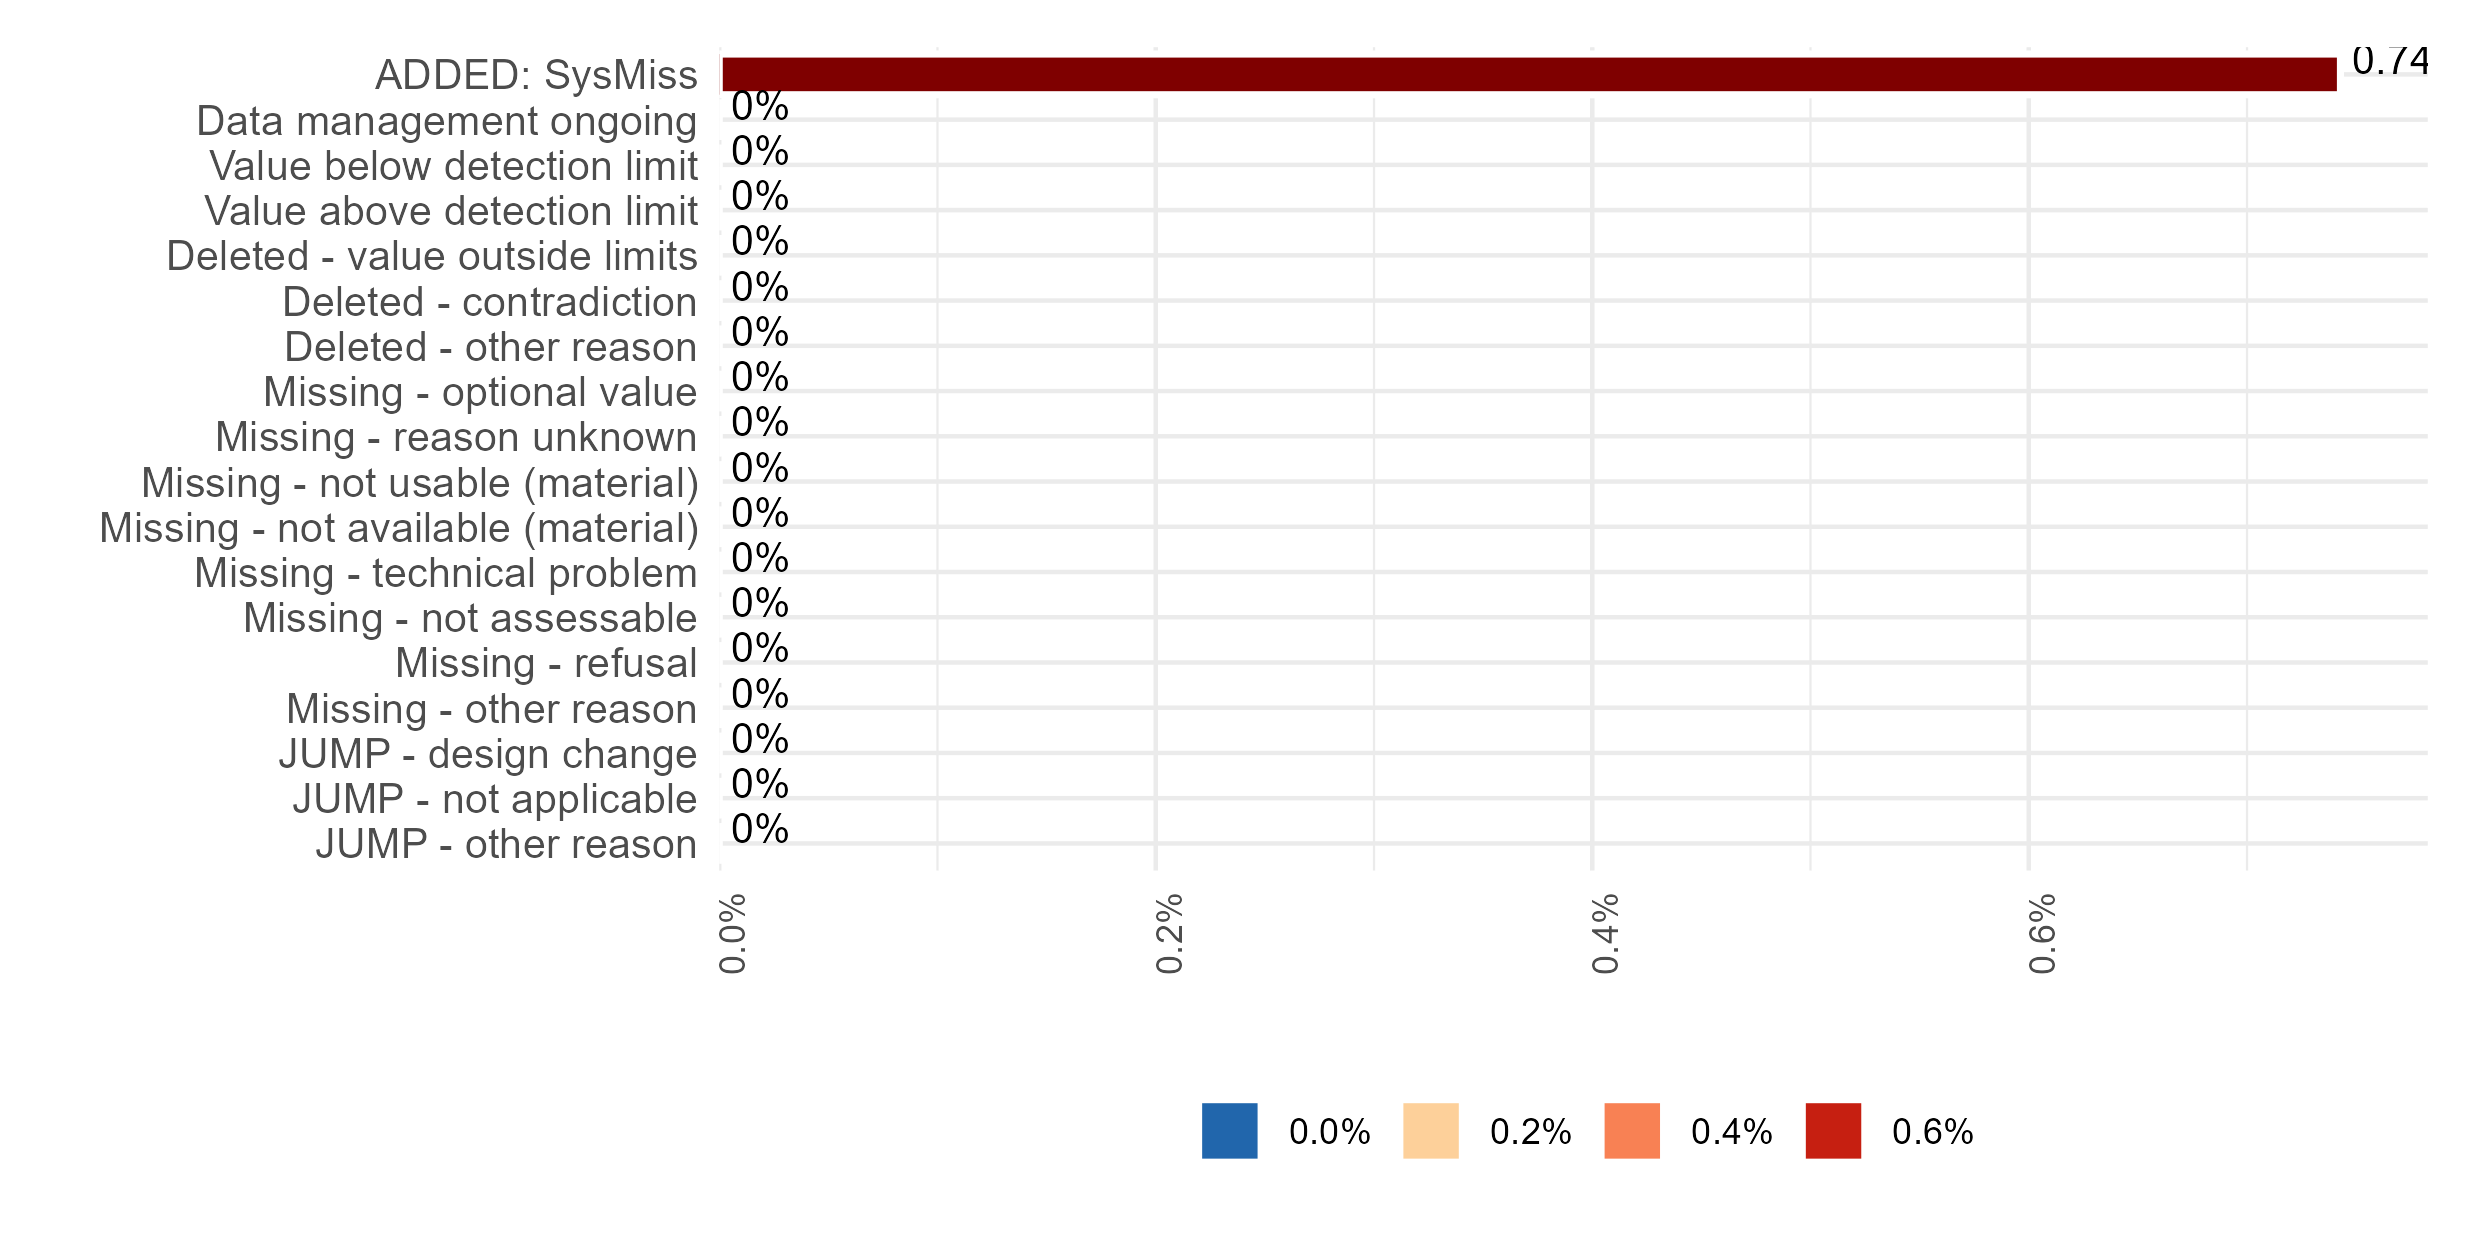
Missing values (Item-level)
Presence and amount of missing data for each variable, separated by class of missingness (i.e., system missingness (NA), used missing codes and jump codes). The higher the number or percentage of missing values, the lower the data quality.
Note:
1. “ADDED: SysMiss” or “Sysmiss N” refers to NA’s (i.e., system-indicated missing values);
2. The percentage of all the columns in the table (except Measurements N (%)) are calculated over the Observation N. The percentage of Measurement N is calculated by dividing the value (Measurement N) by the difference between the number of observations and the number of jumps (Observation N - Jumps N).
Response-rates (Item-level)
The higher the rate, the lower the data quality. For further information, see here
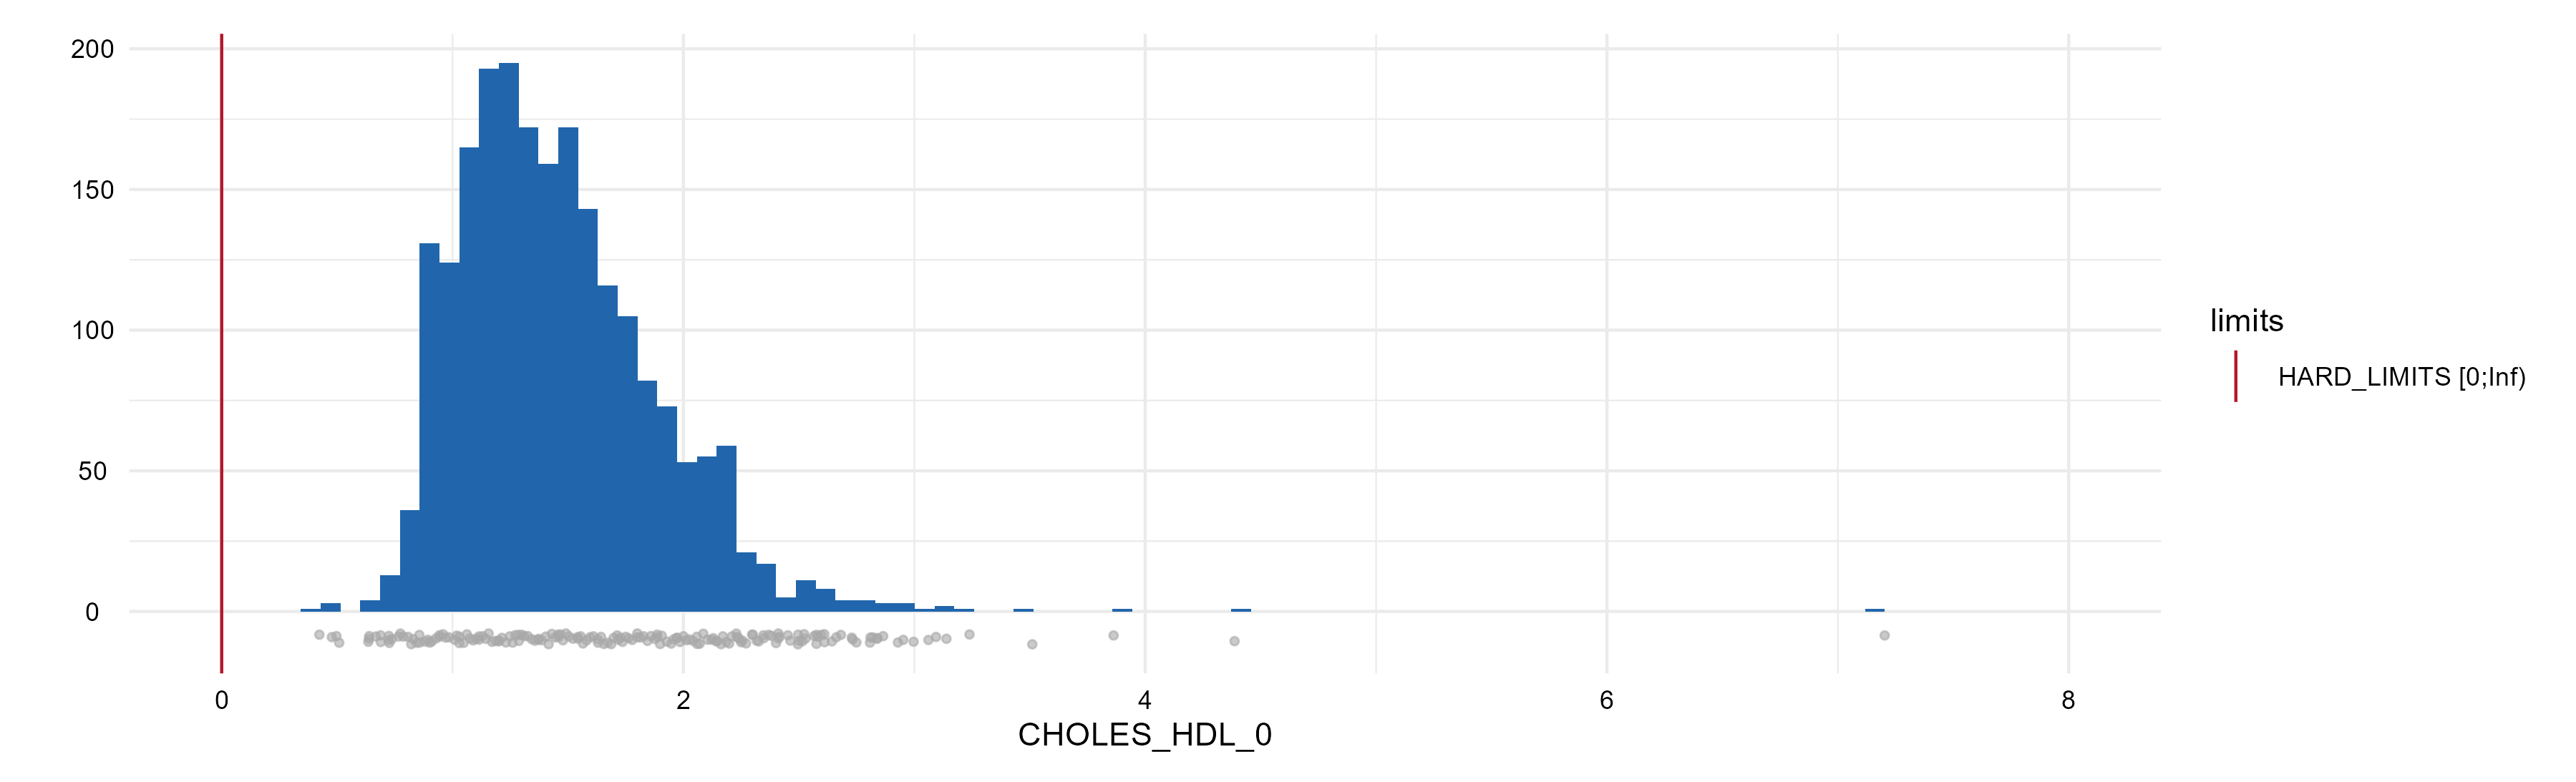
Range violations
Check applied to numerical or time-date variables. If a range of values is provided in the metadata, the presence of values outside the interval is checked. These can be: inadmissible values (hard limits), improbable but plausible values (soft limits), or values outside measurement ranges (detection limits). The higher the number or percentage of values outside the limits, the lower the data quality.
Attention: values outside hard limits are removed from the following quality checks.
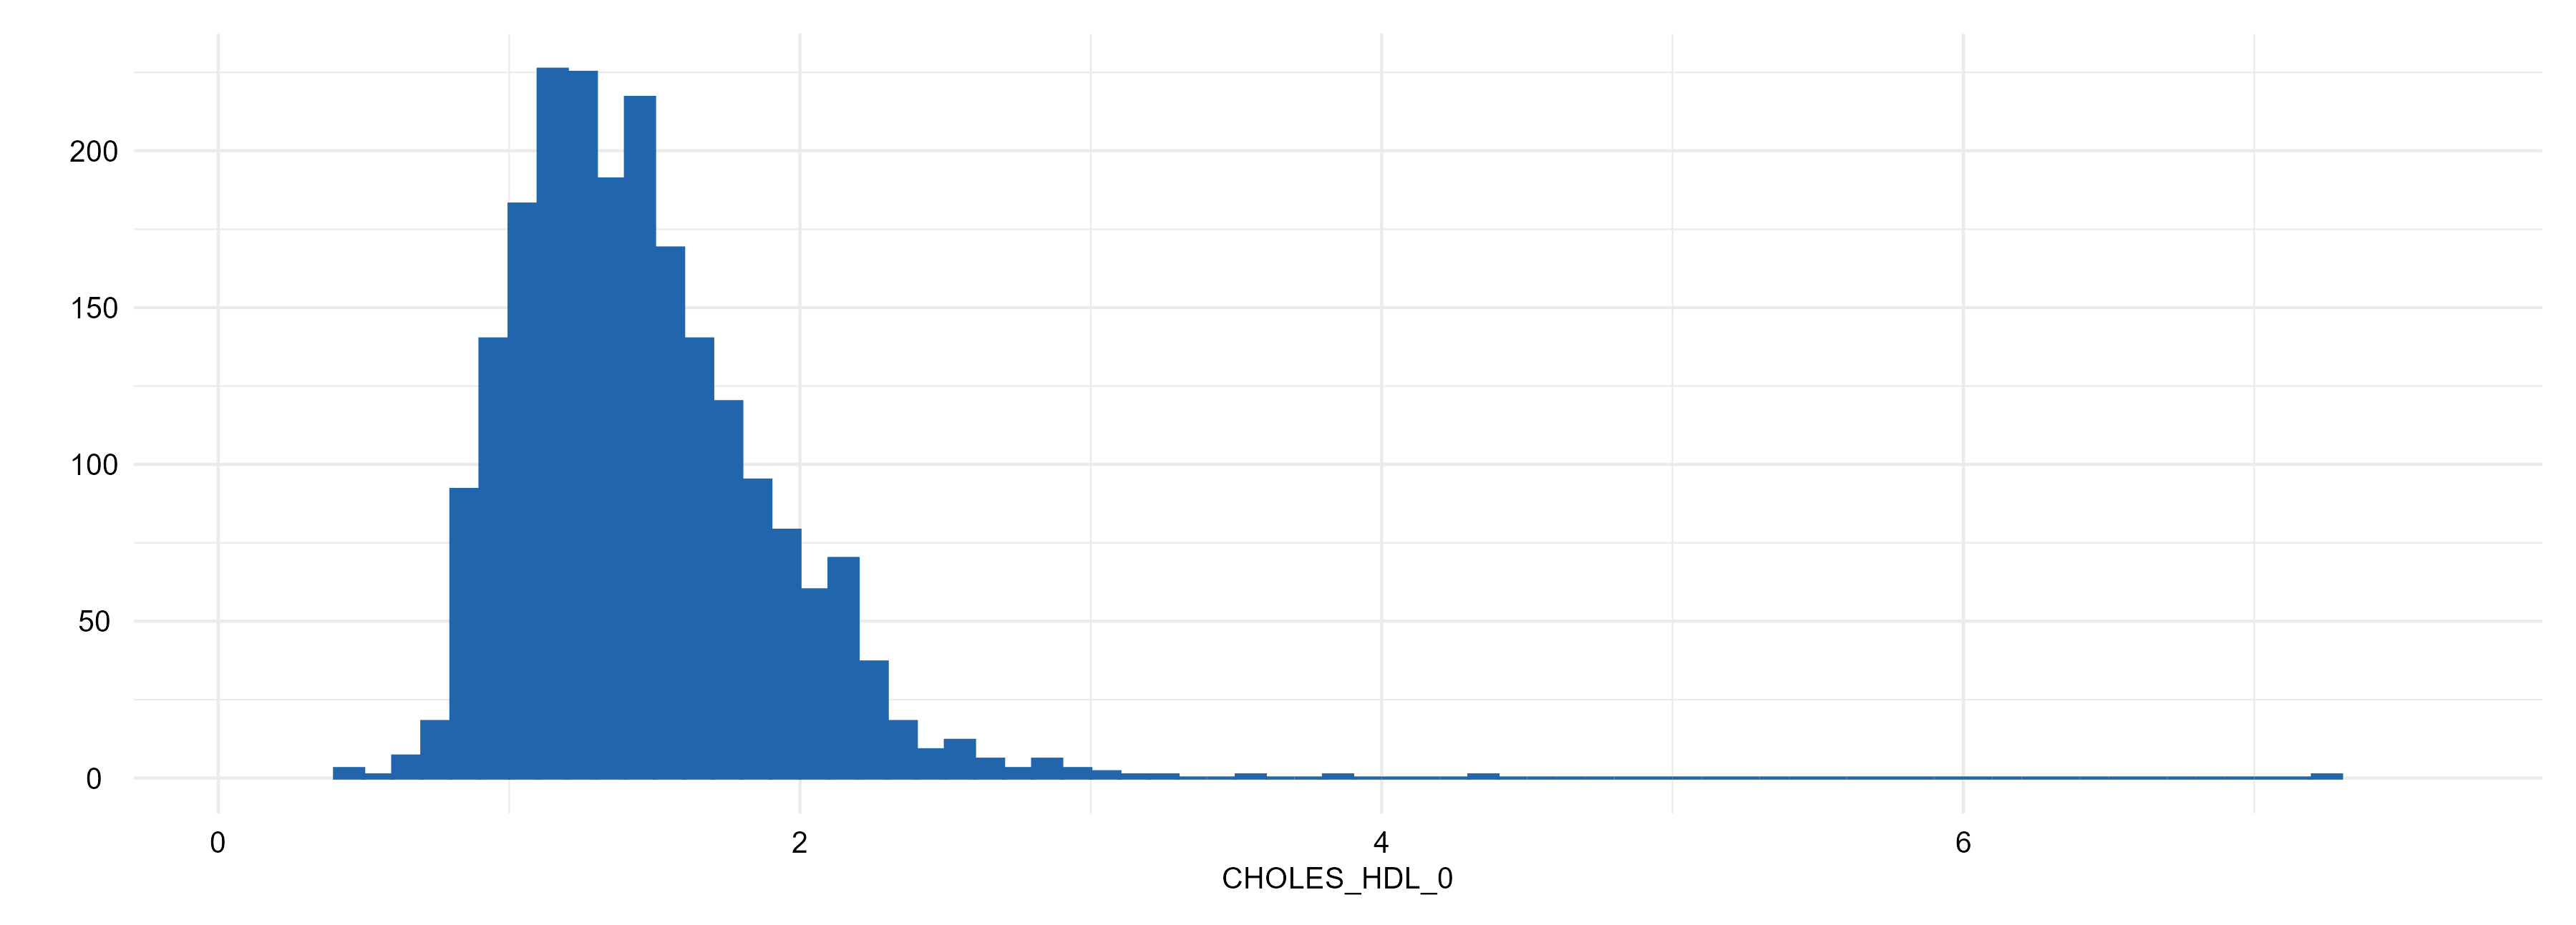
Distribution
Distribution plots for the variables in the study data (distributions are described using bar plots in case of categorical data and histograms for numerical data).
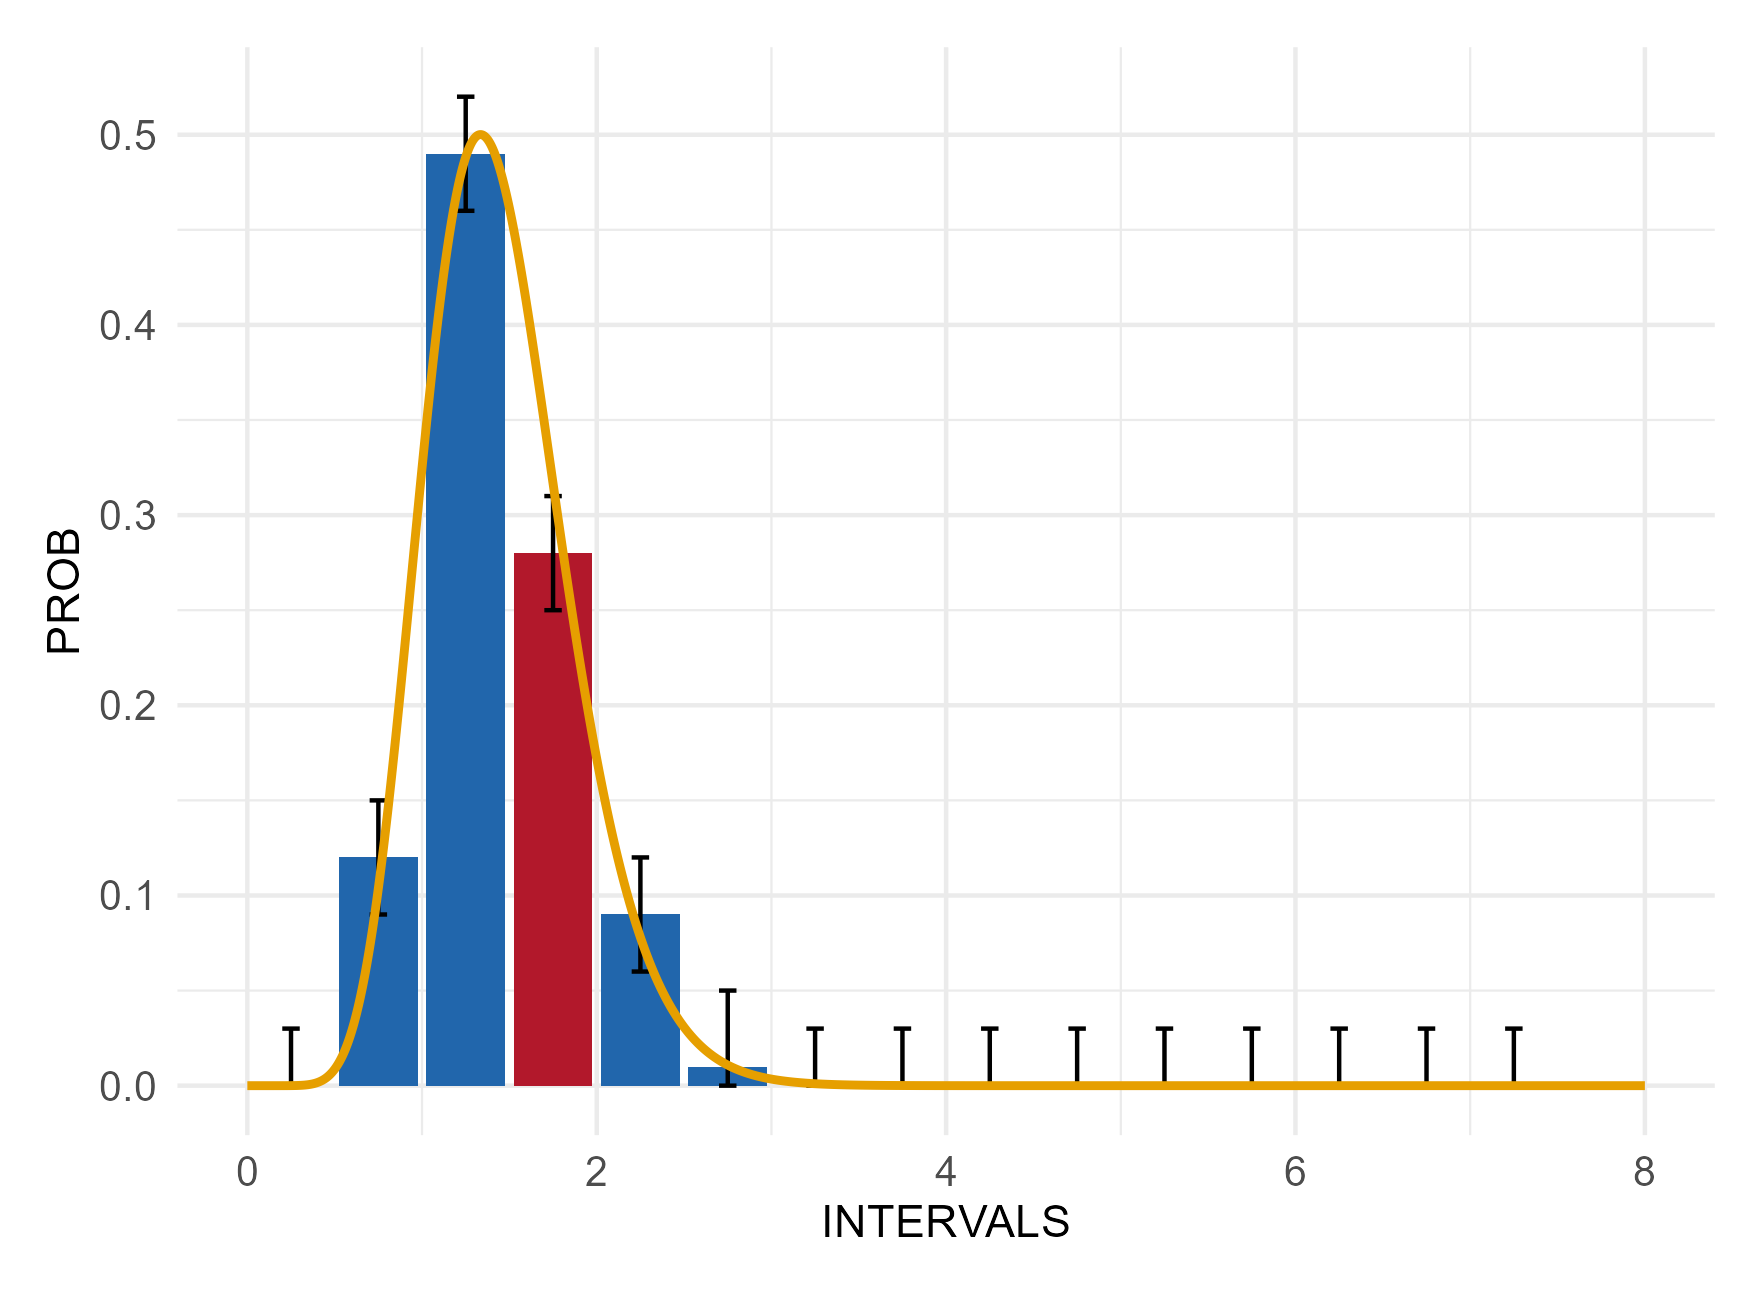
Unexpected distribution shape
Checks if single intervals in the graph created using the study data deviate significantly from a theoretical distribution expected from the metadata (solid yellow line). The distribution of a variable is defined in the column DISTRIBUTION in the metadata (e.g., normal), whereas the parameters are derived from the empirical data.
The higher the number of identified intervals deviating from the expected distribution, the lower potentially the data quality.
Note: sample size considerations and the graph should be taken into account in addition to the test results.
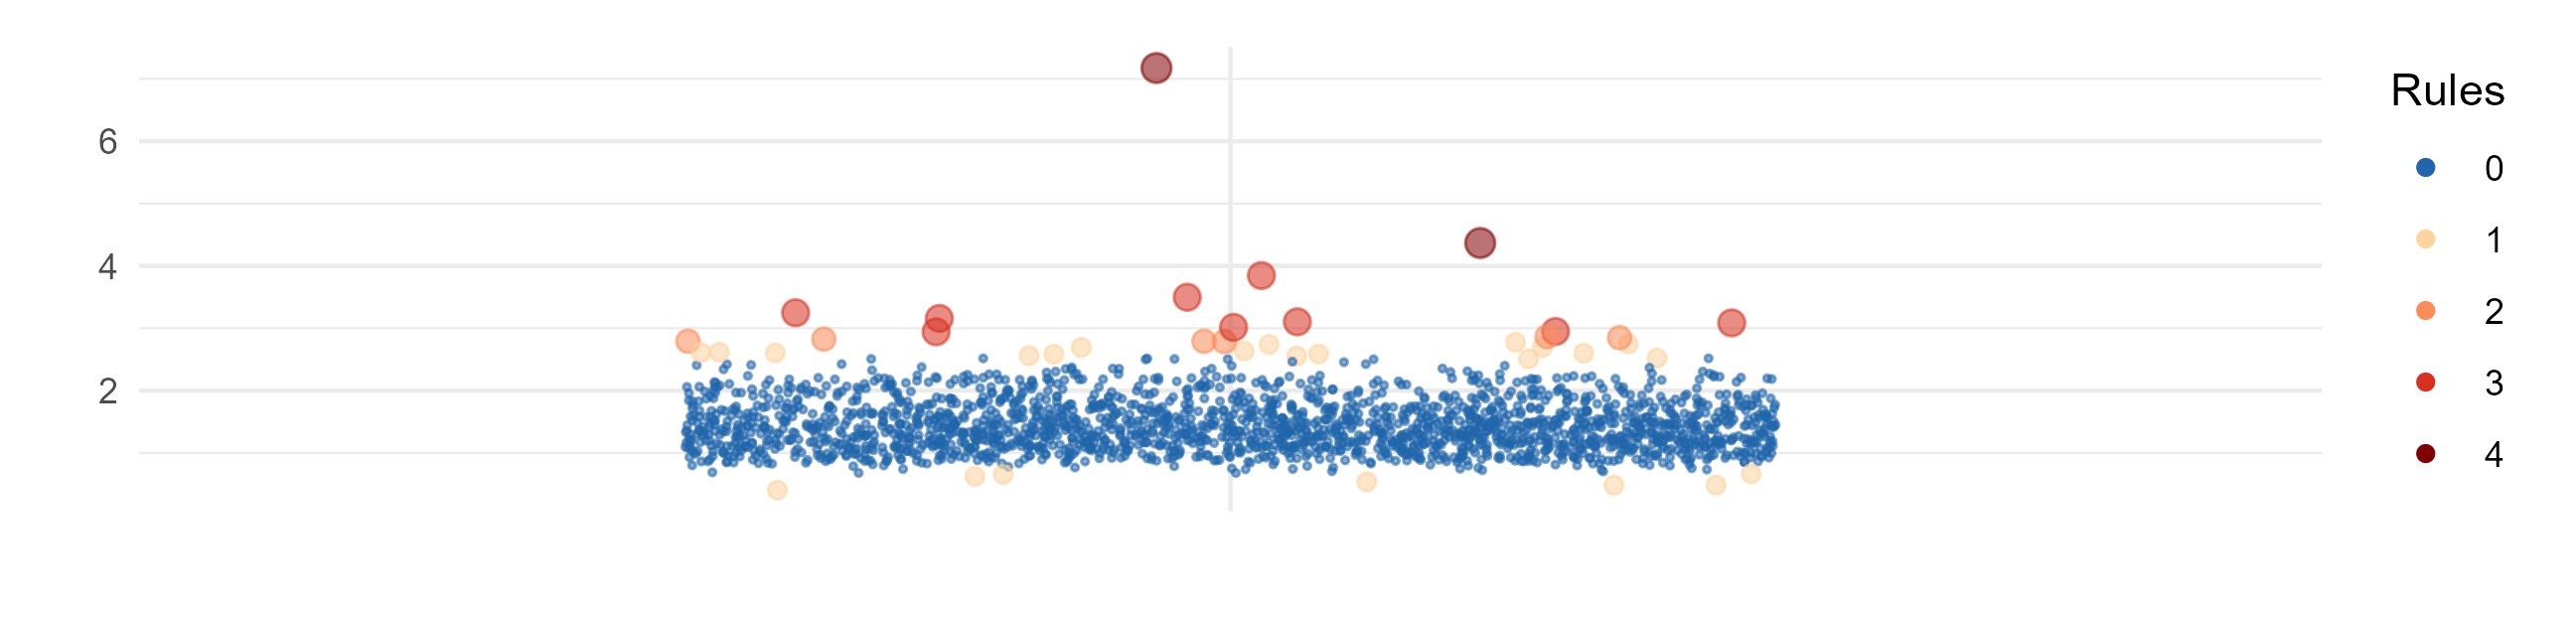
Univariate outliers
Presence of outliers in the study data are checked using 4 approaches (Tukey, 3SD, Hubert, and SigmaGap). For each value it is indicated how many approaches identifies it as outlier (0 = not an outlier, 4 = an outlier based on 4 approaches).
The higher the number or percentage of identified outliers, the lower potentially the data quality.