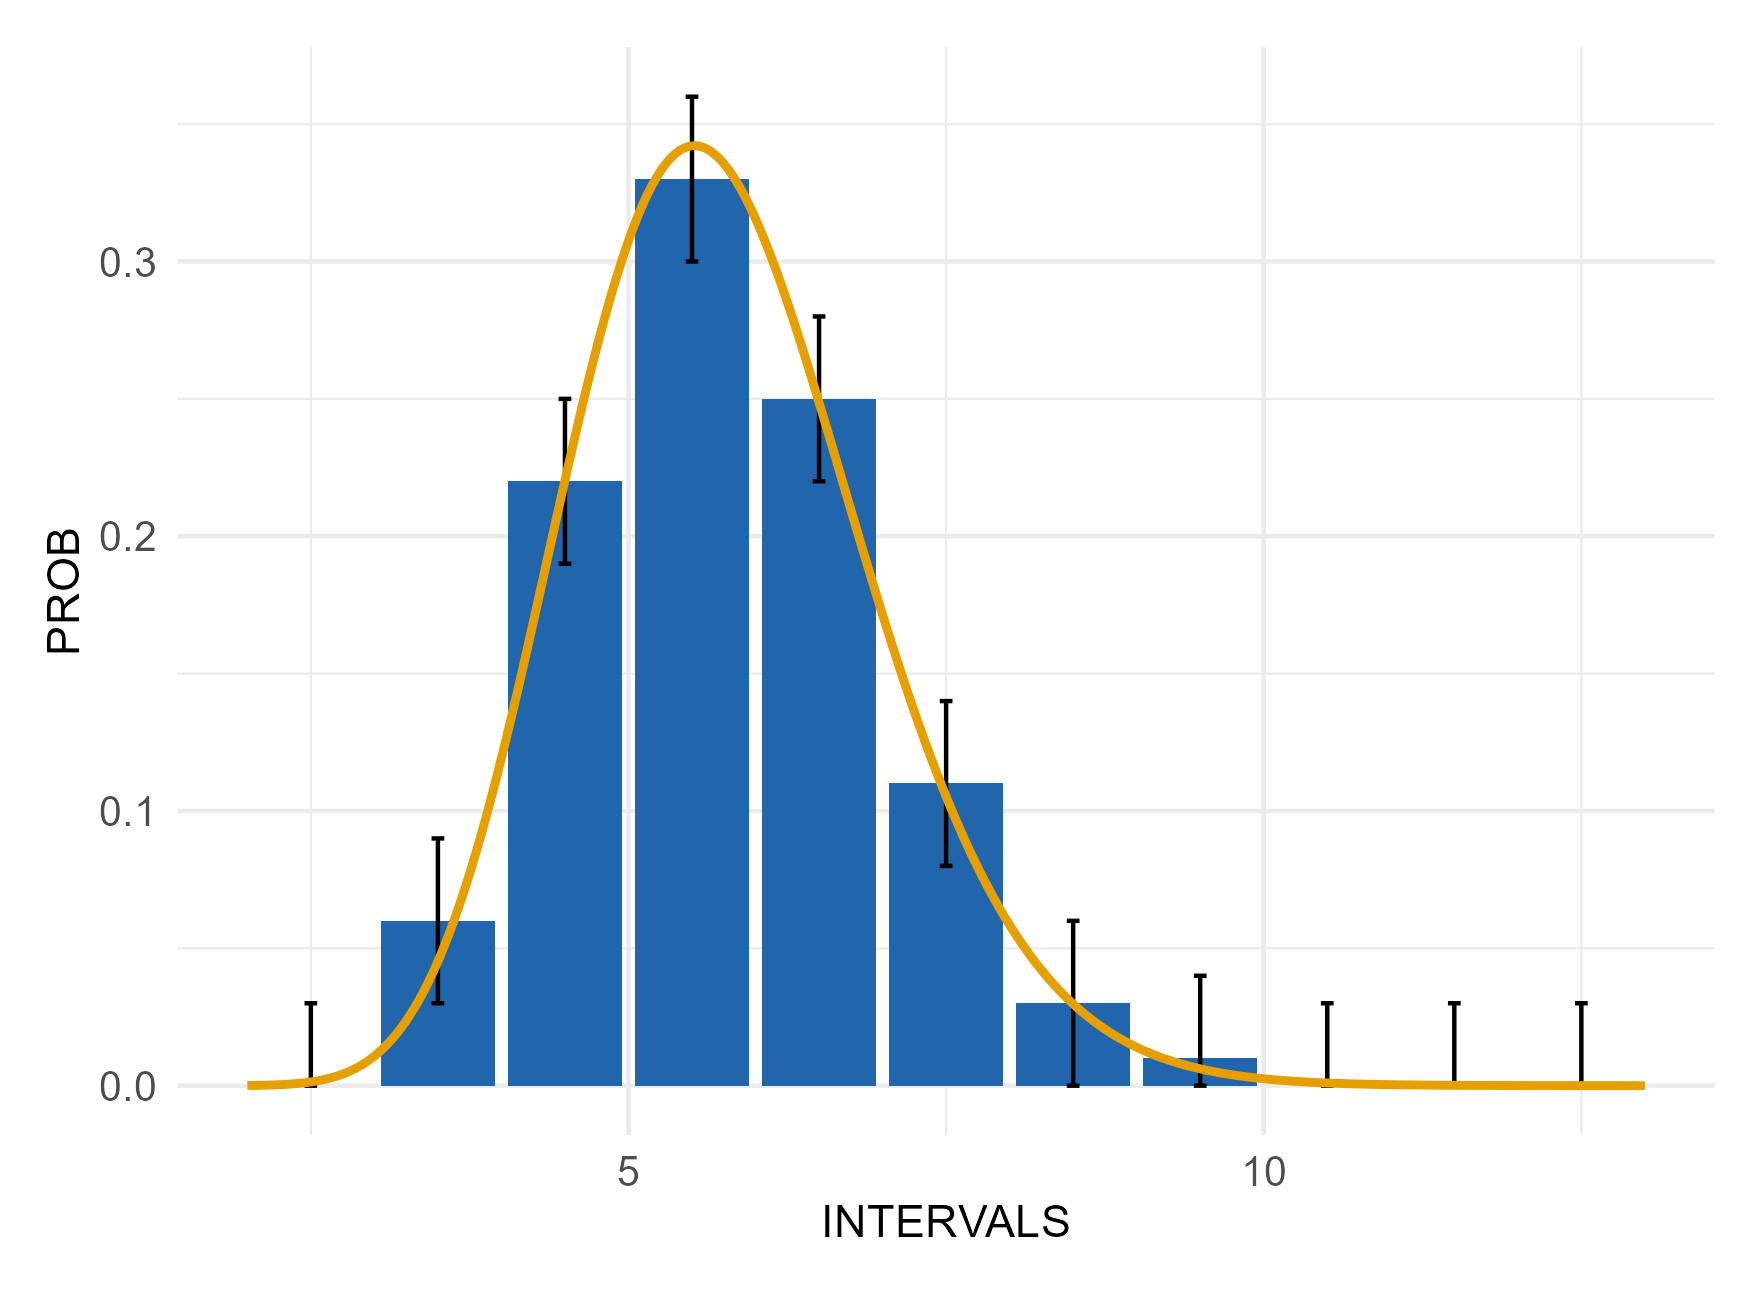
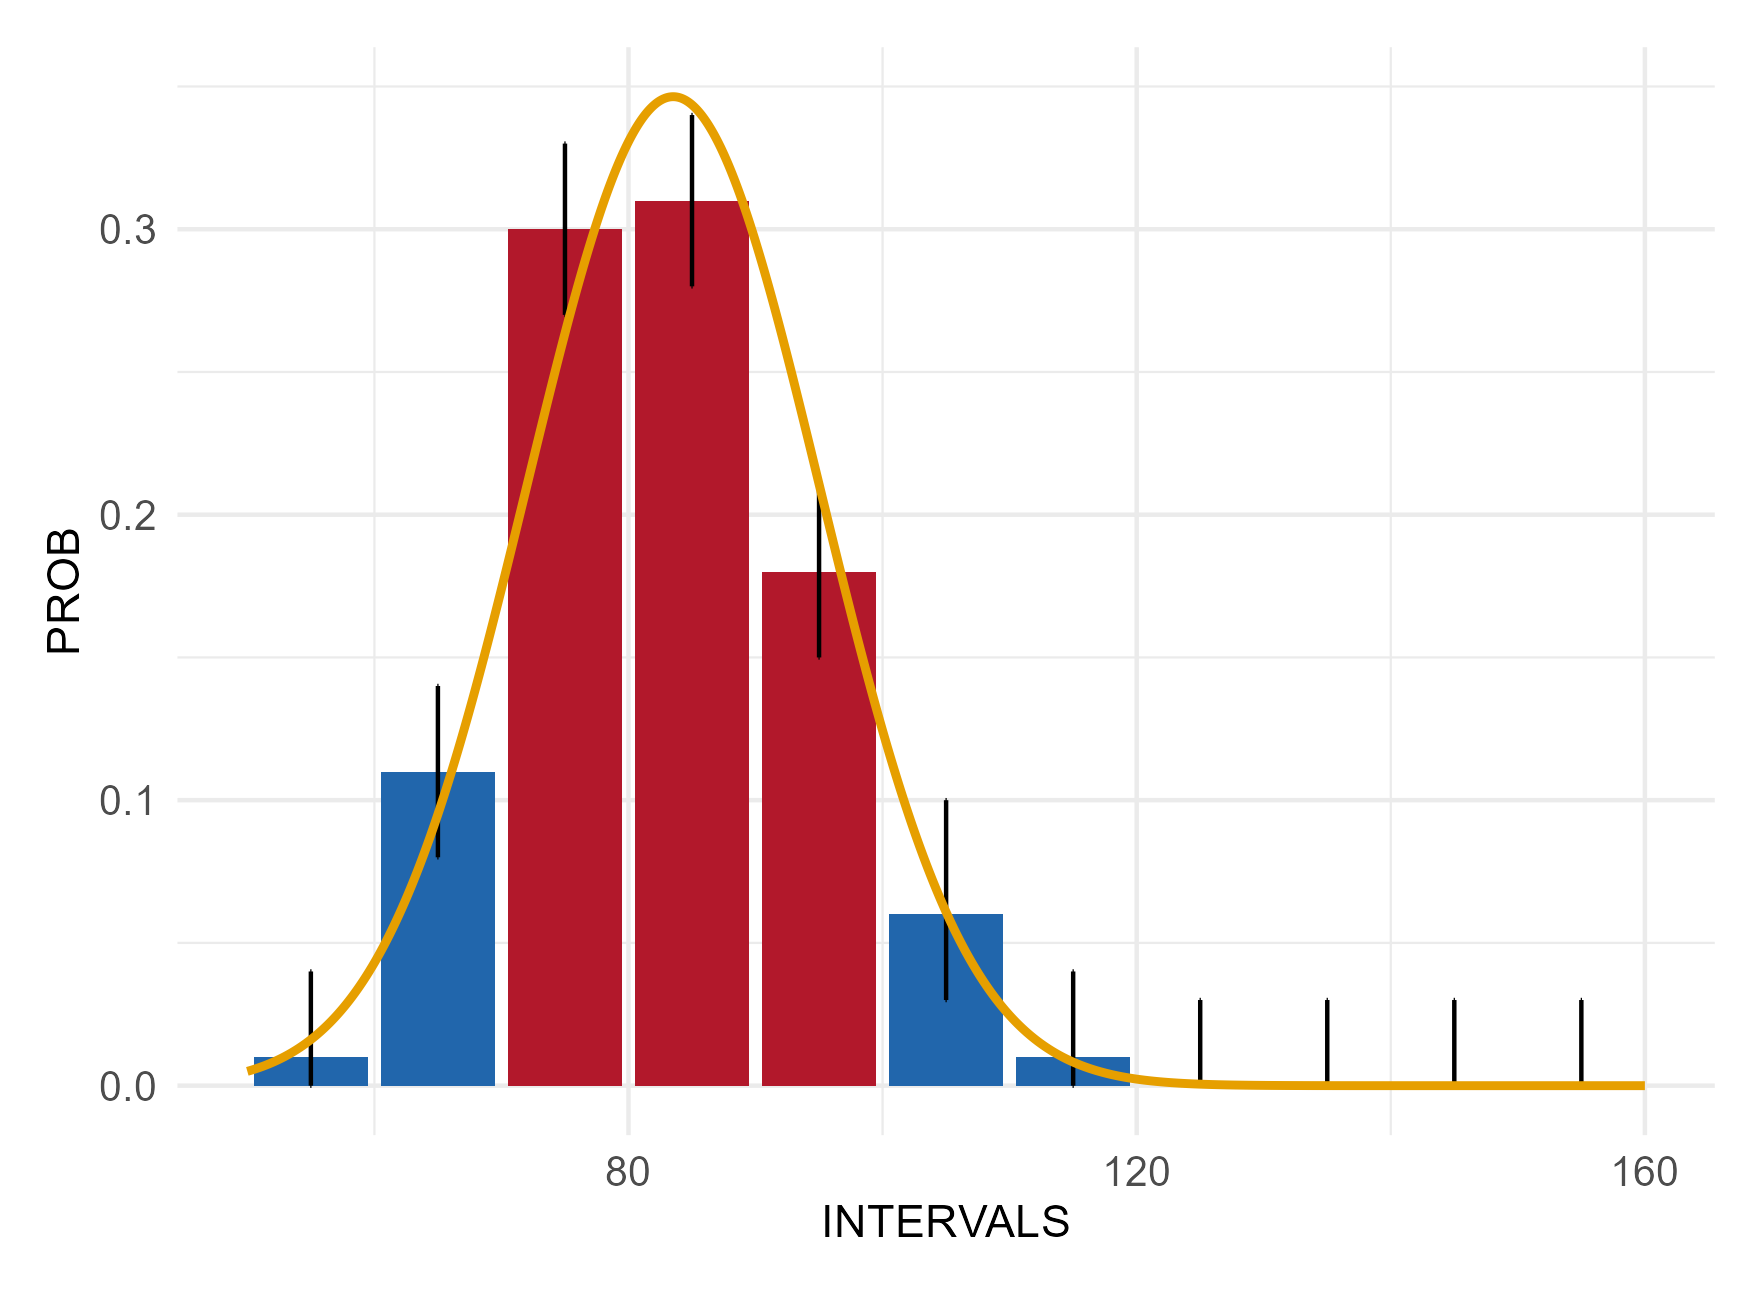
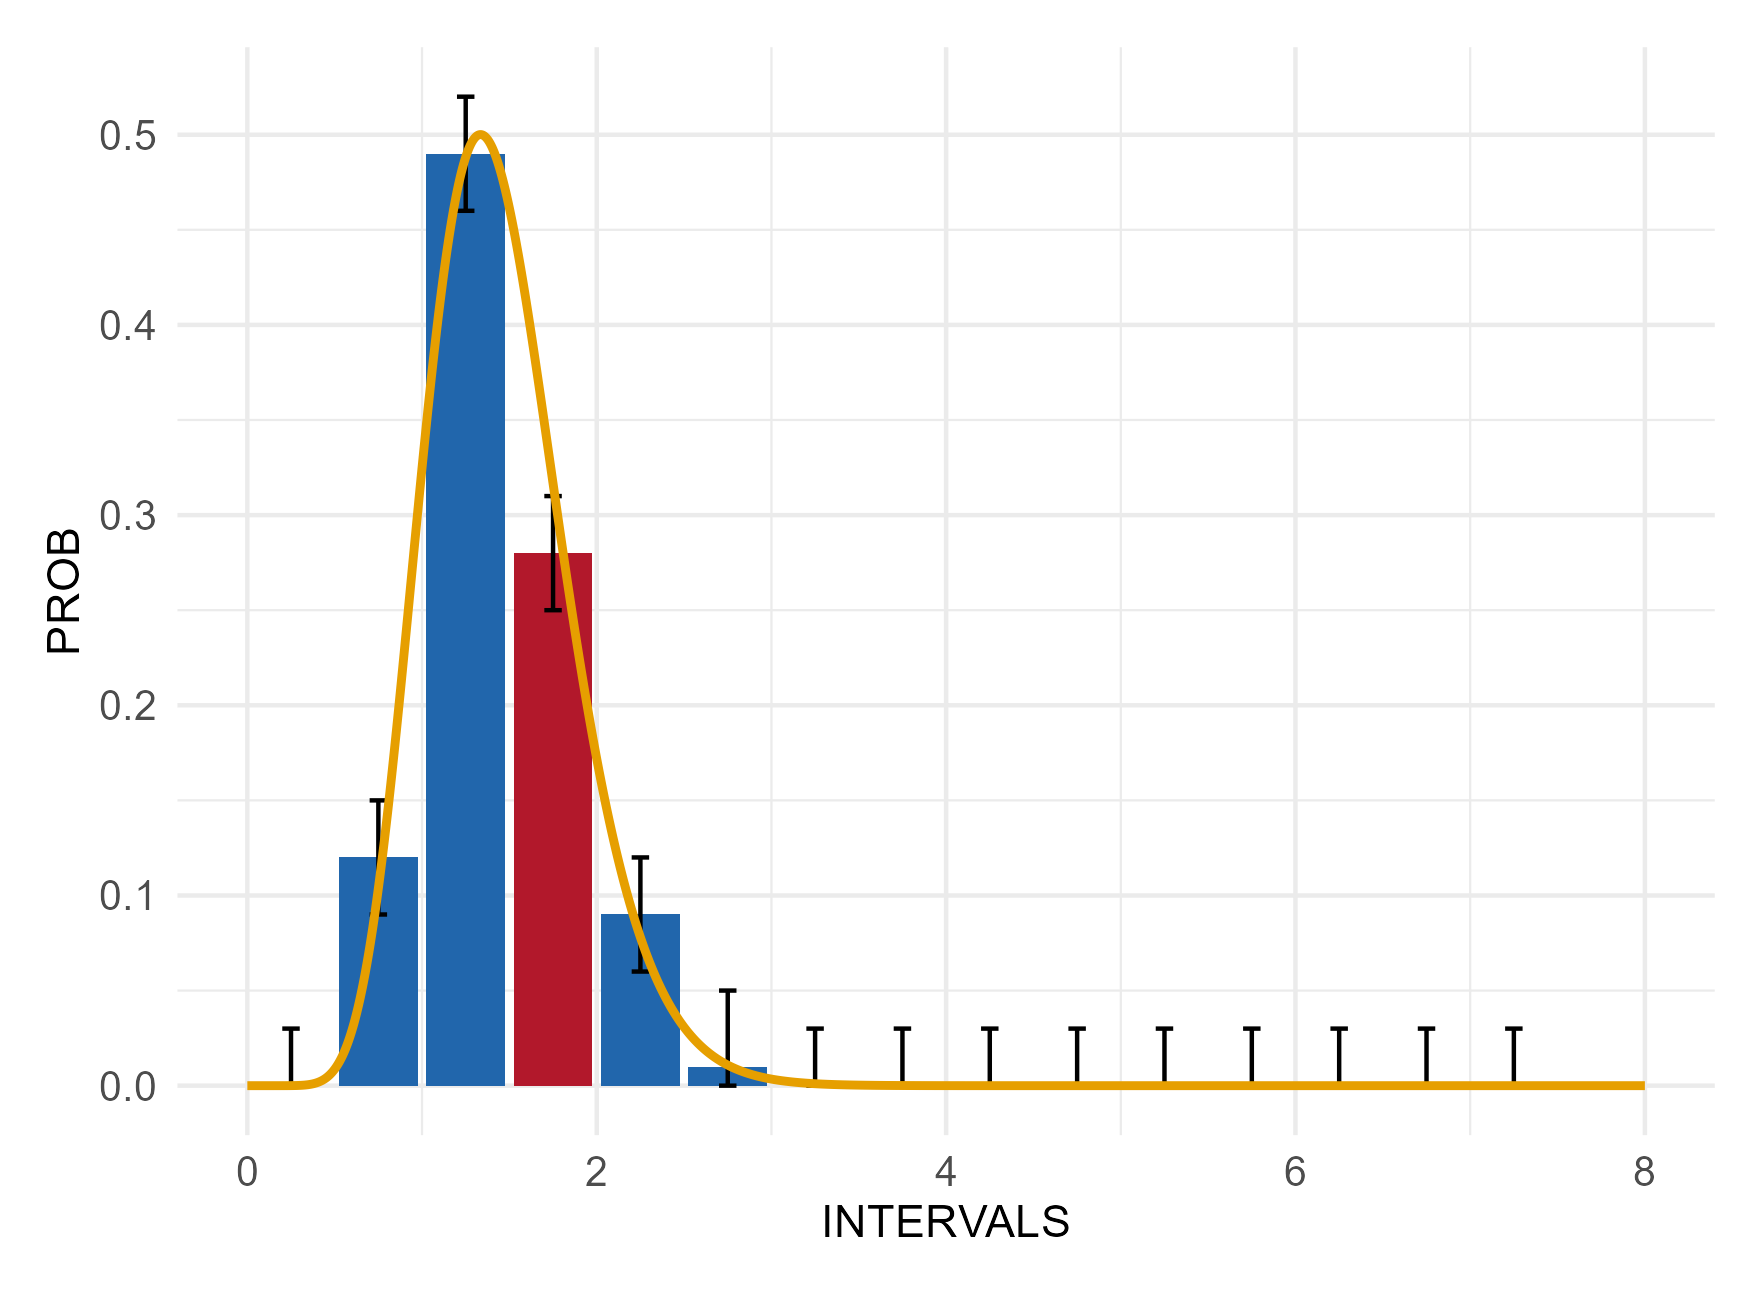
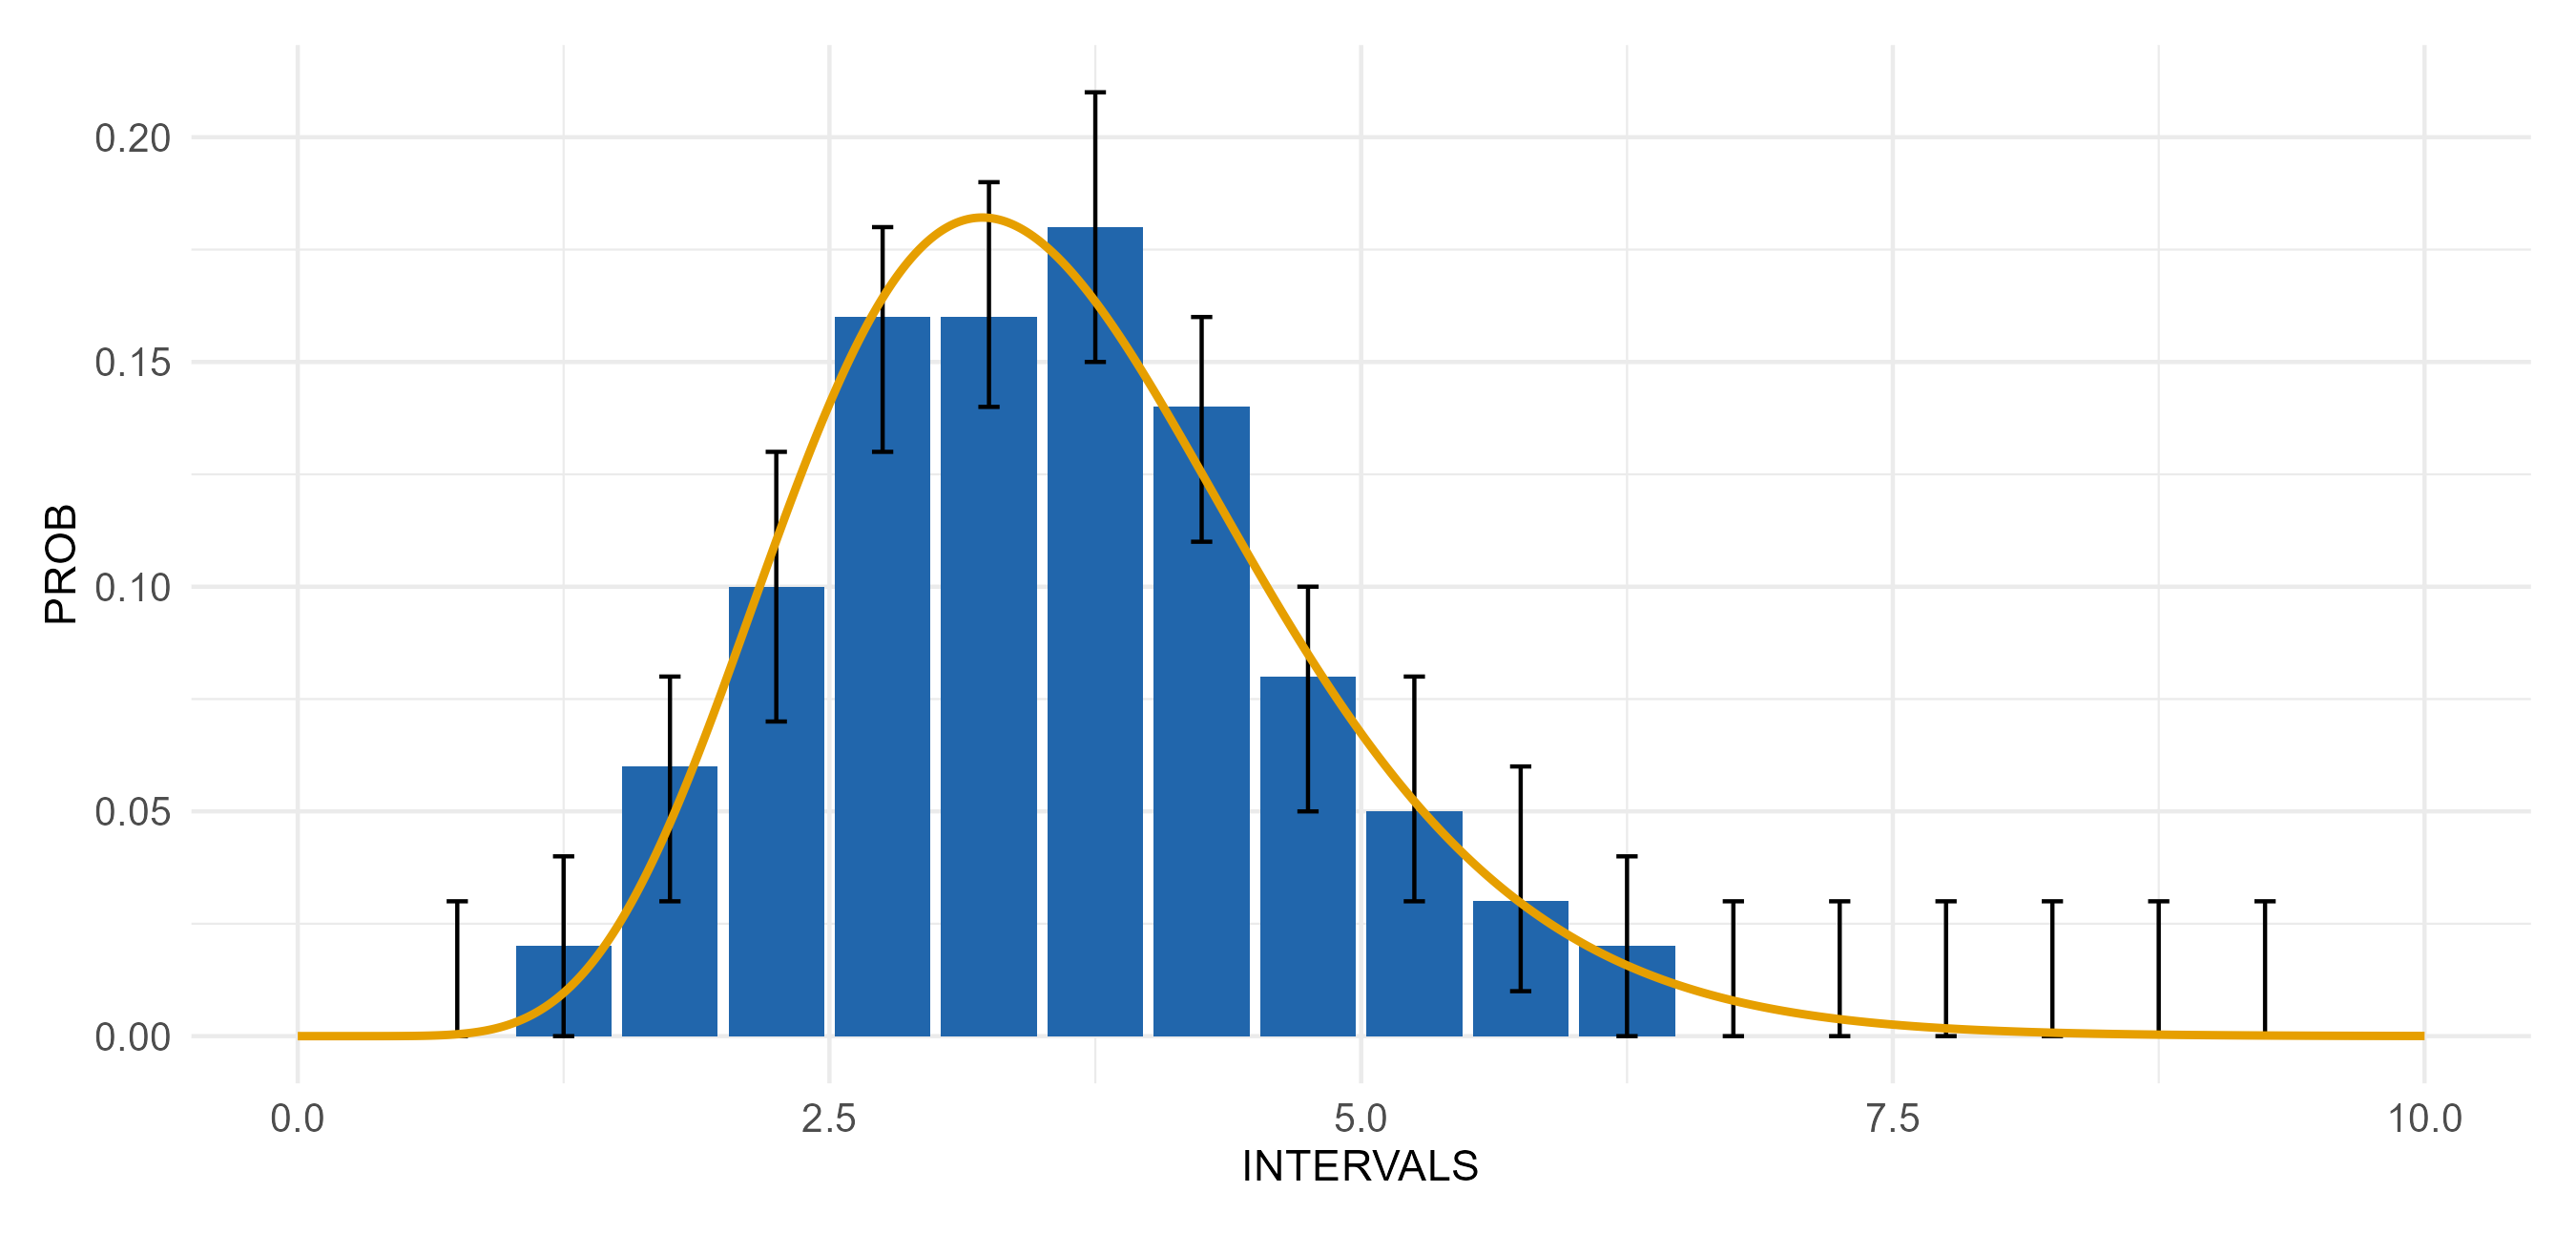
Unexpected distribution shape
Checks if single intervals in the graph created using the study data deviate significantly from a theoretical distribution expected from the metadata (solid yellow line). The distribution of a variable is defined in the column DISTRIBUTION in the metadata (e.g., normal), whereas the parameters are derived from the empirical data.
The higher the number of identified intervals deviating from the expected distribution, the lower potentially the data quality.
Note: sample size considerations and the graph should be taken into account in addition to the test results.
SBP_0.1
sbp1
Systolic blood pressure 1
SBP_0.2
sbp2
Systolic blood pressure 2
DBP_0.1
dbp1
Diastolic blood pressure 1
DBP_0.2
dbp2
Diastolic blood pressure 2
CHOLES_HDL_0
hdl
HDL-cholesterol
CHOLES_LDL_0
ldl
LDL-cholesterol
CHOLES_ALL_0
cholesterol
Total cholesterol