Distribution
Distribution plots for the variables in the study data (distributions are described using bar plots in case of categorical data and histograms for numerical data).
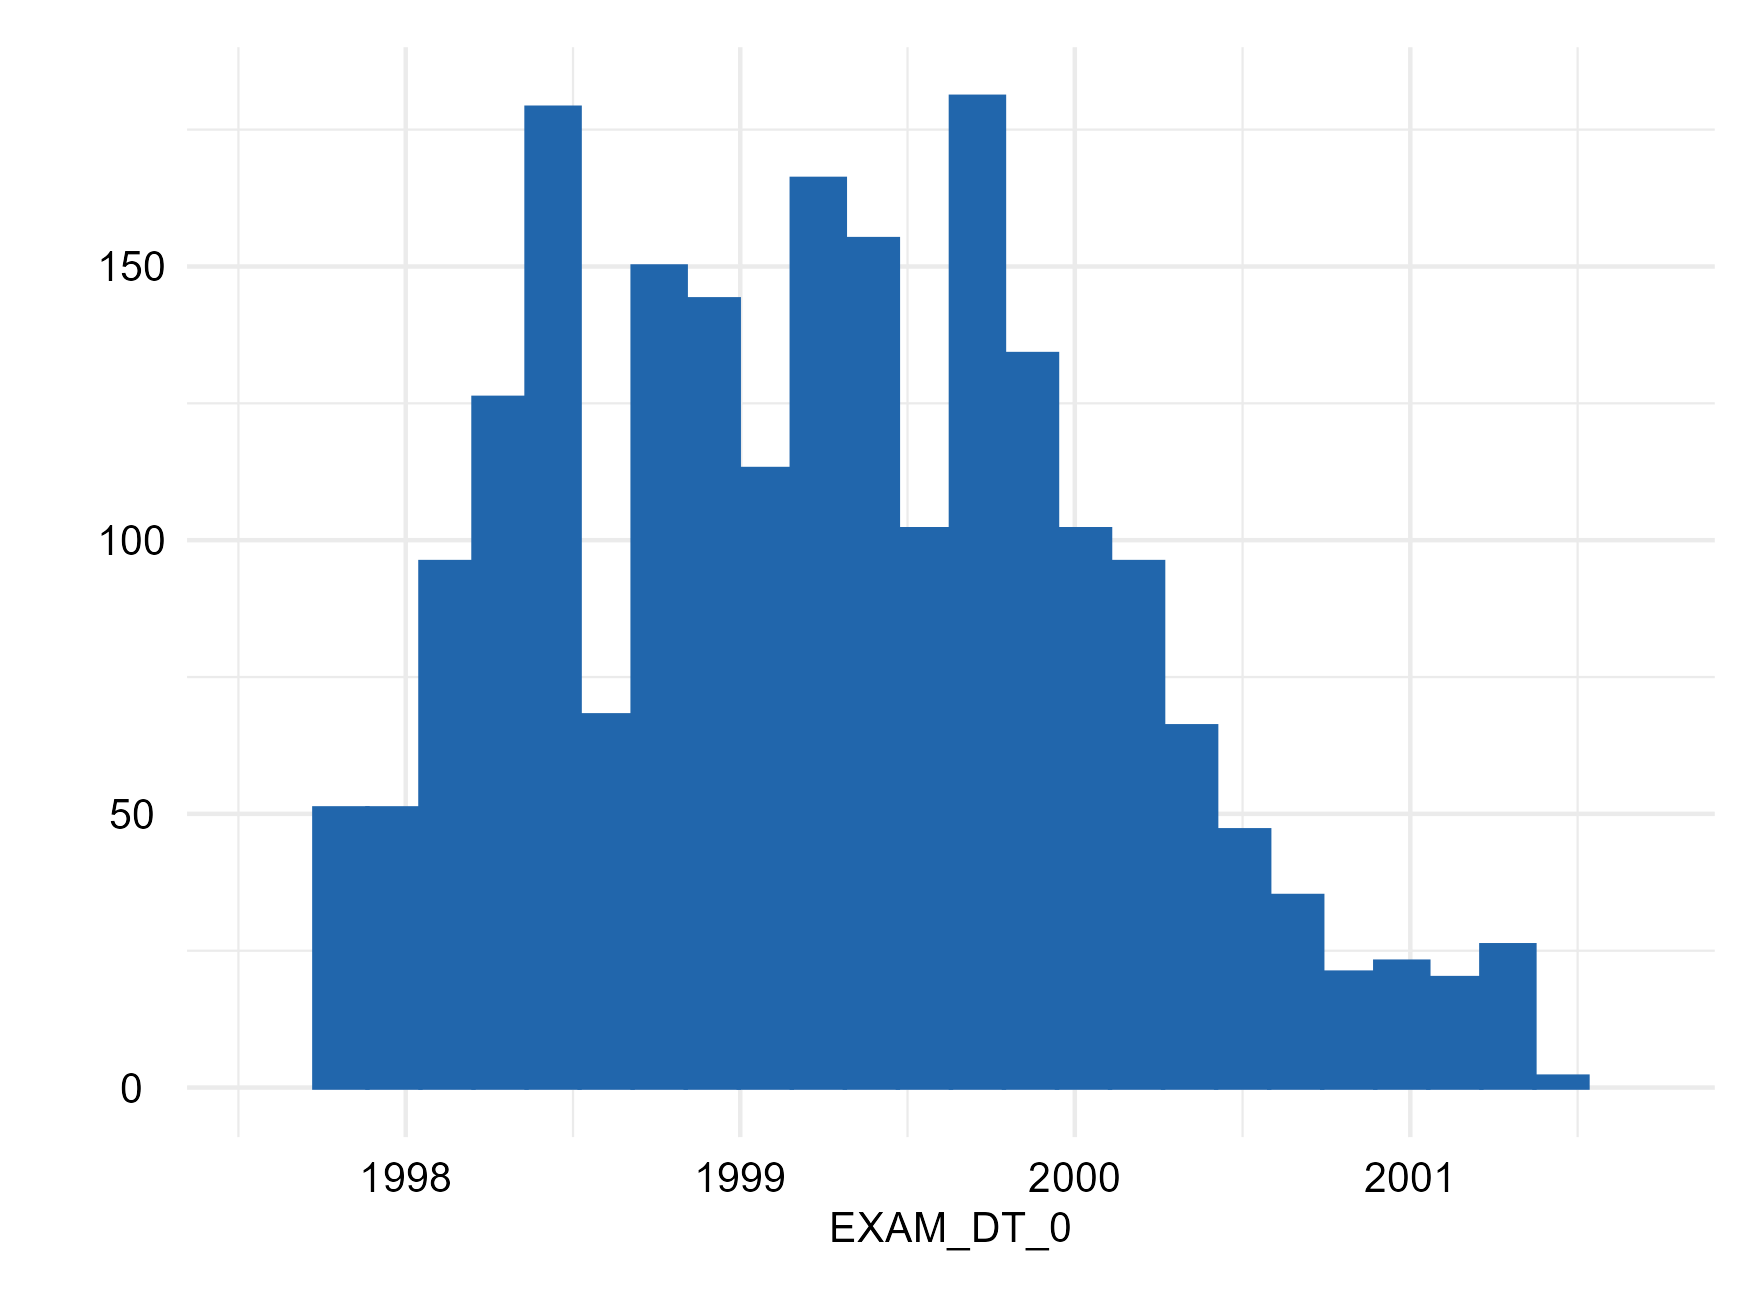
EXAM_DT_0
exdate
Examination date and time
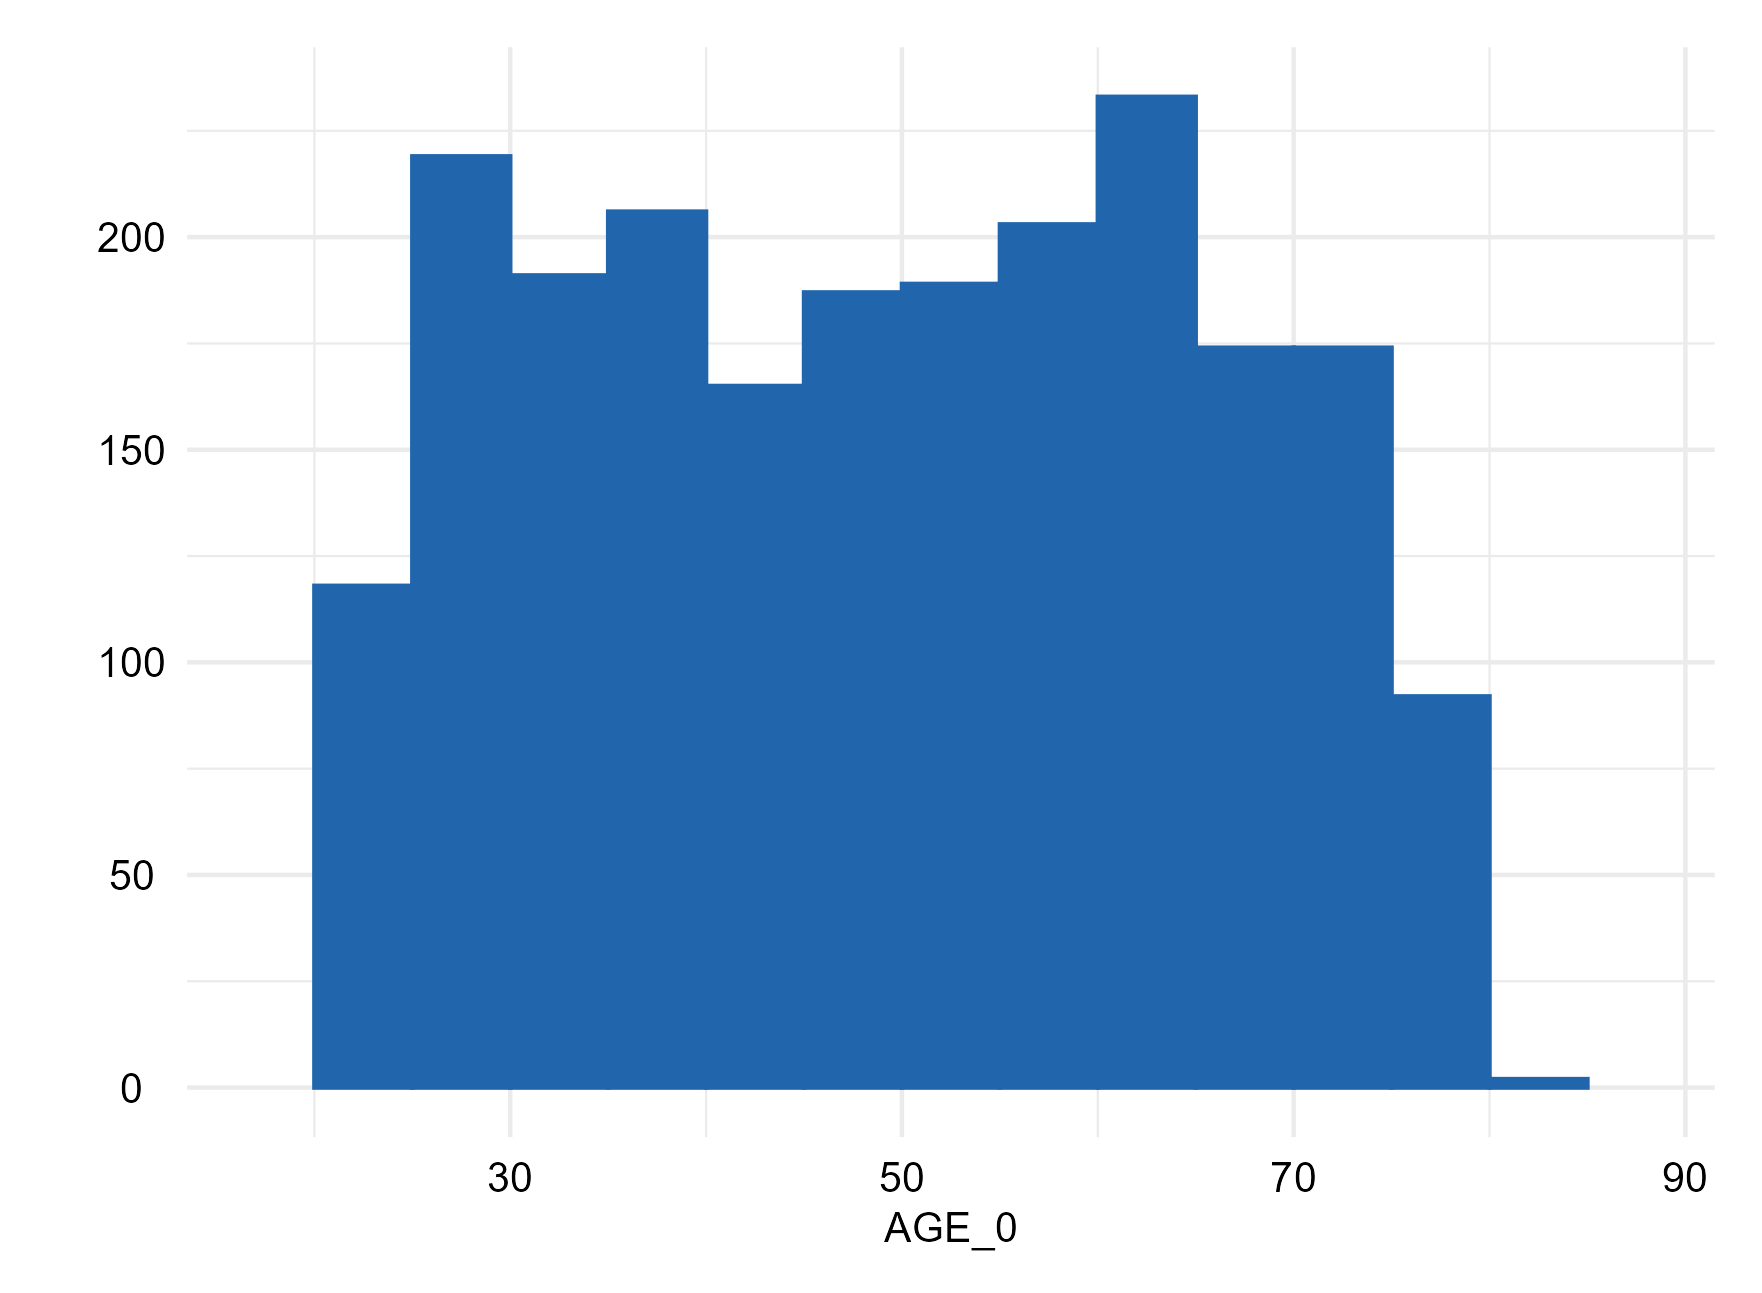
AGE_0
age
Age
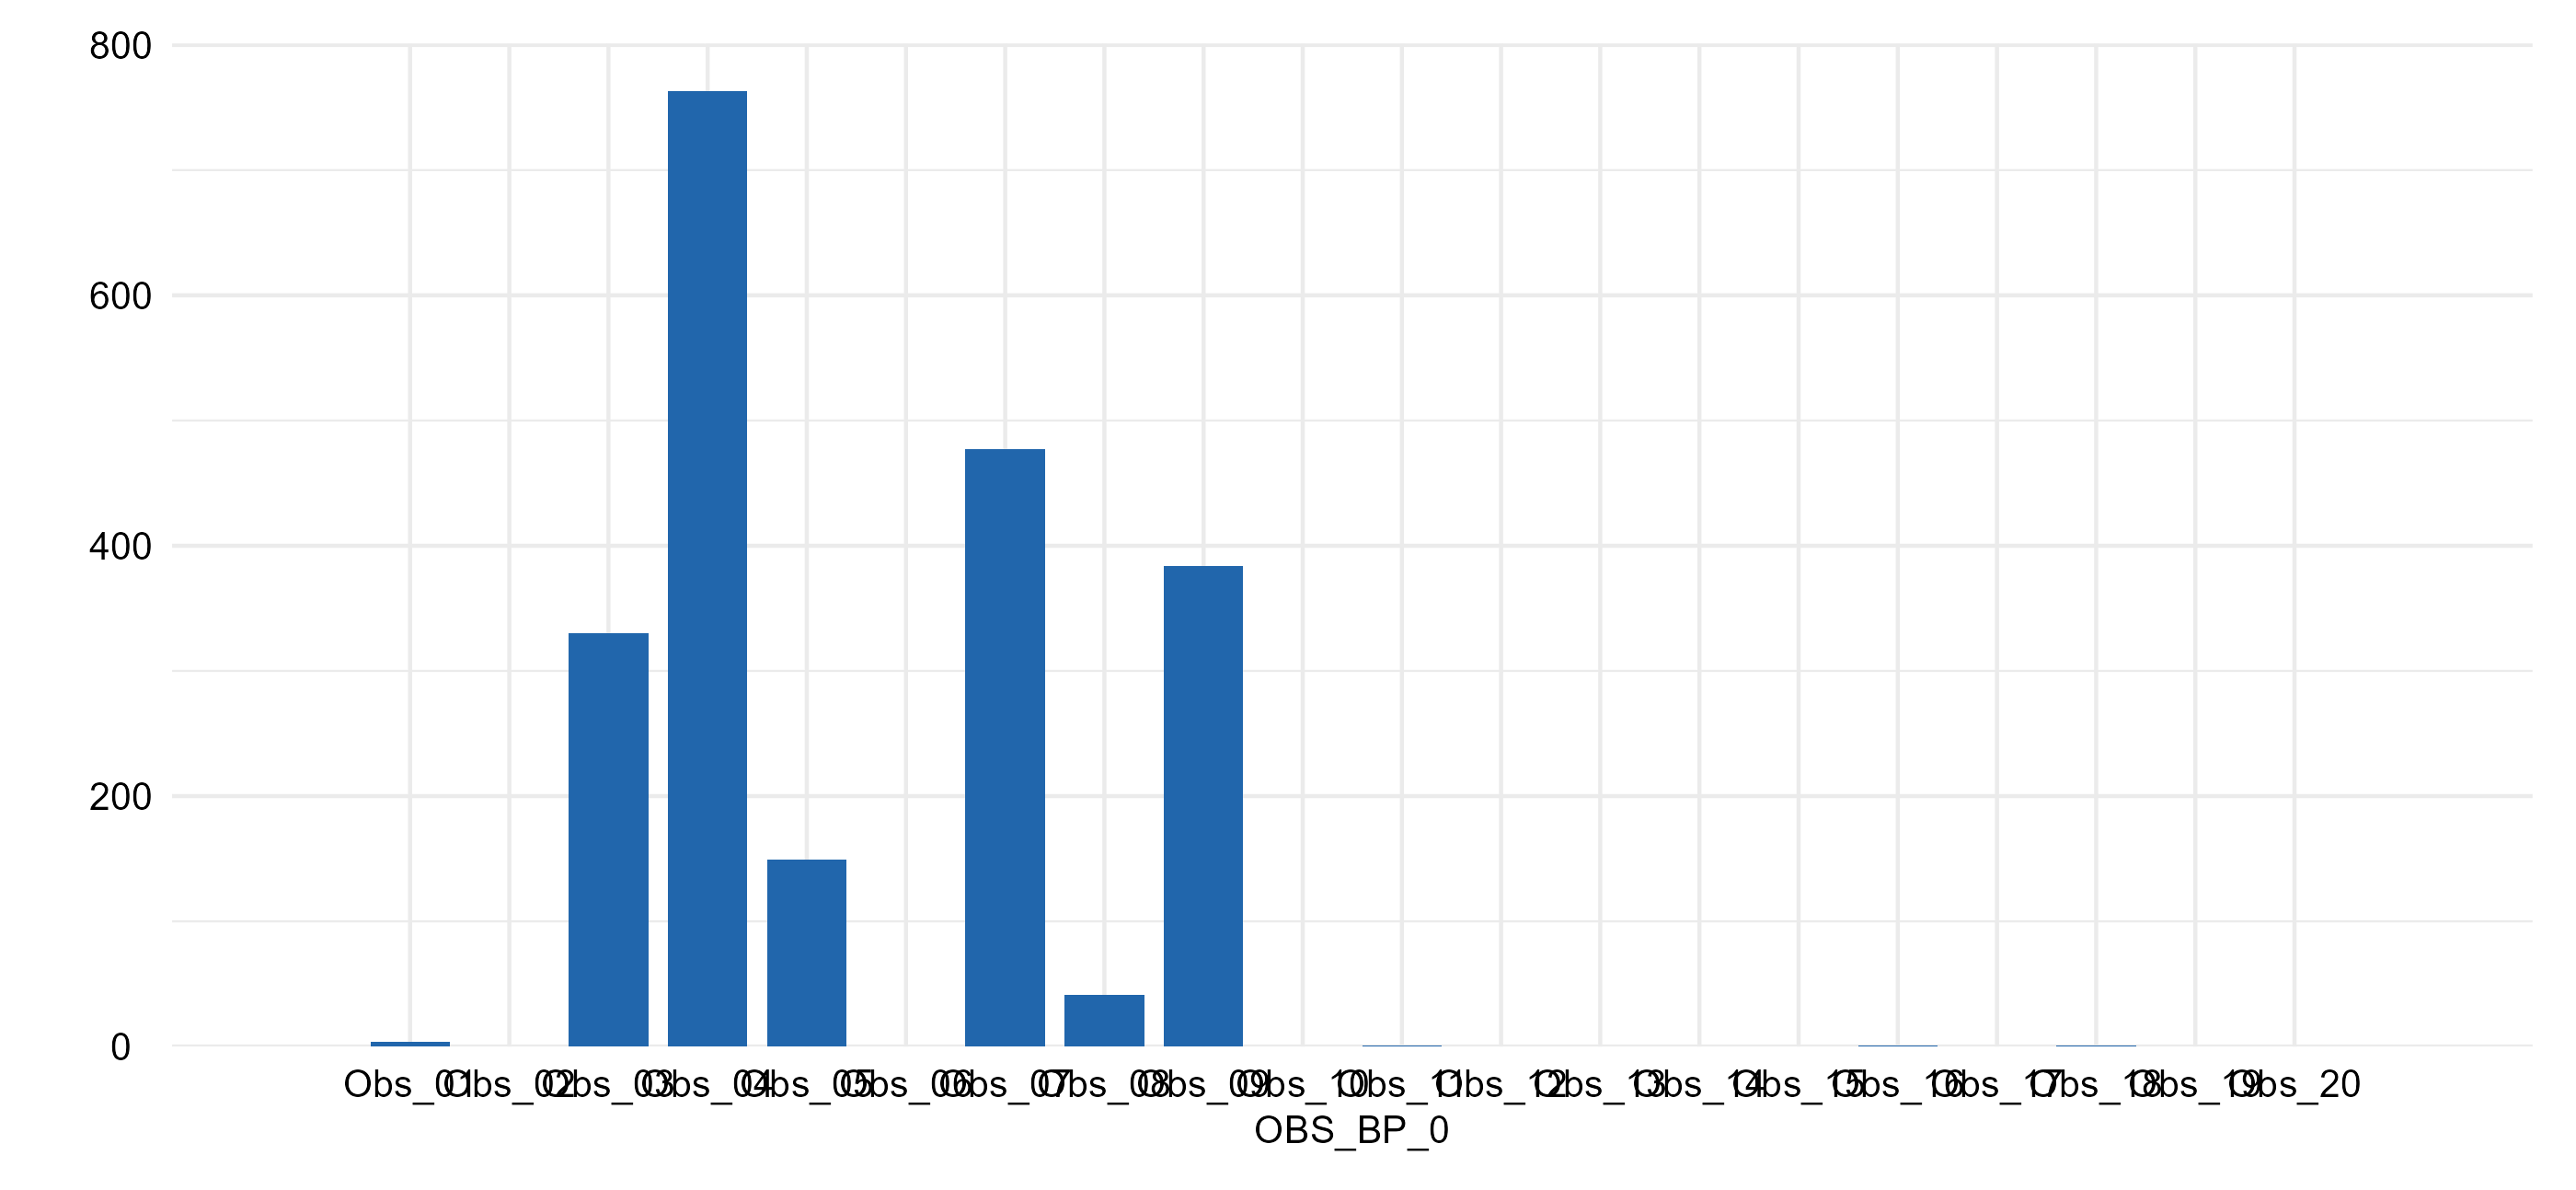
OBS_BP_0
obs_bp
Blood pressure examiner
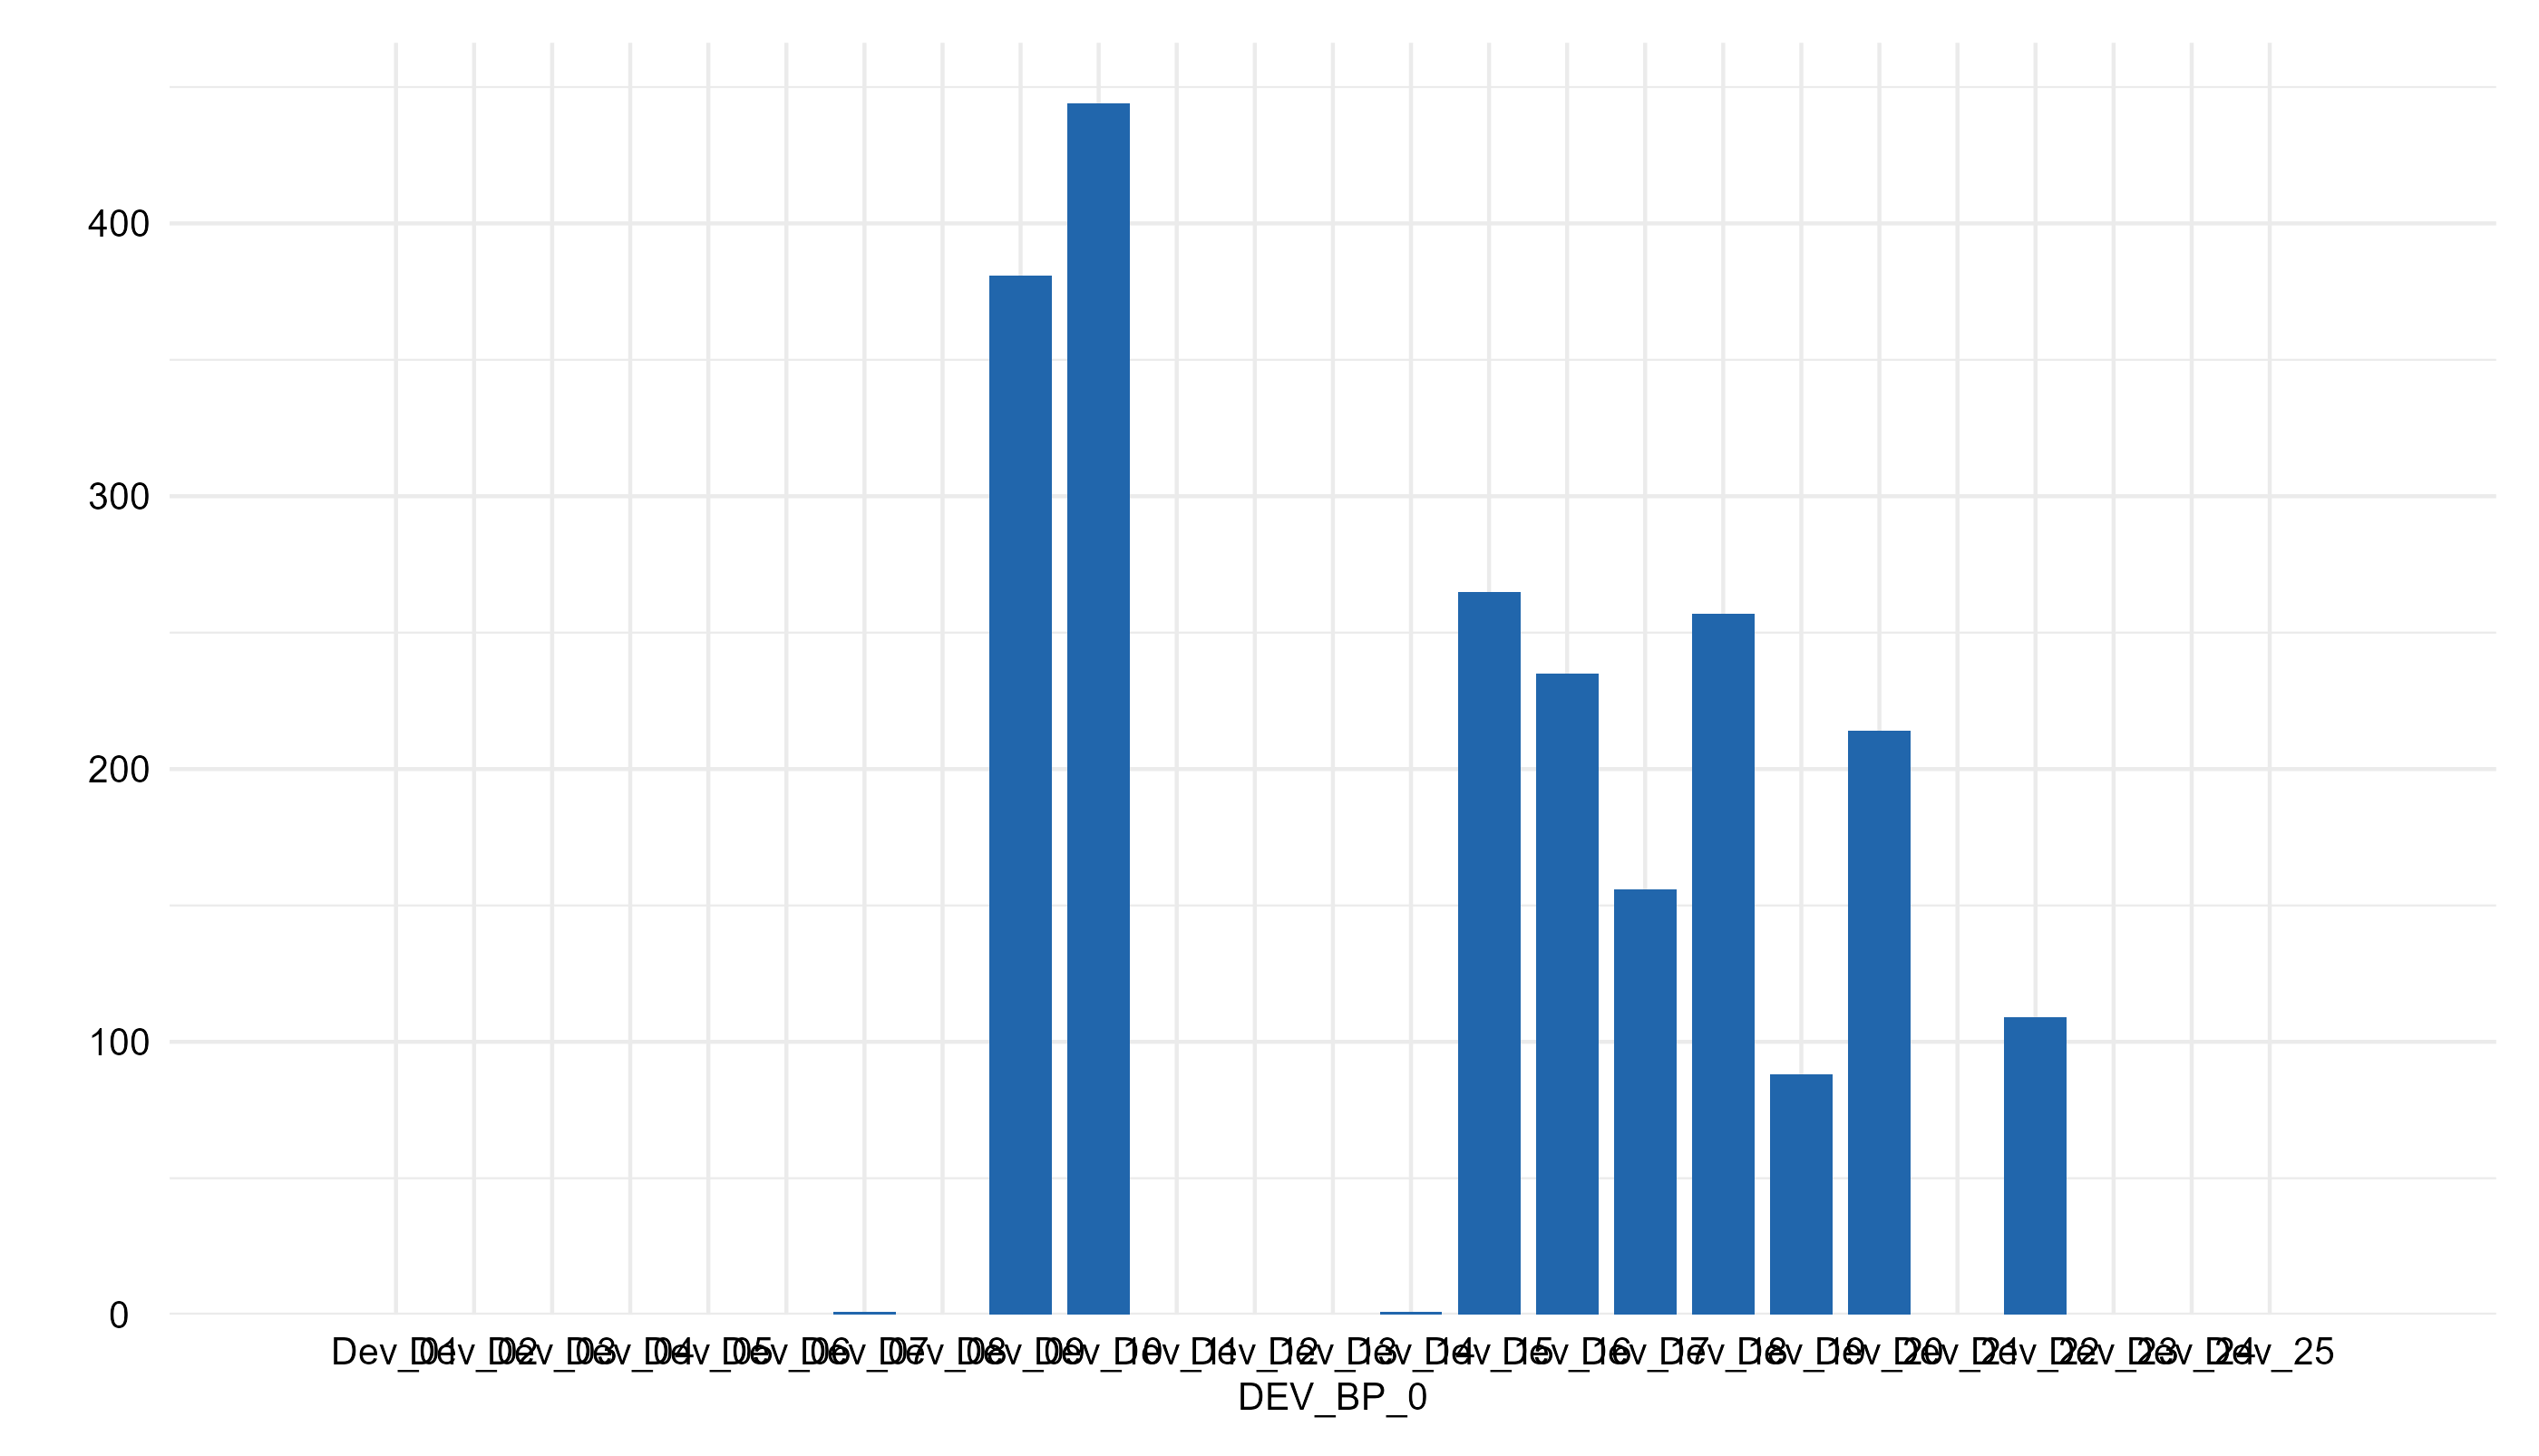
DEV_BP_0
dev_bp
Blood pressure device ID
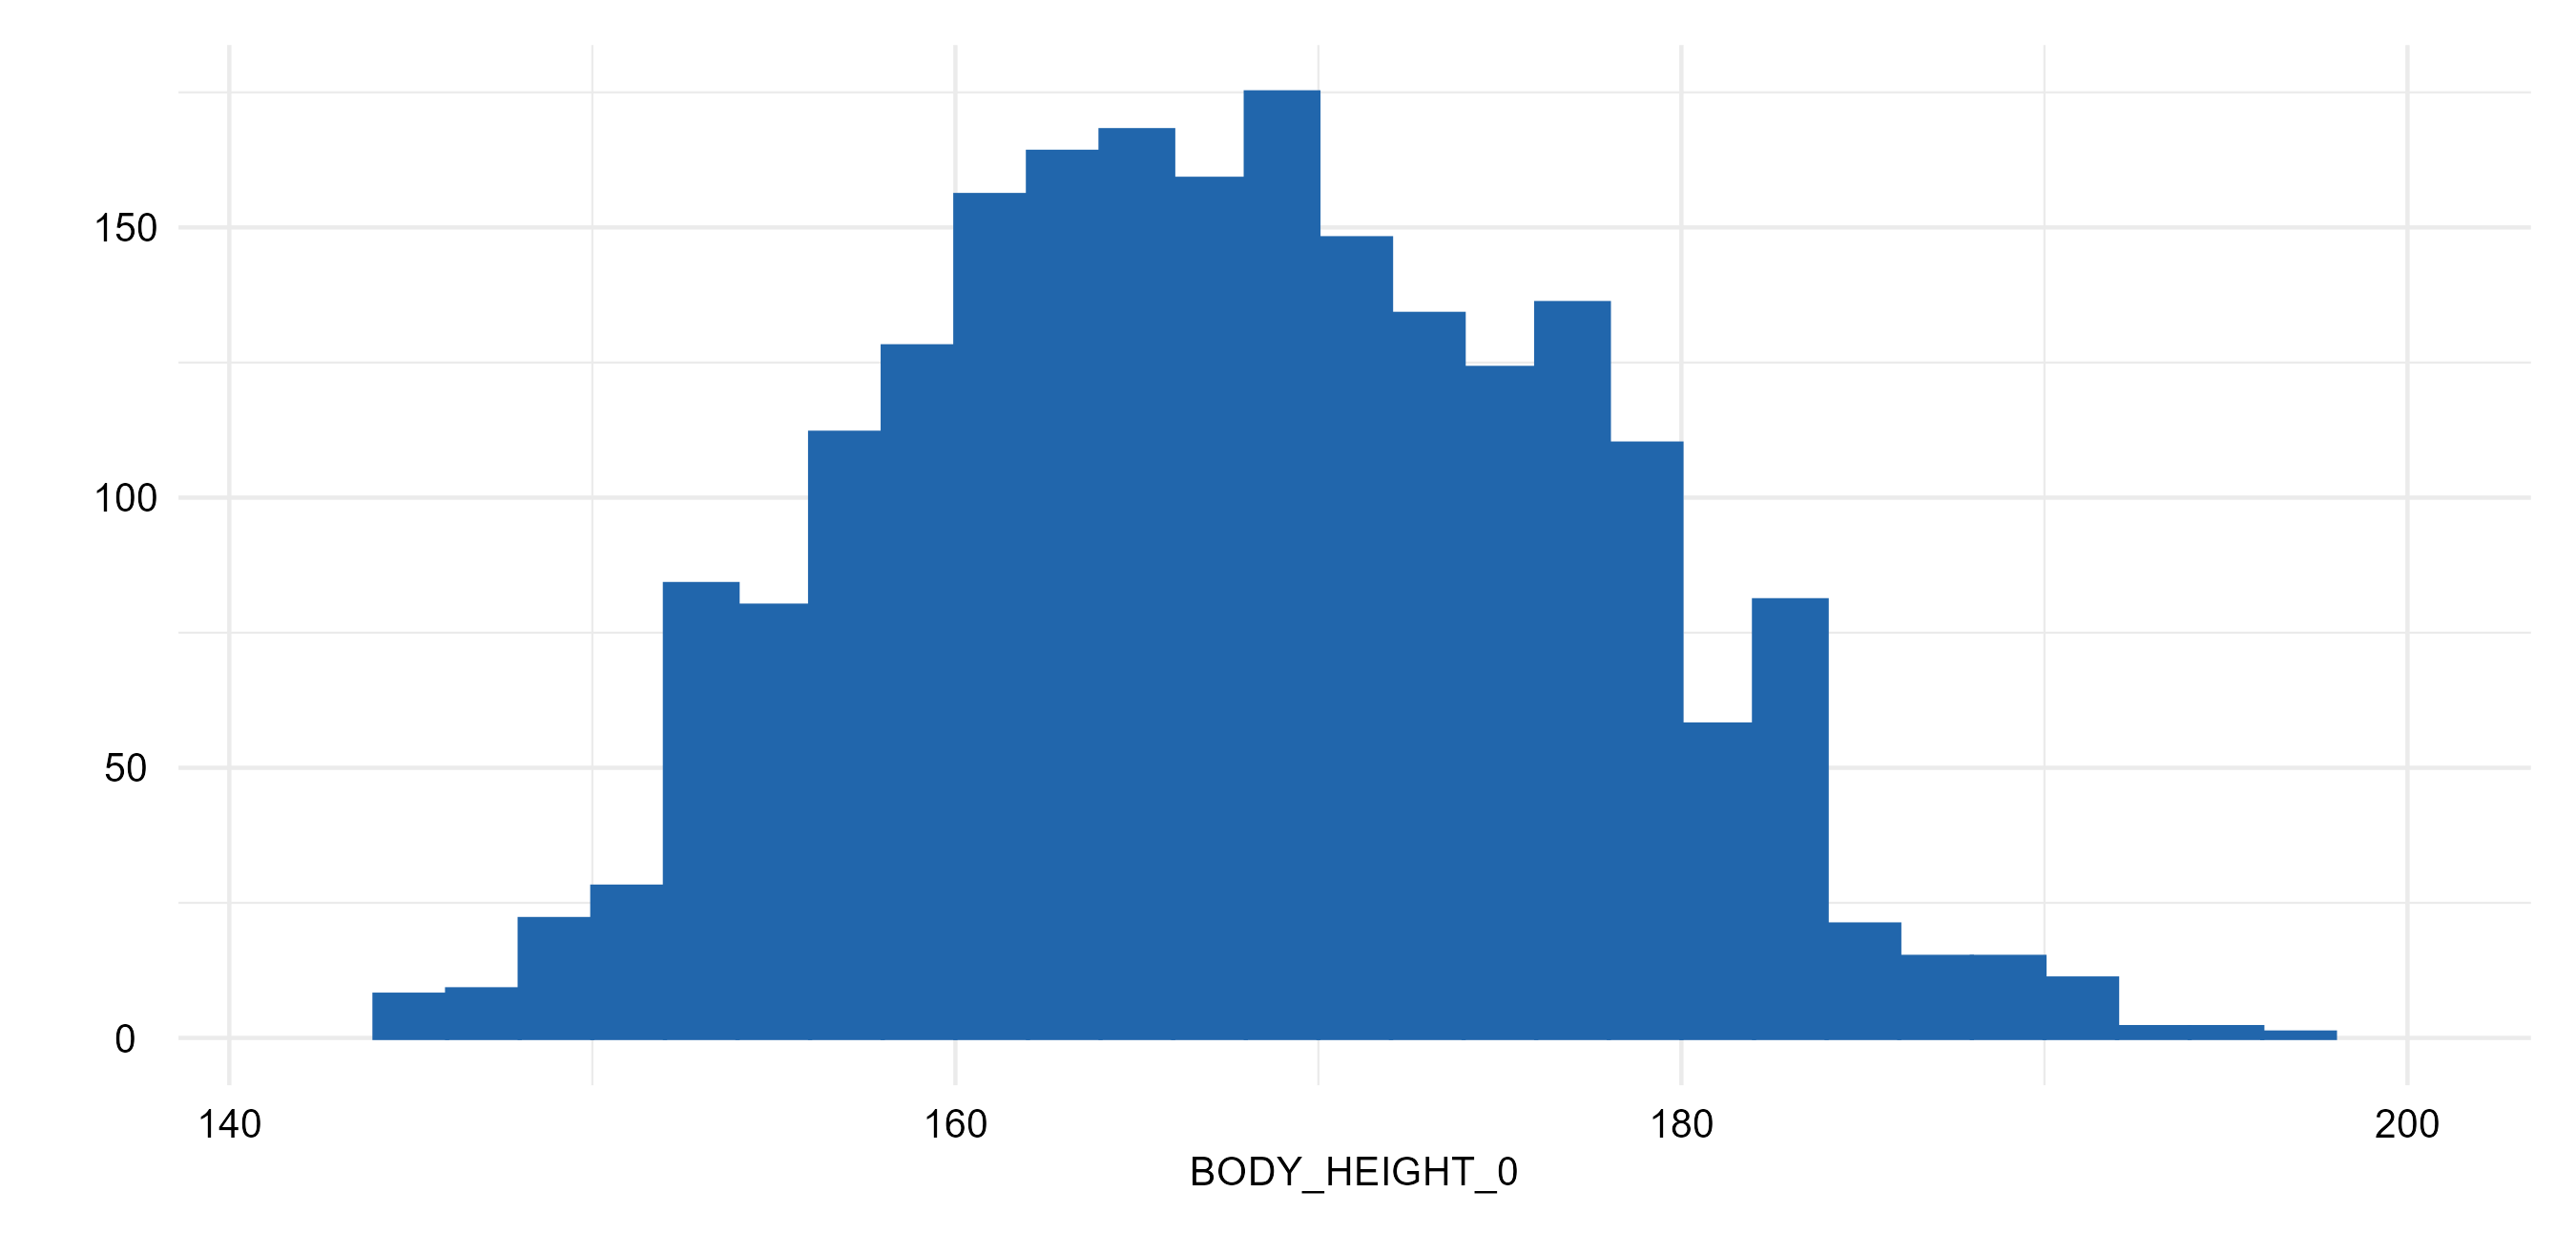
BODY_HEIGHT_0
height
Body height
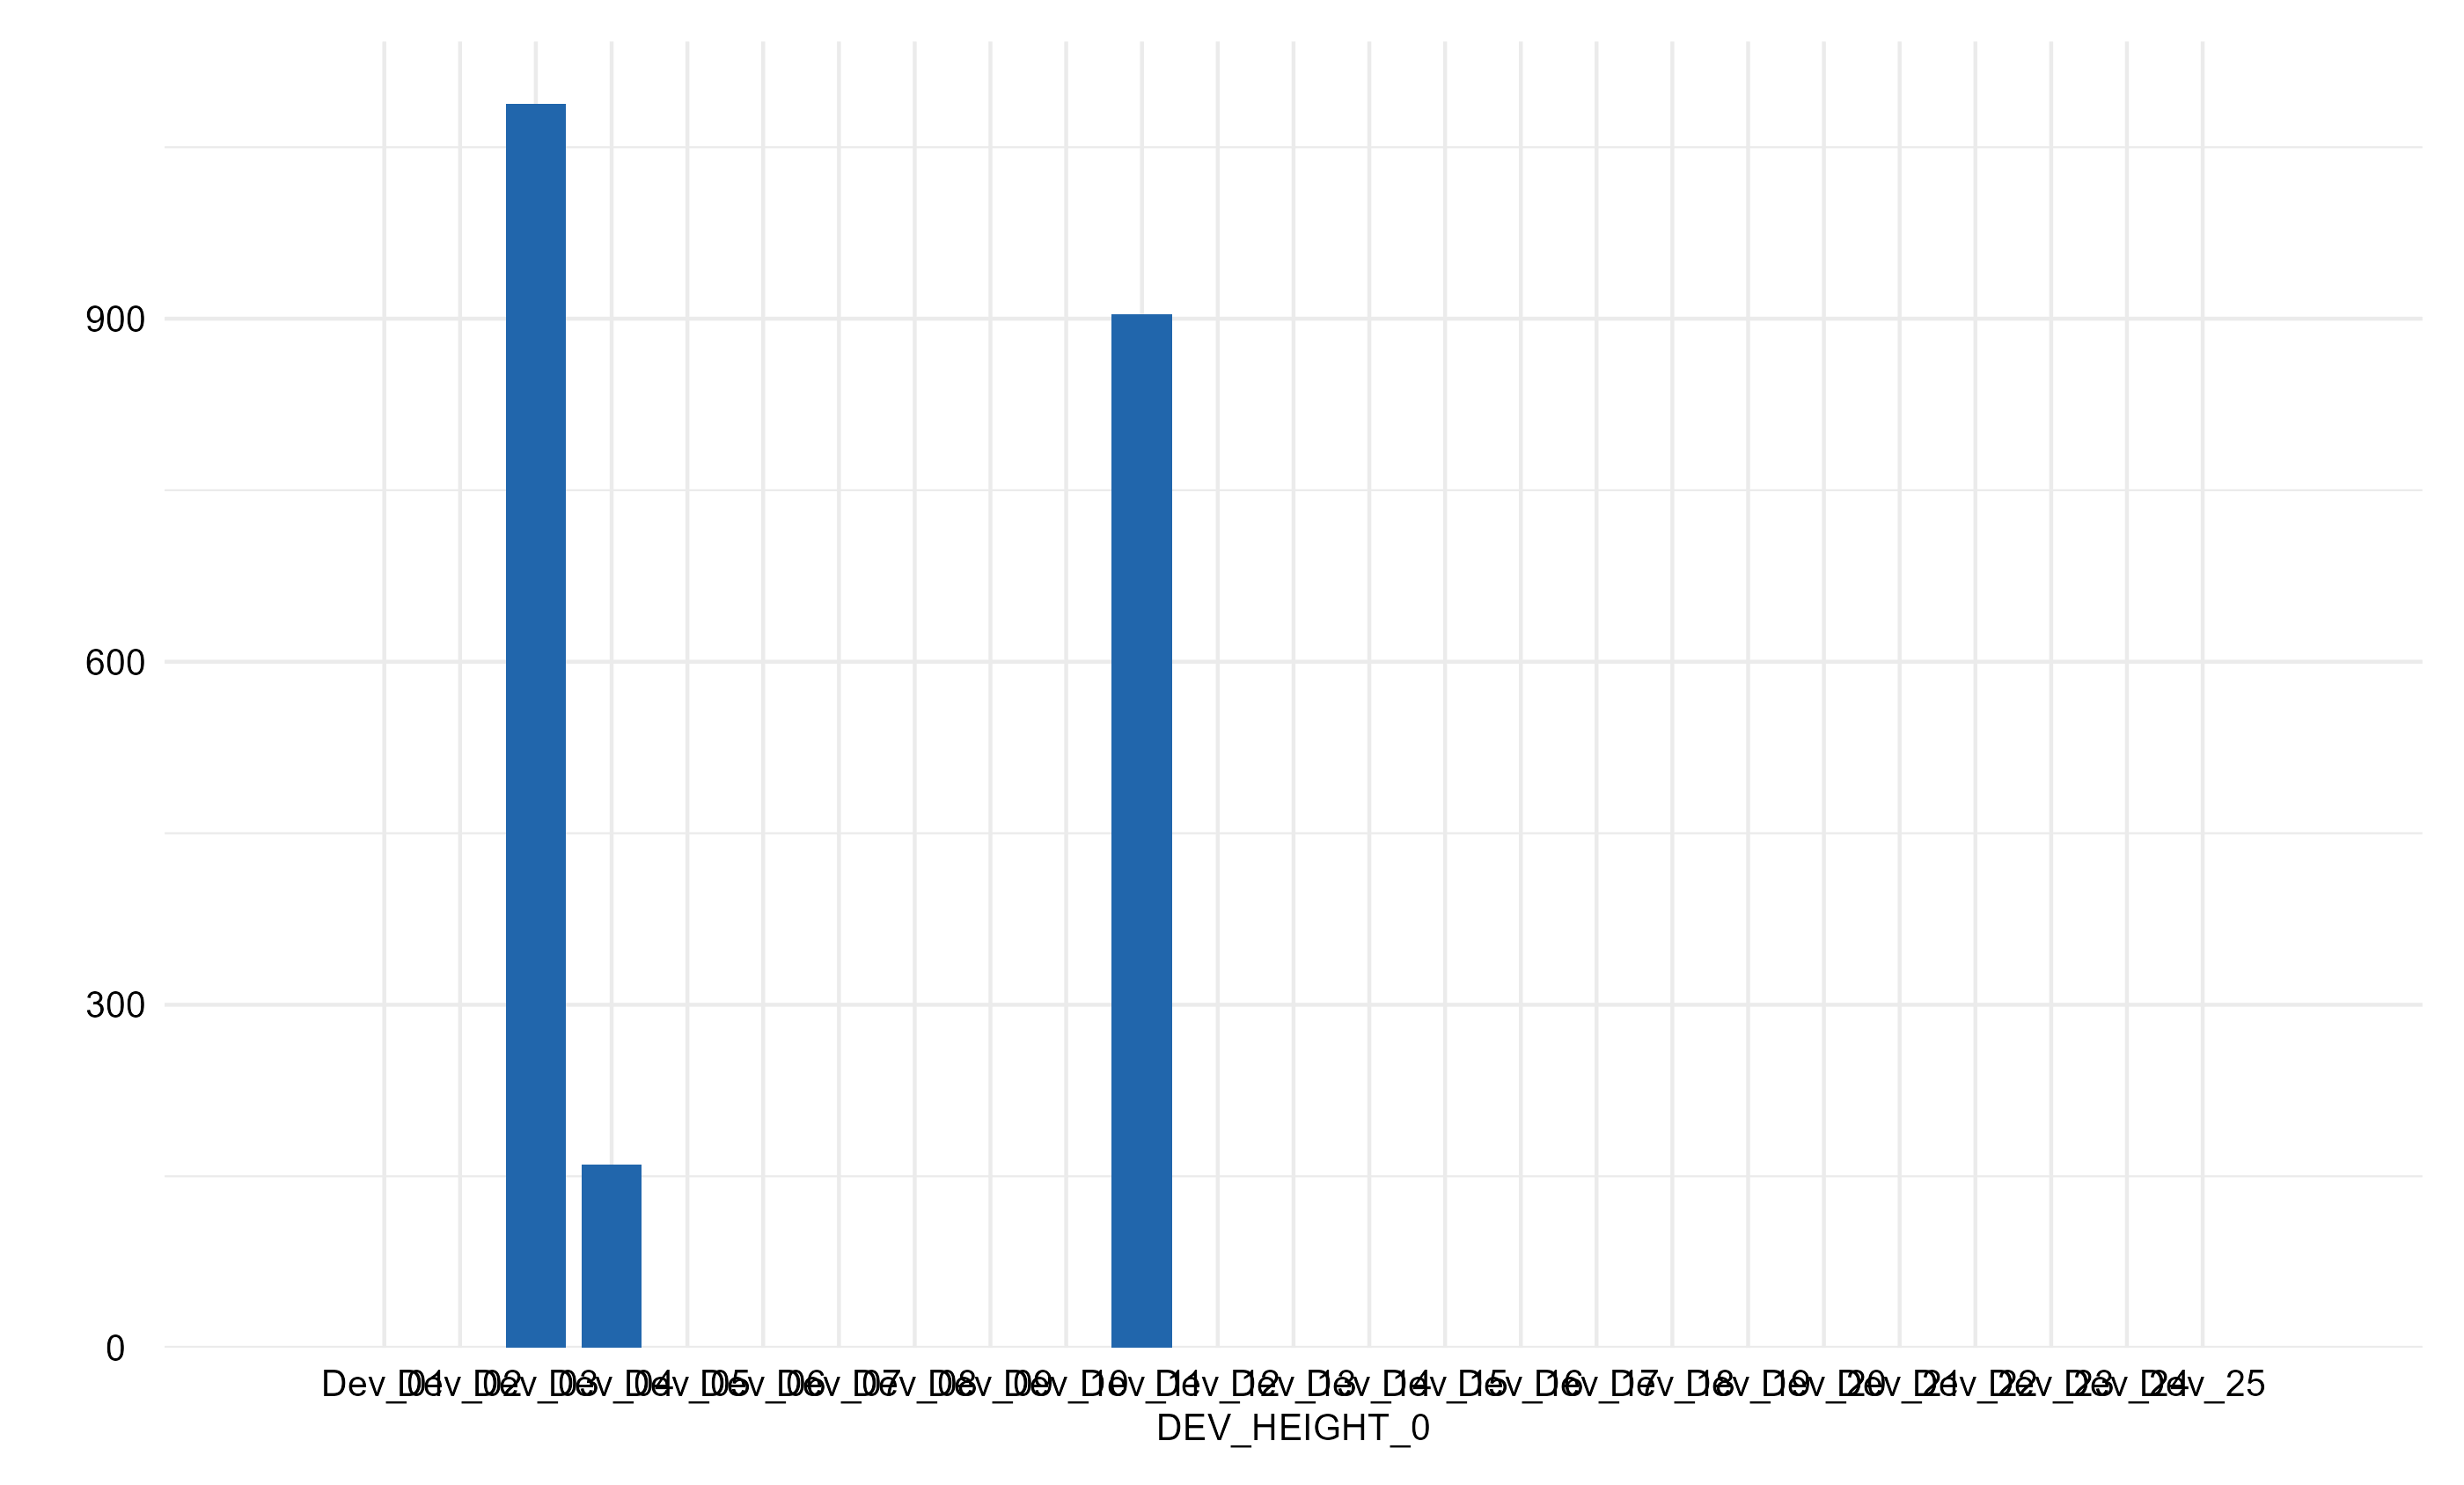
DEV_HEIGHT_0
dev_length
Body height scale ID
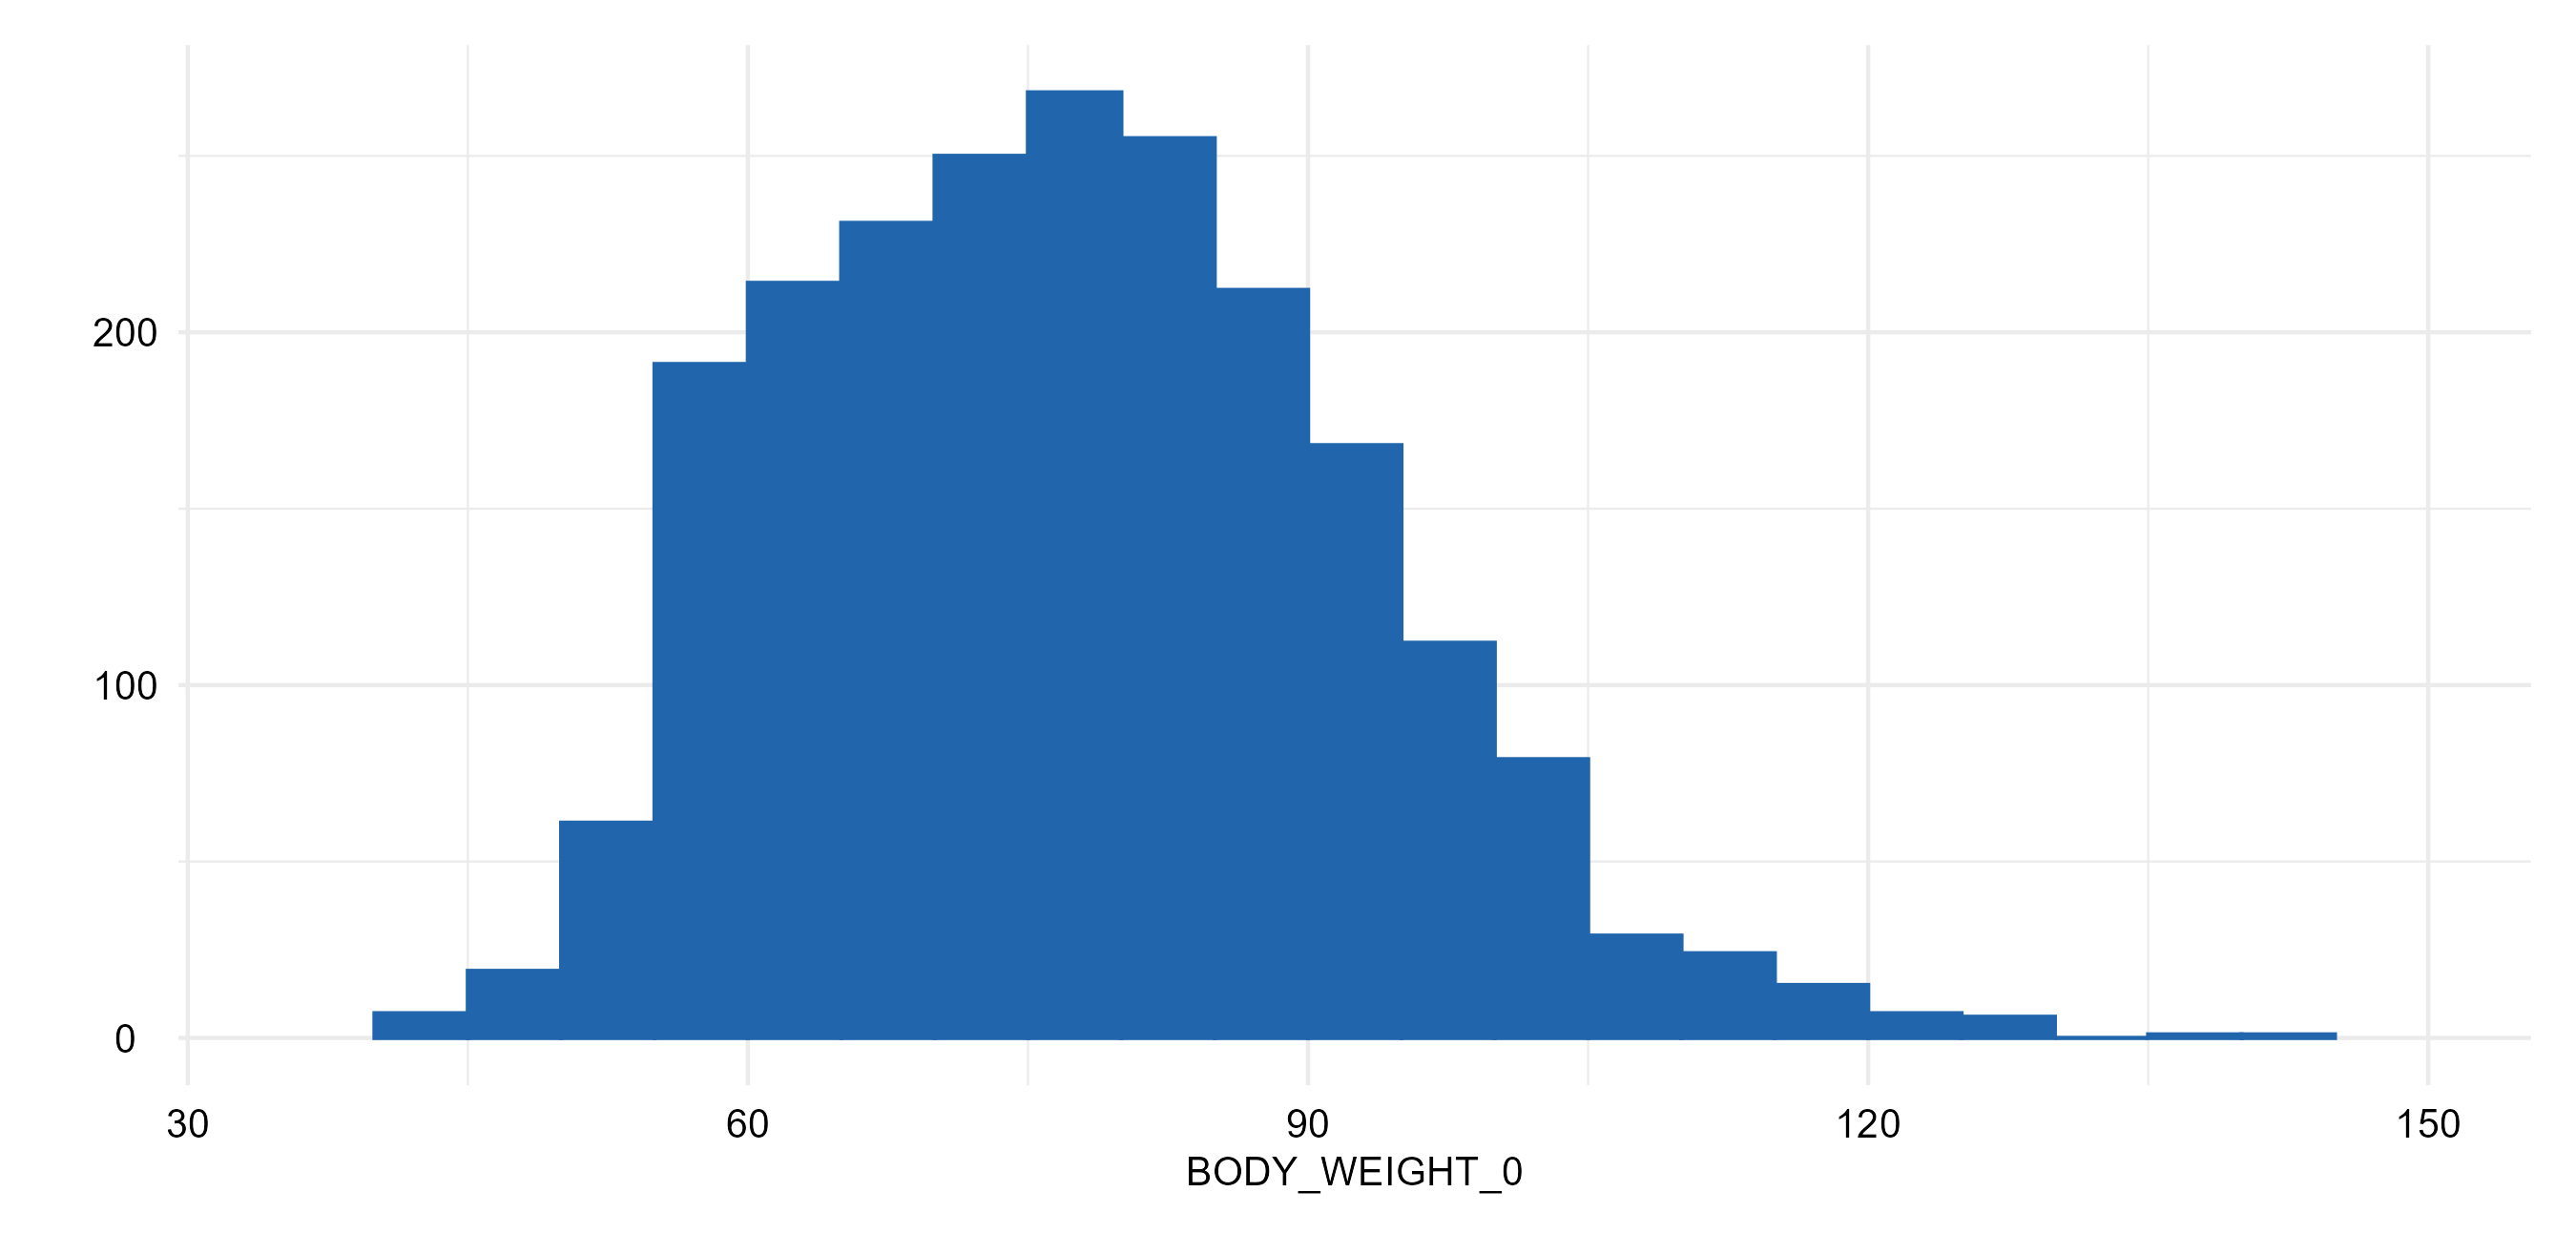
BODY_WEIGHT_0
weight
Body weight
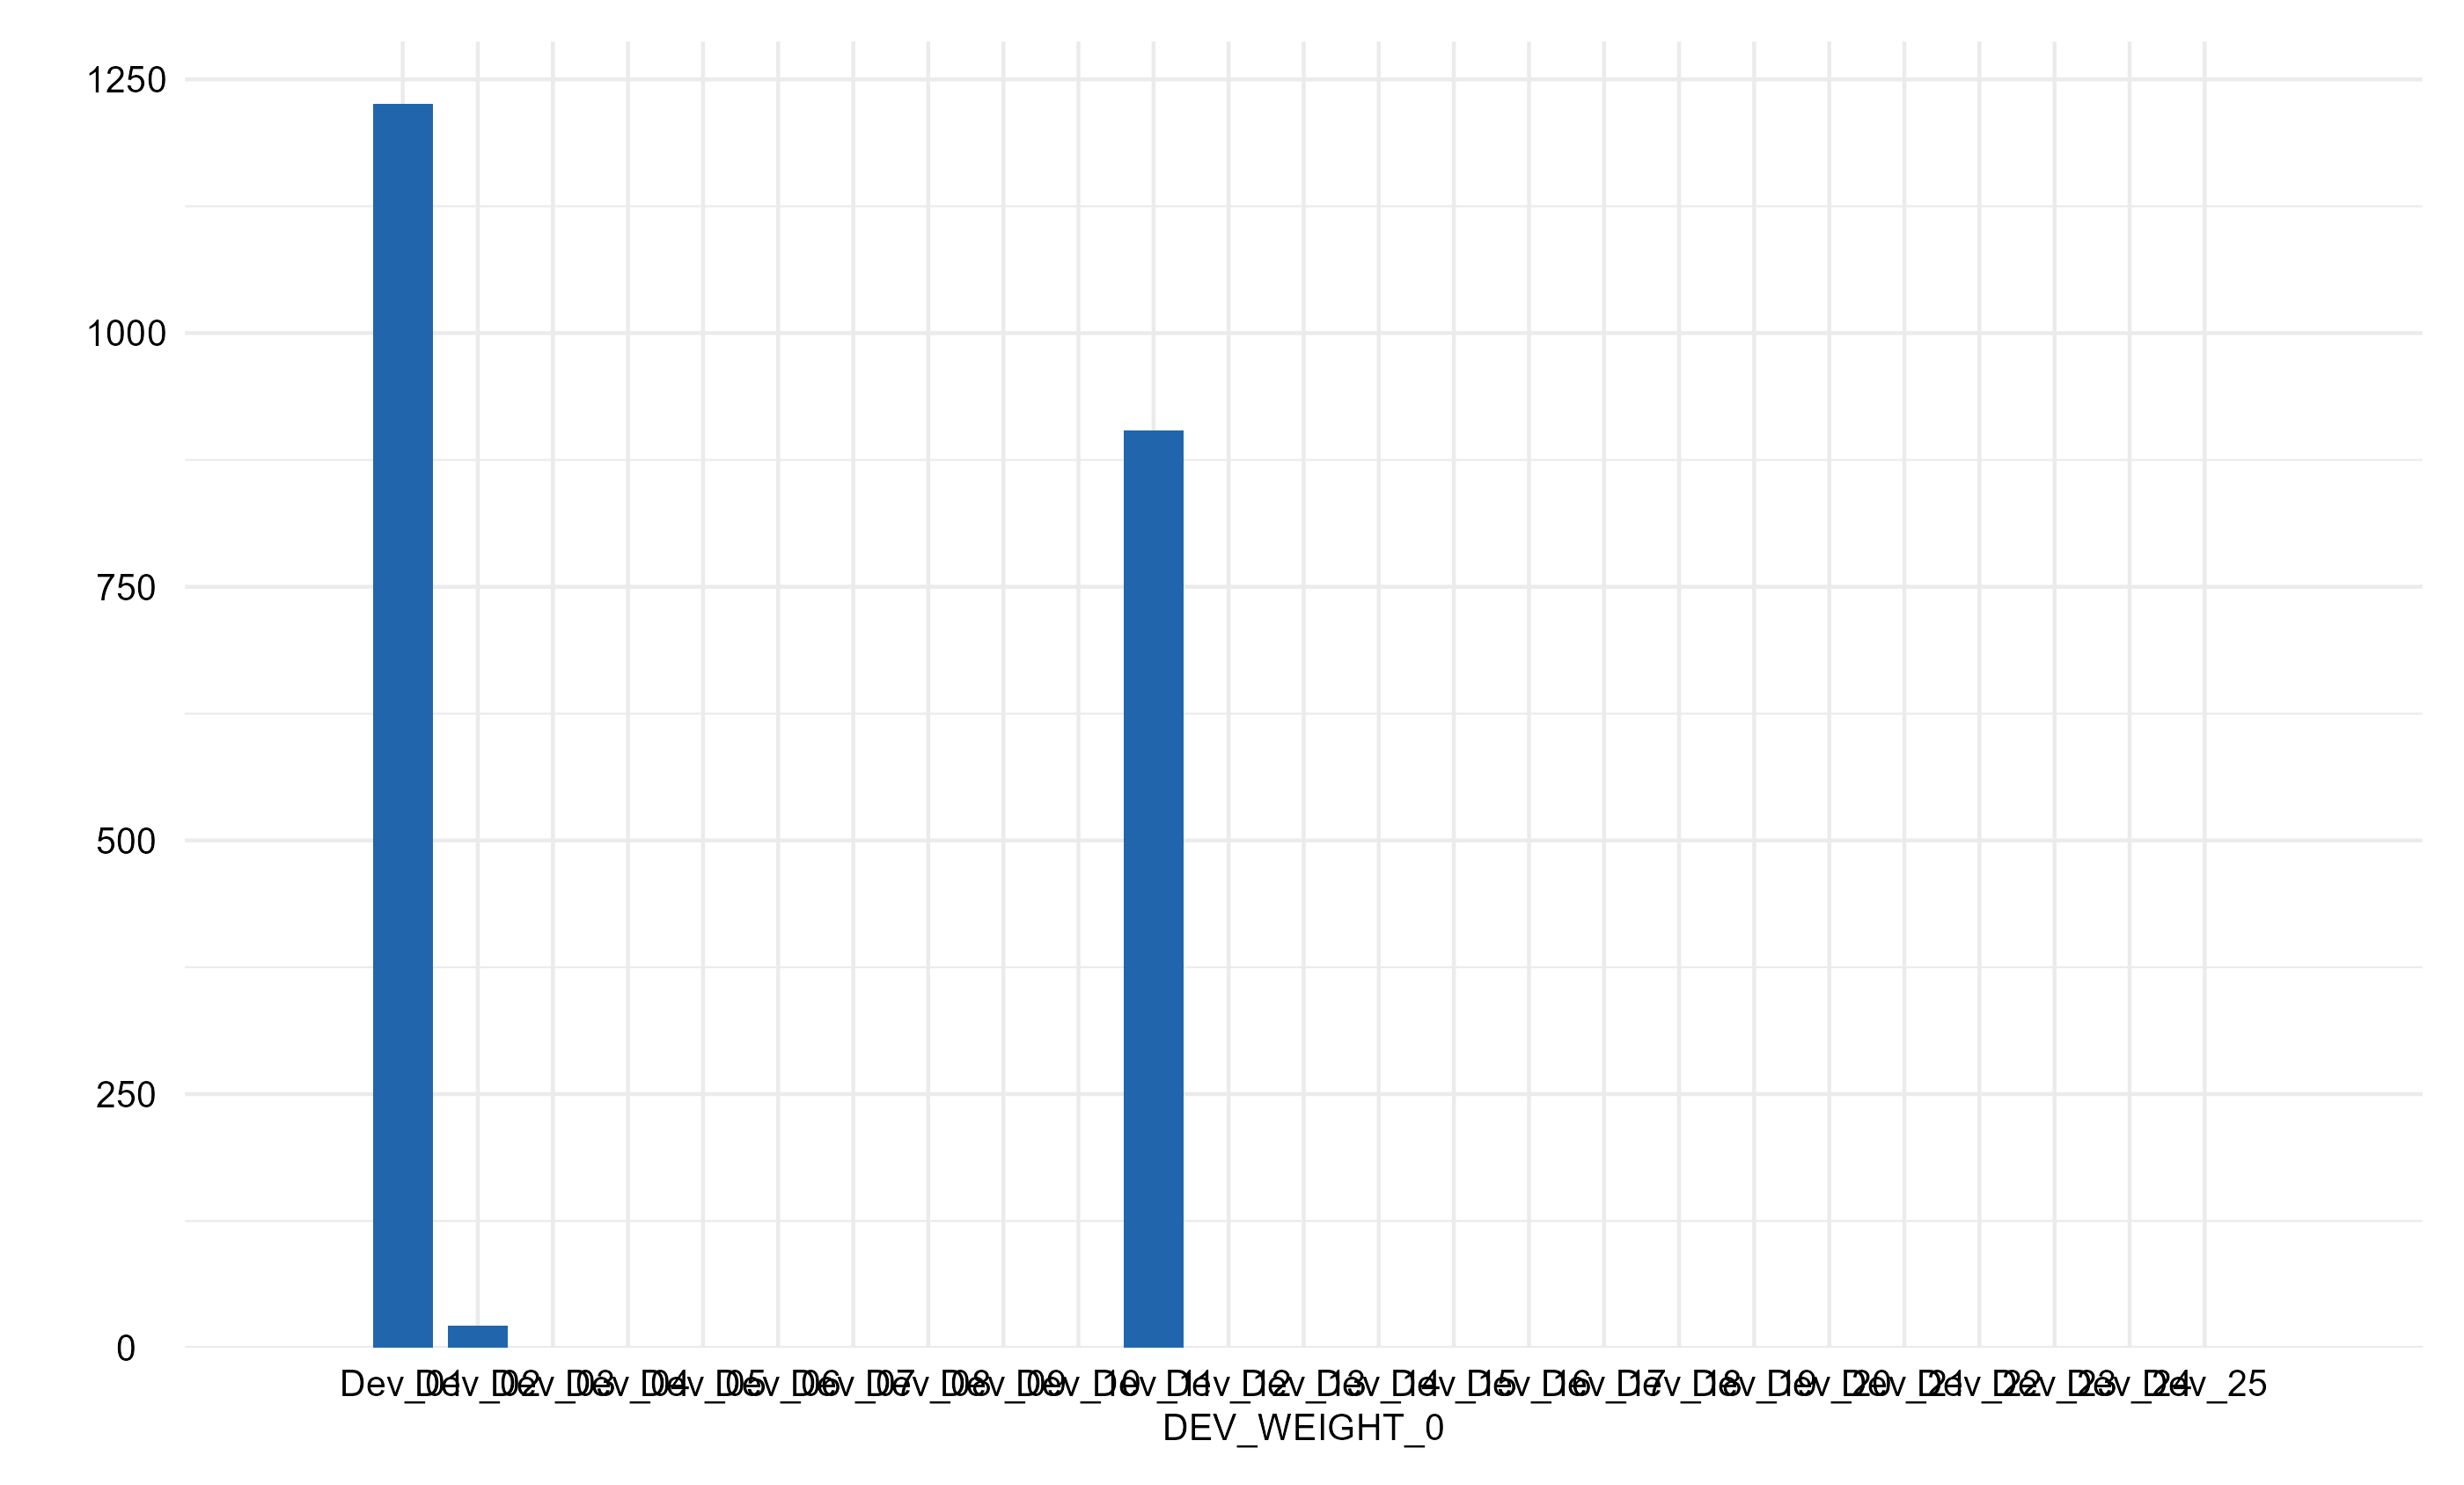
DEV_WEIGHT_0
dev_weight
Body weight scale ID
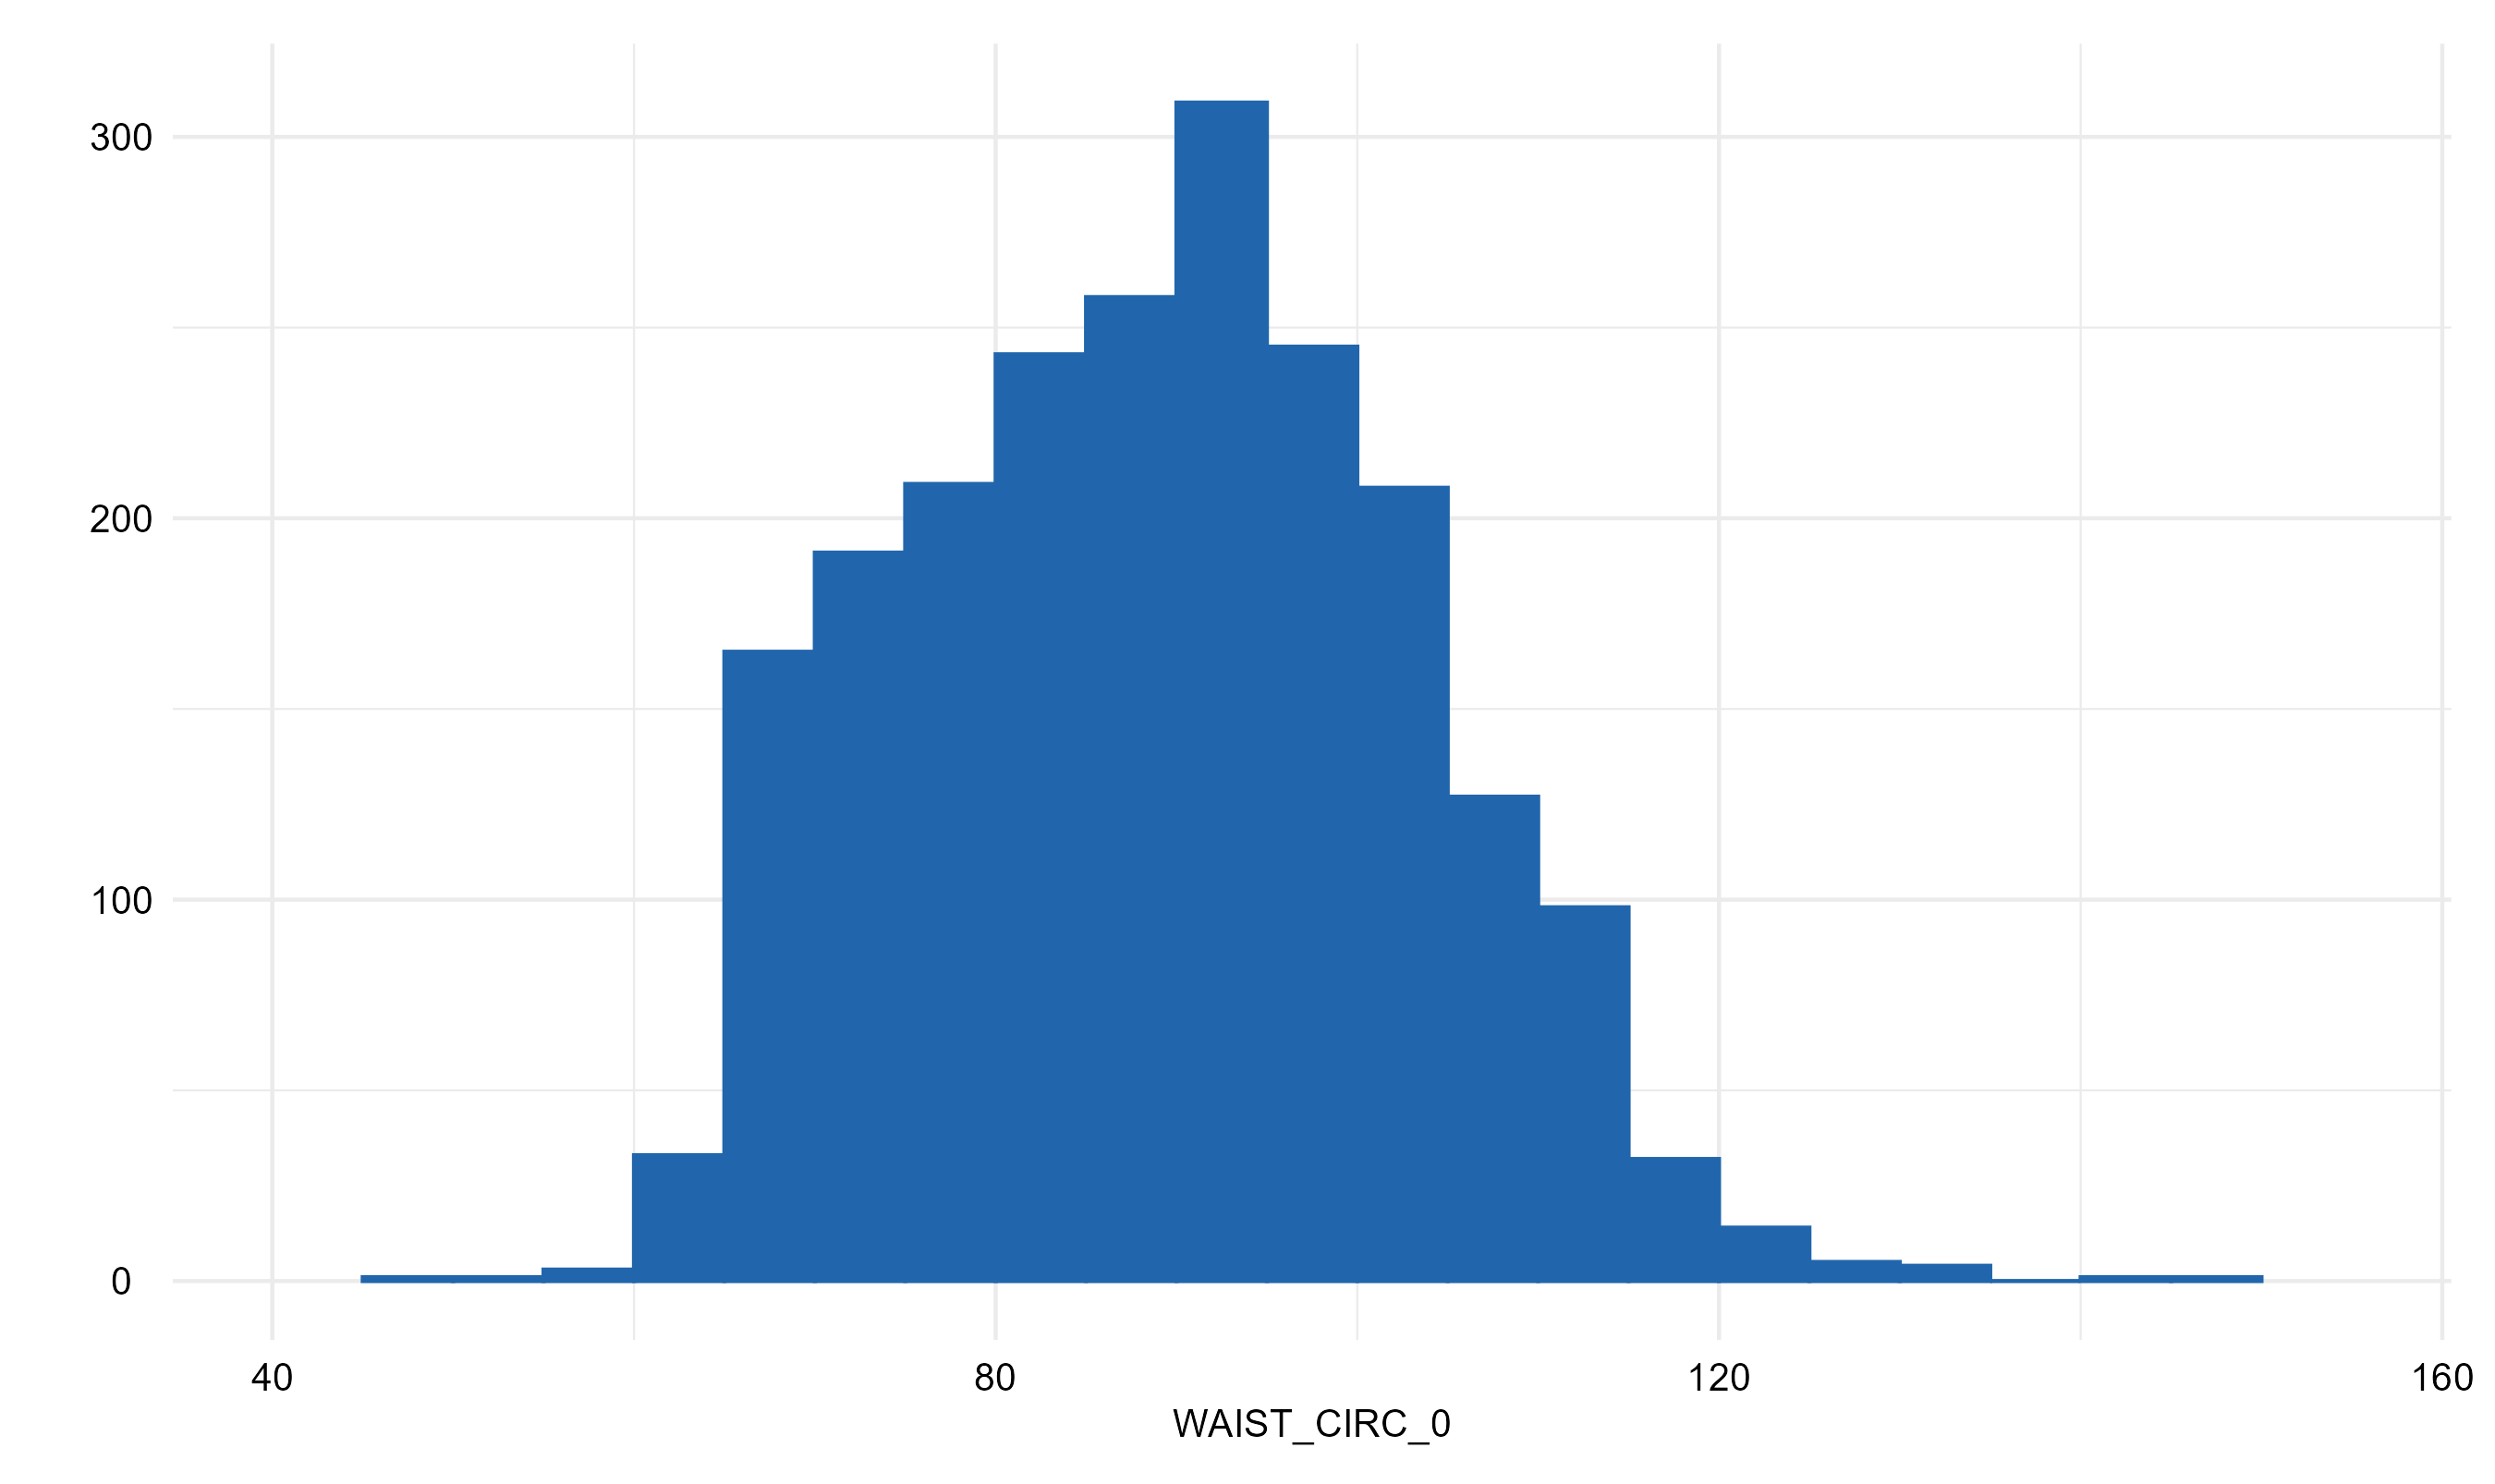
WAIST_CIRC_0
waist
Waist circumference
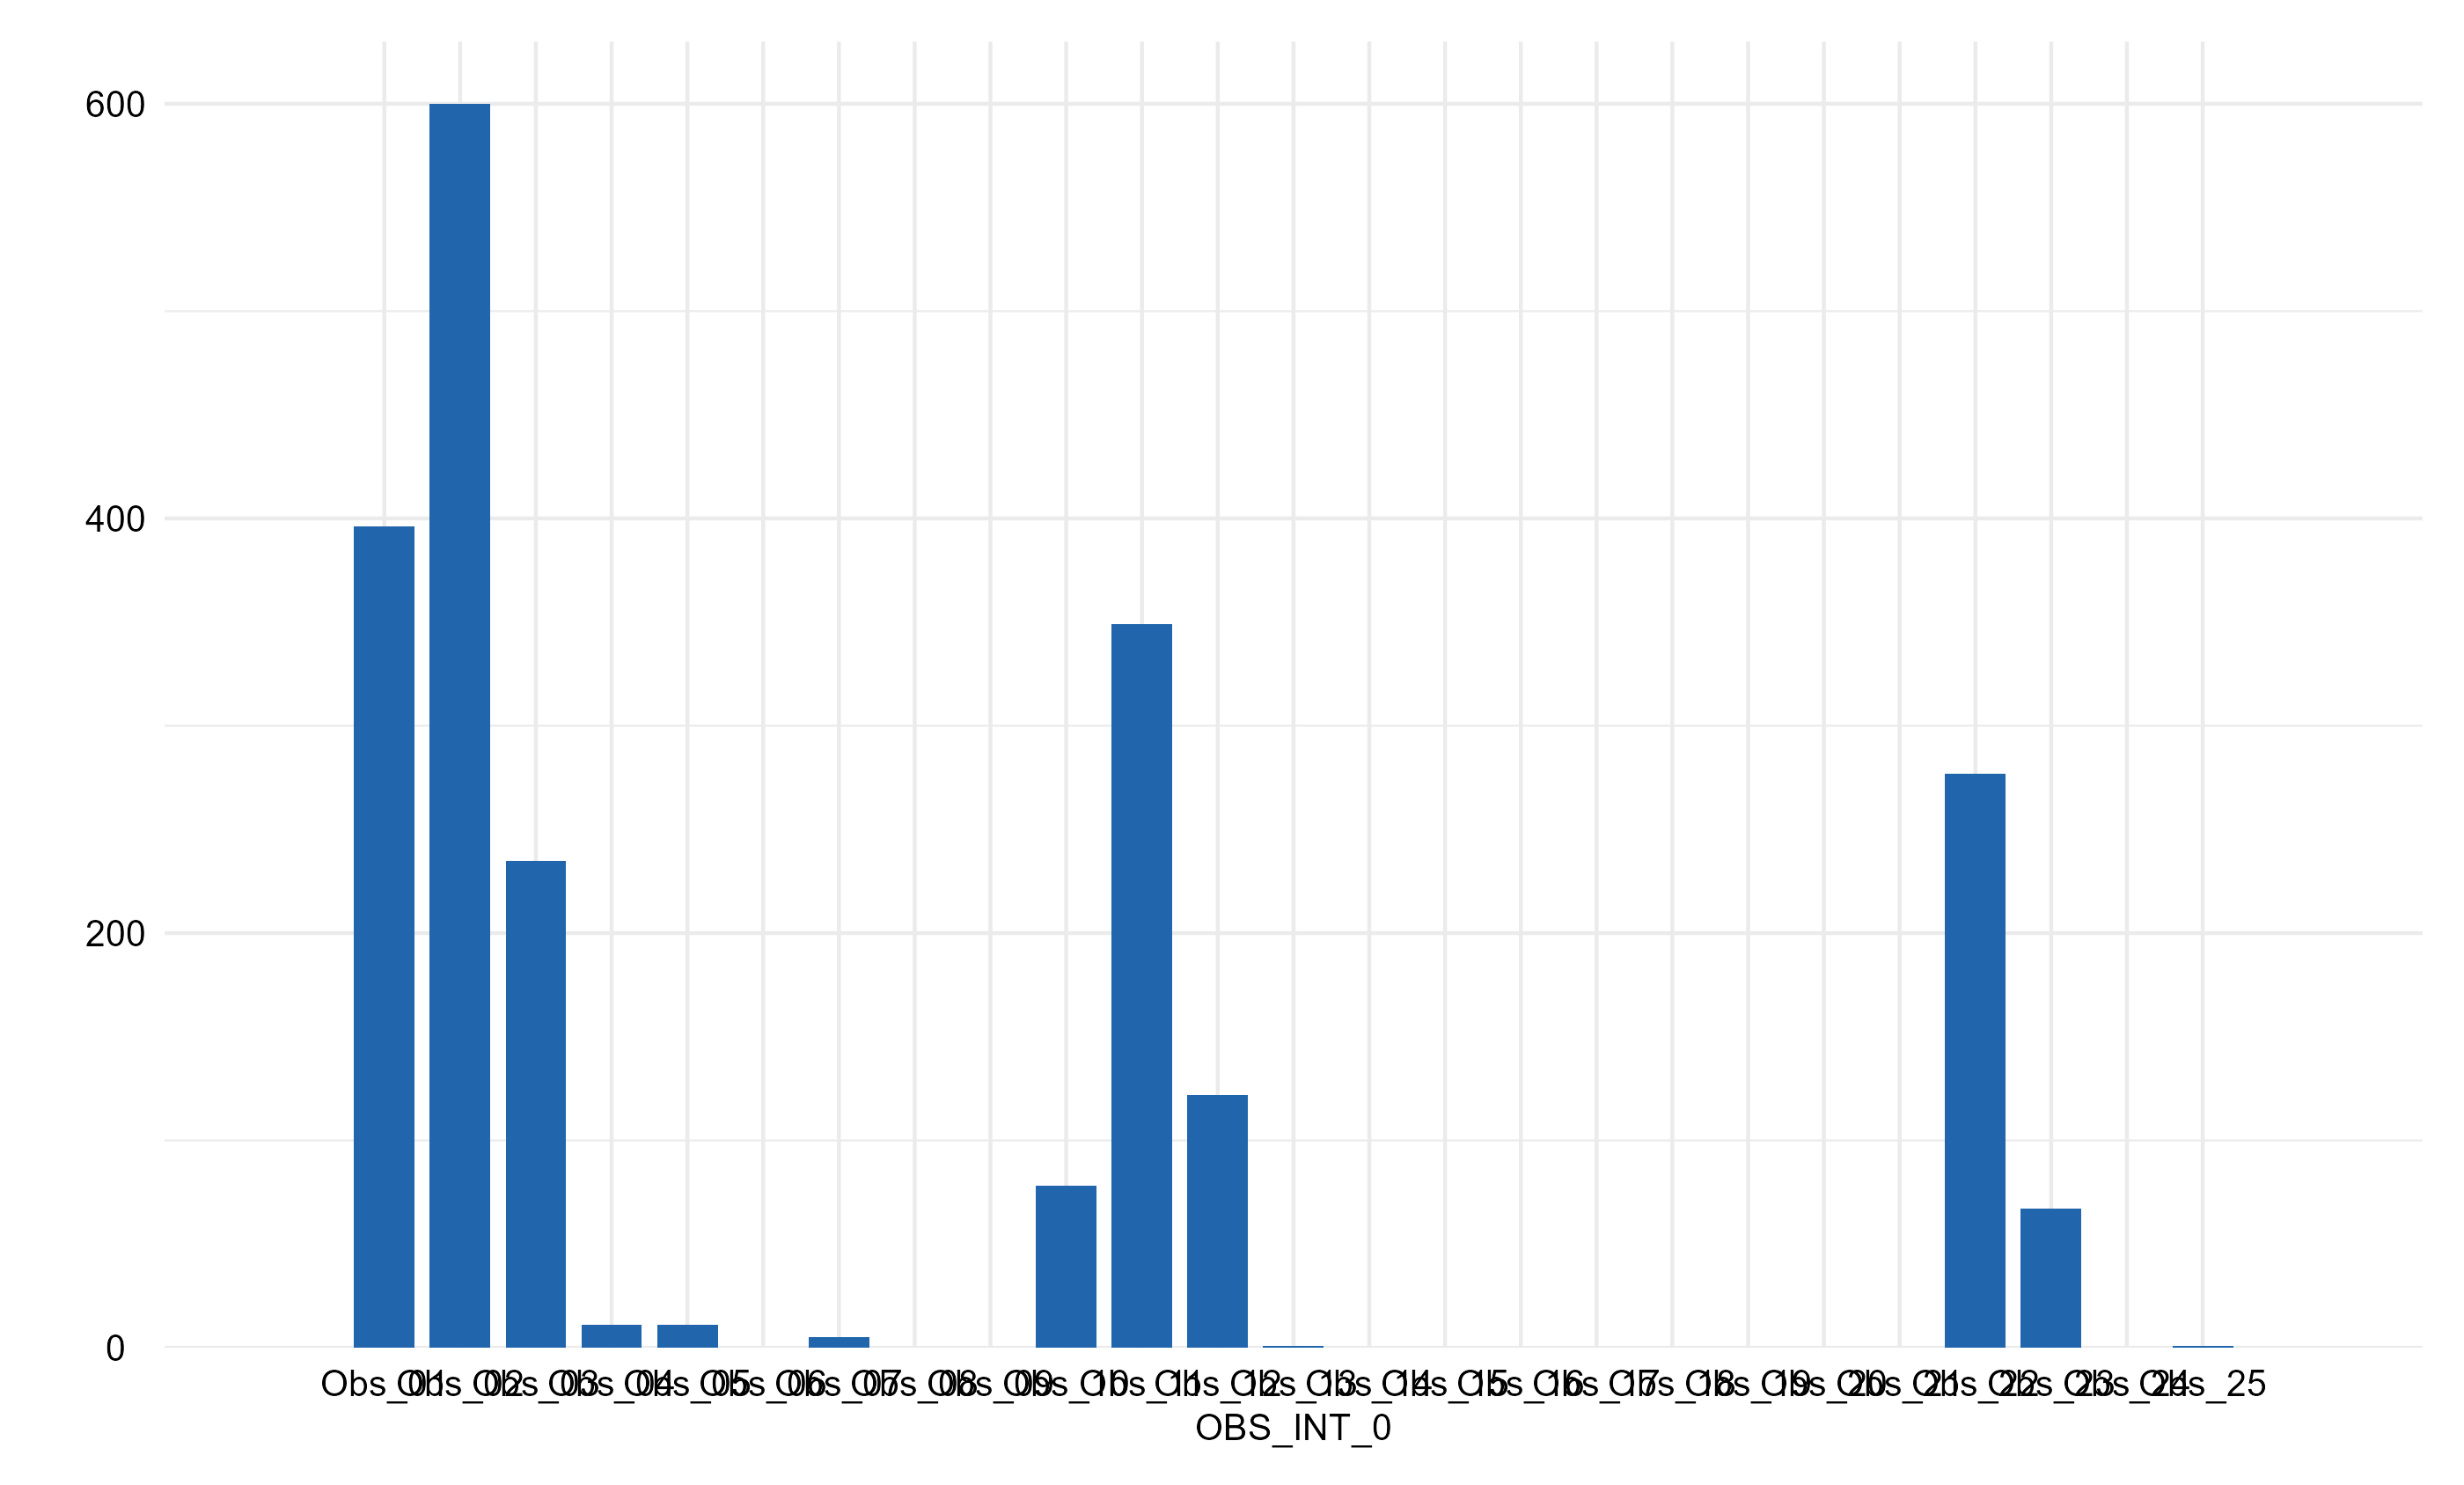
OBS_INT_0
obs_int
Interview examiner
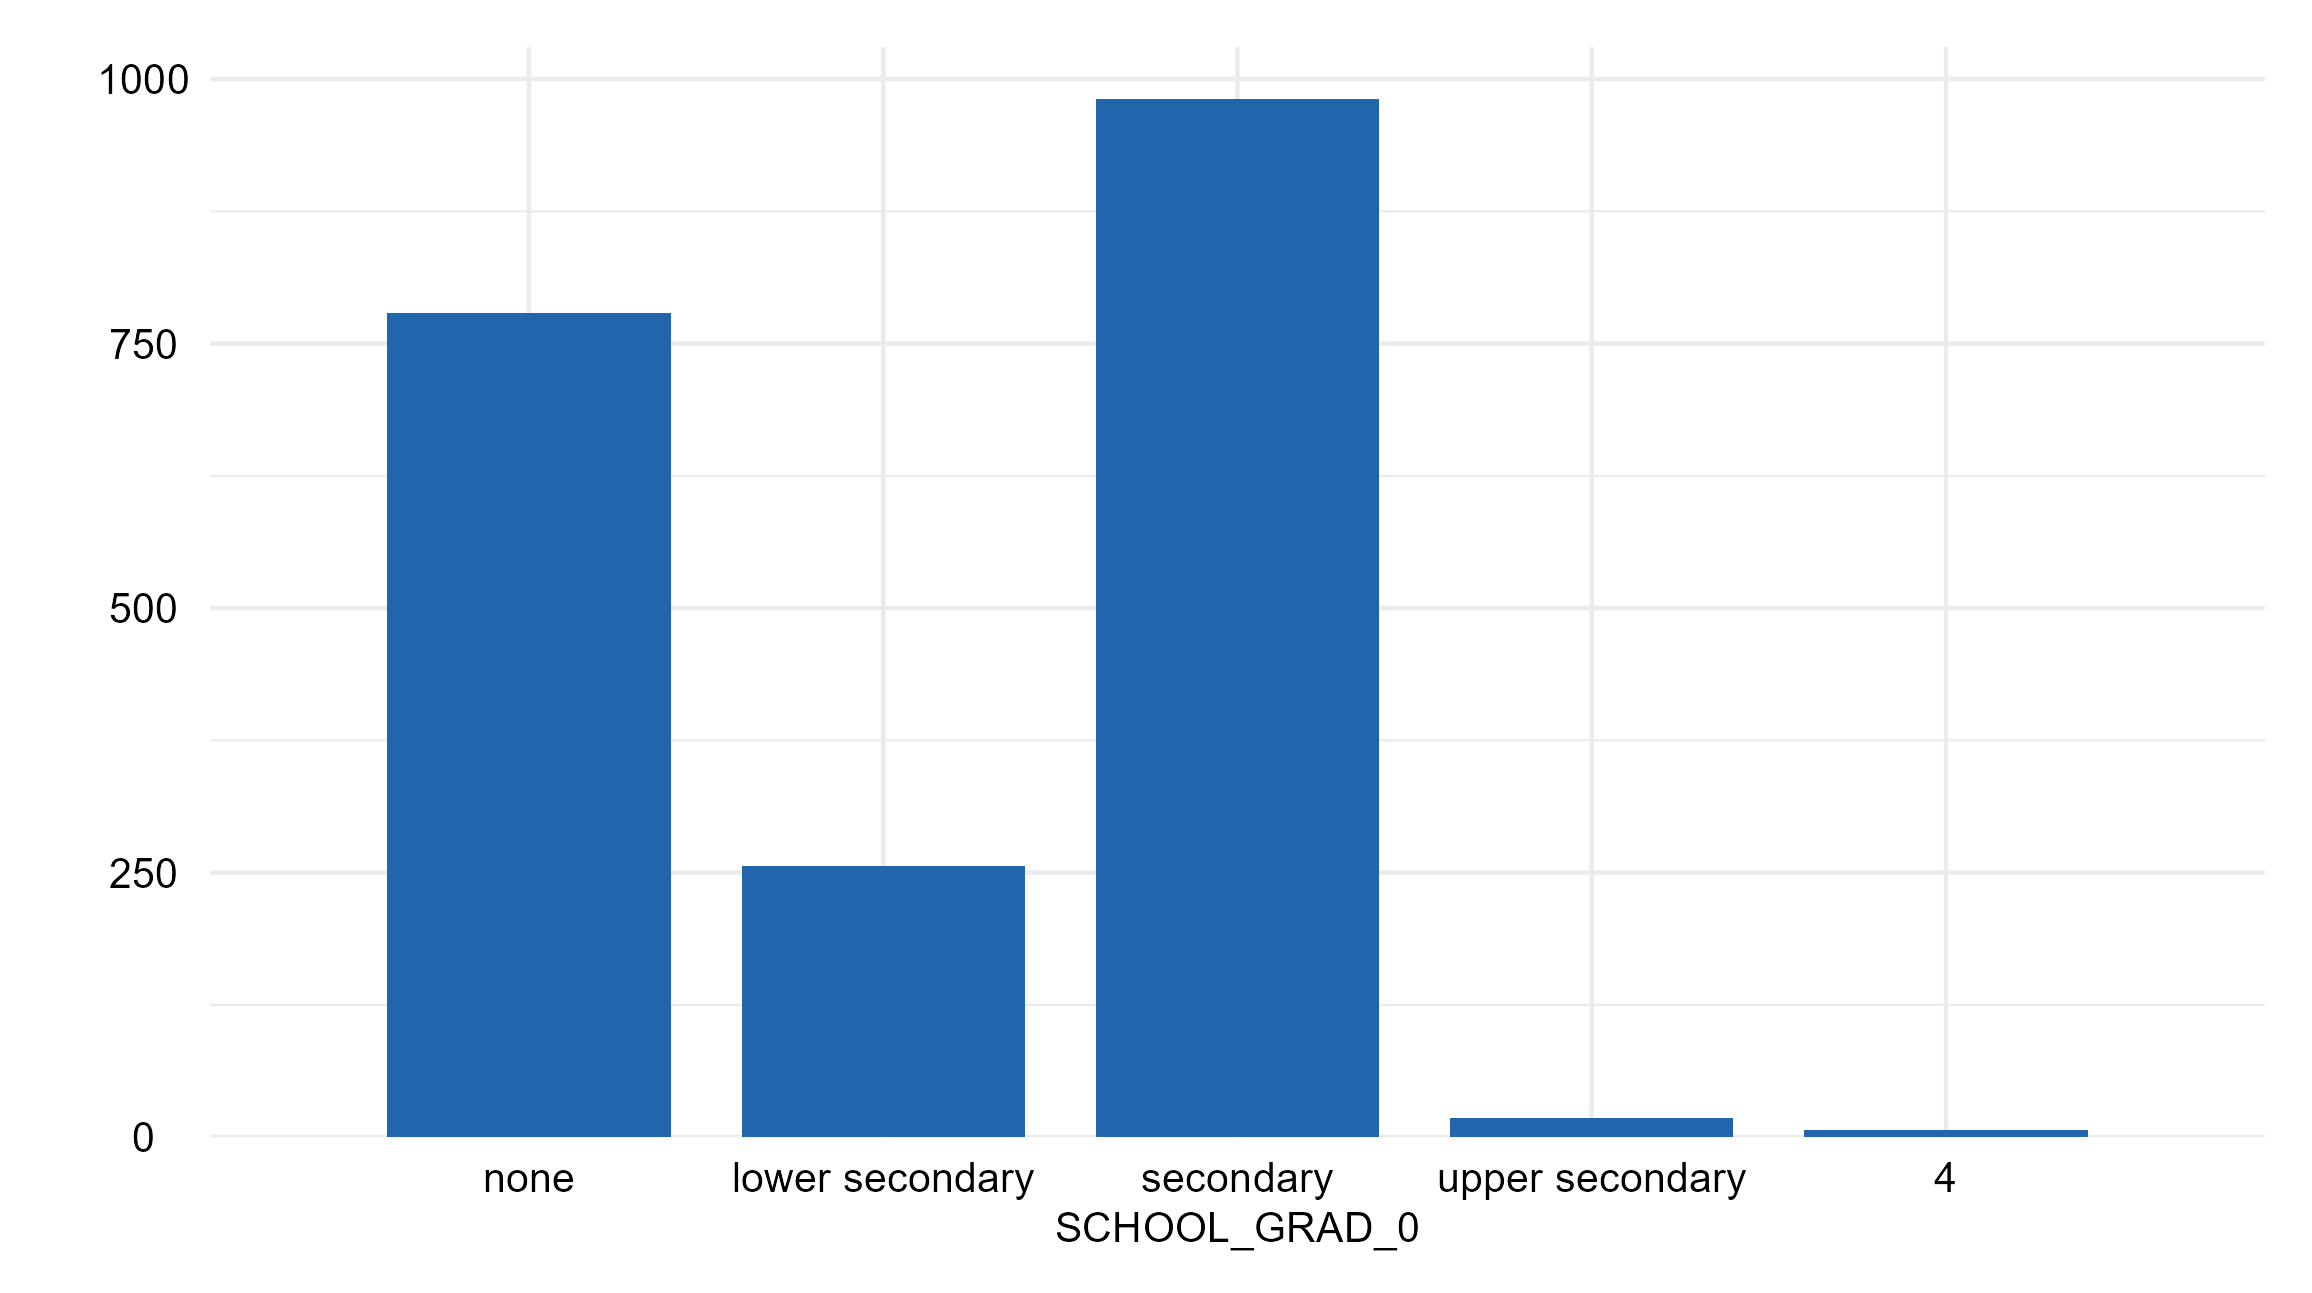
SCHOOL_GRAD_0
school
Highest educational level
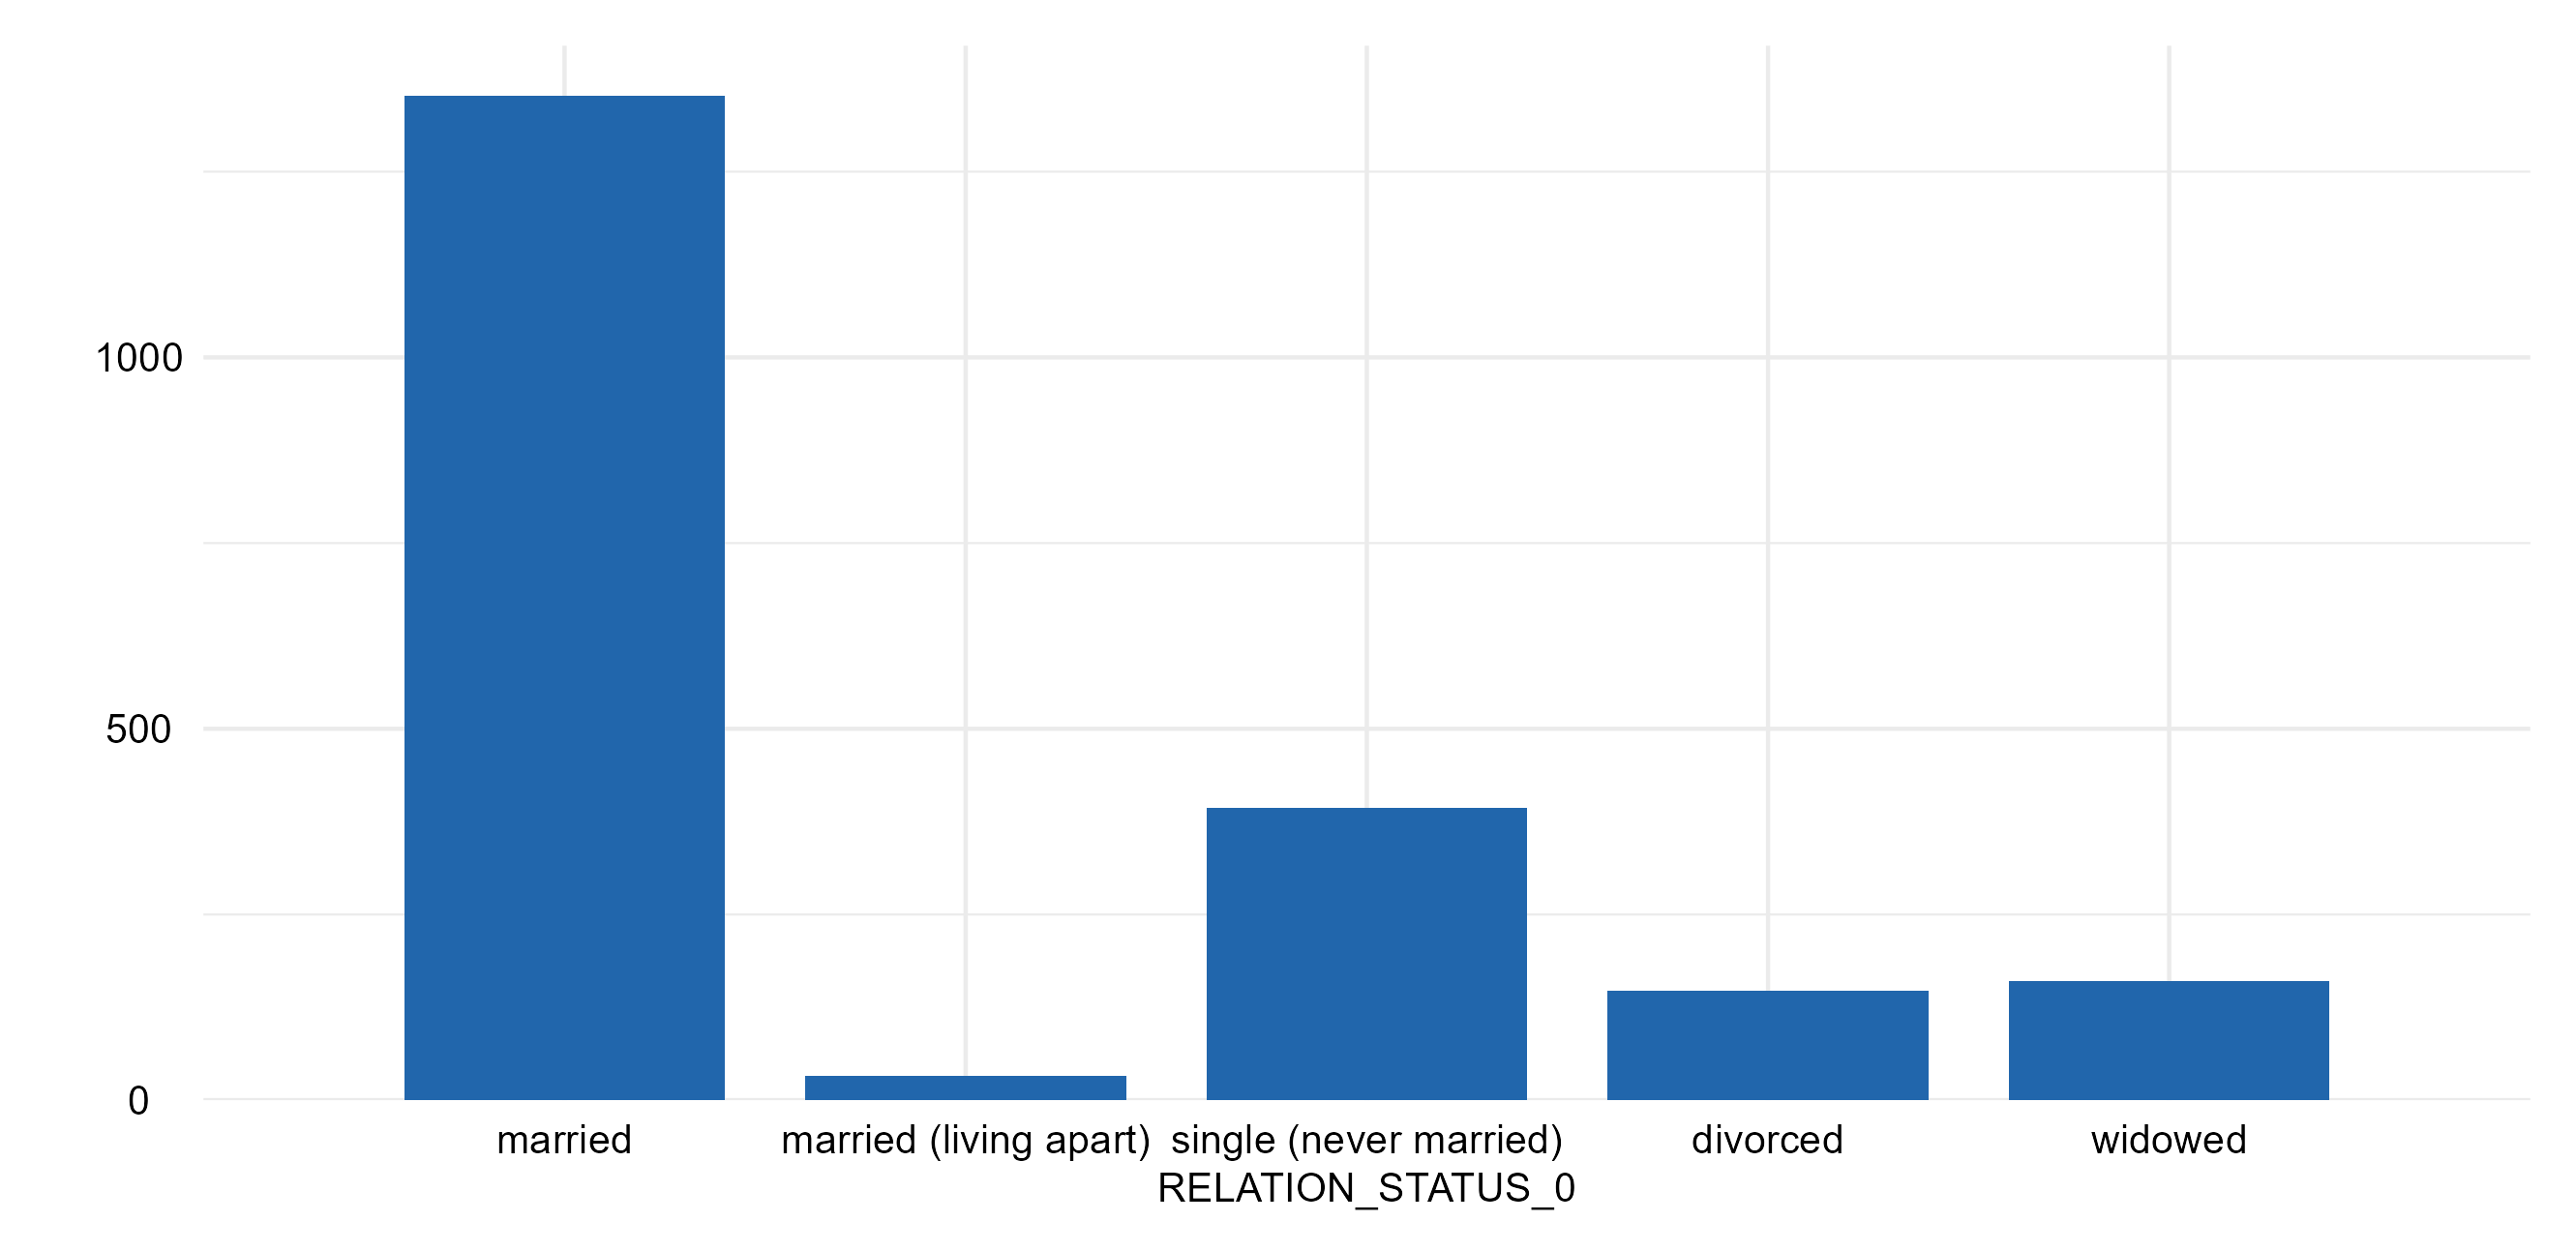
RELATION_STATUS_0
family
Marital status
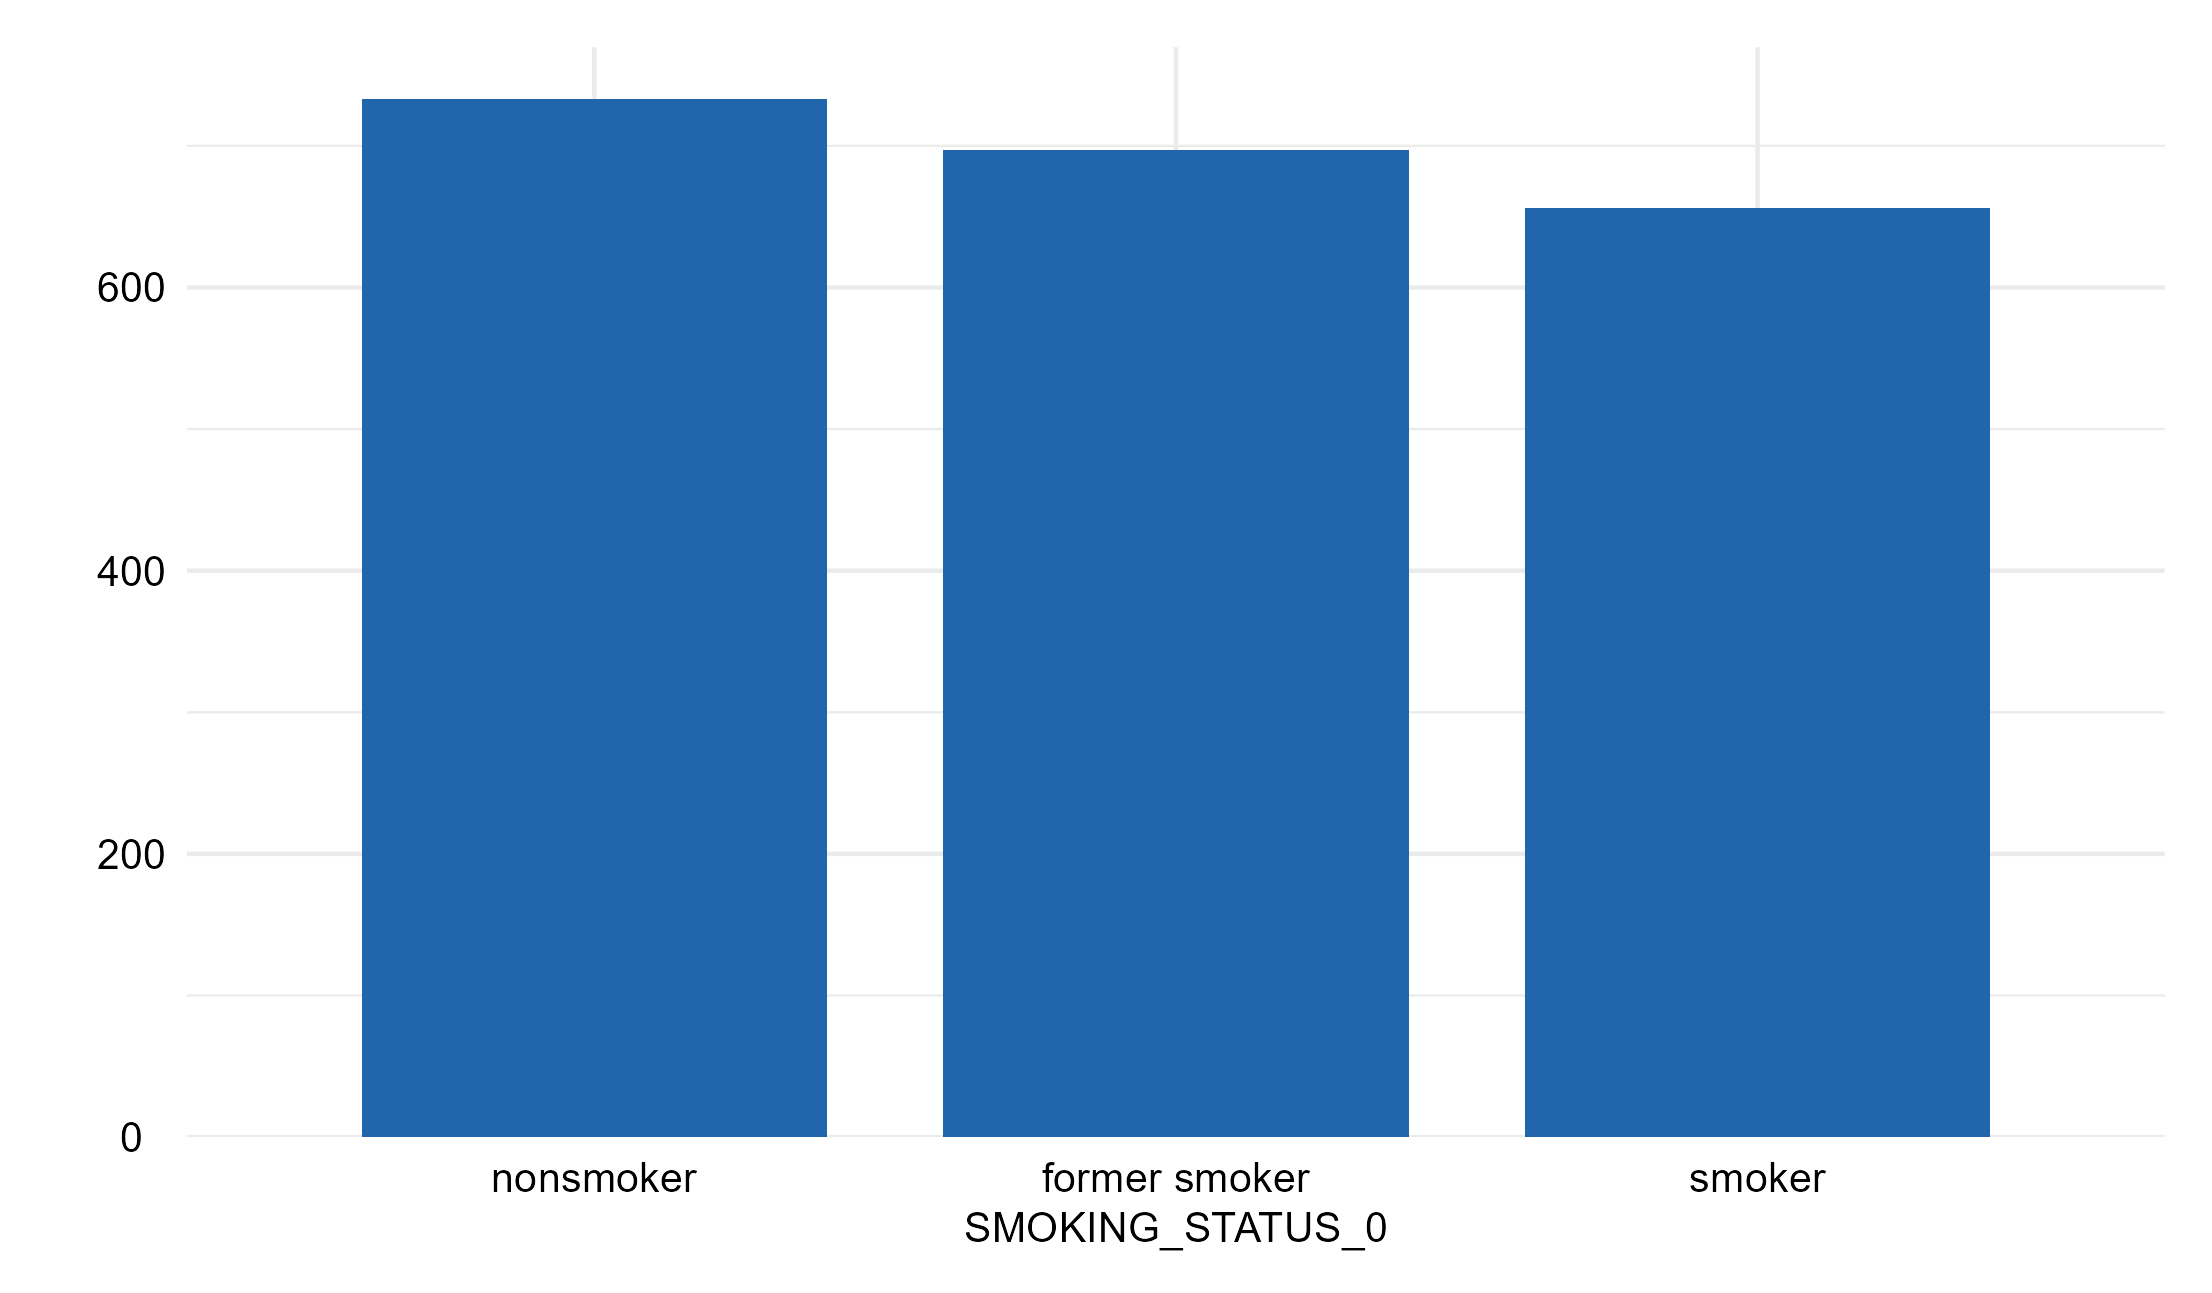
SMOKING_STATUS_0
smoking
Smoking status
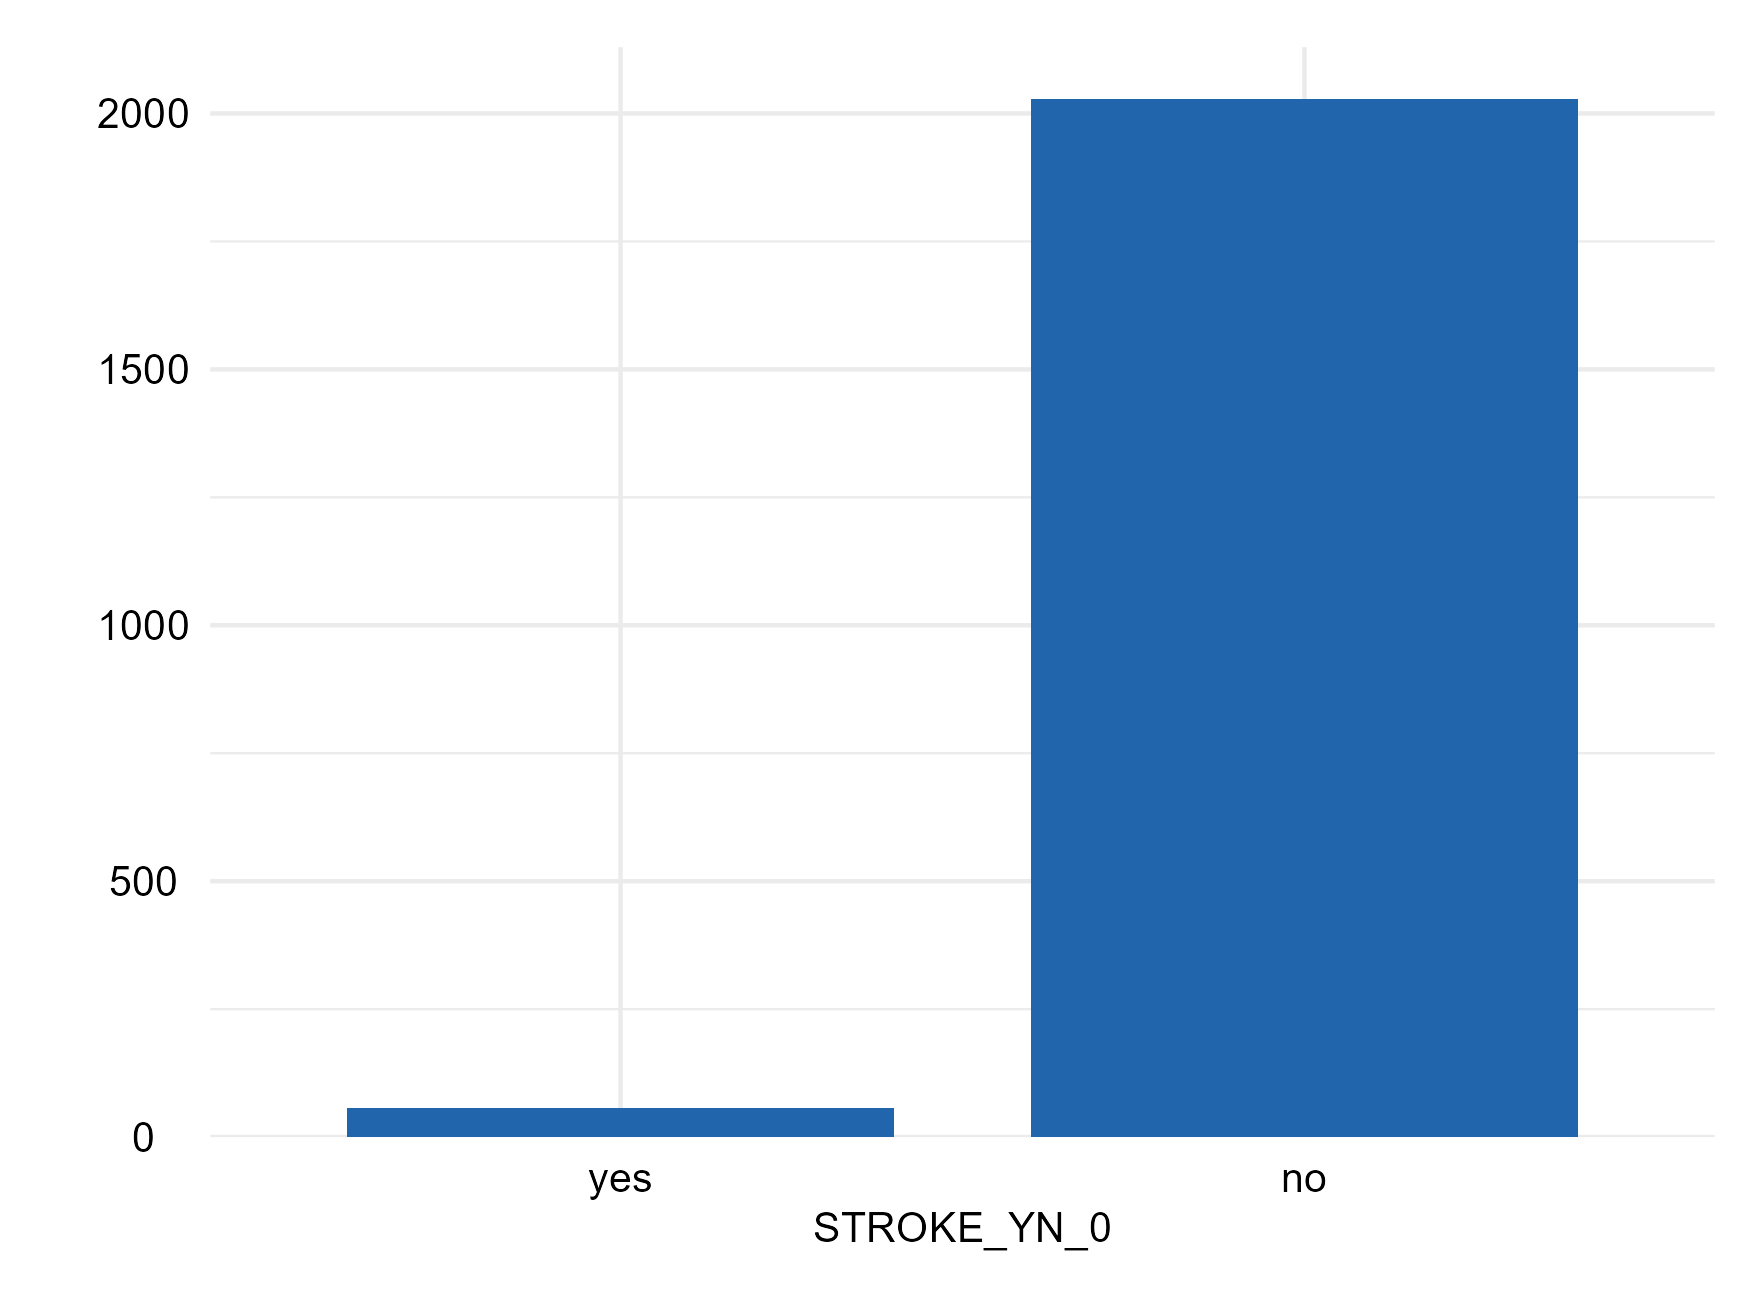
STROKE_YN_0
stroke
Ever had stroke
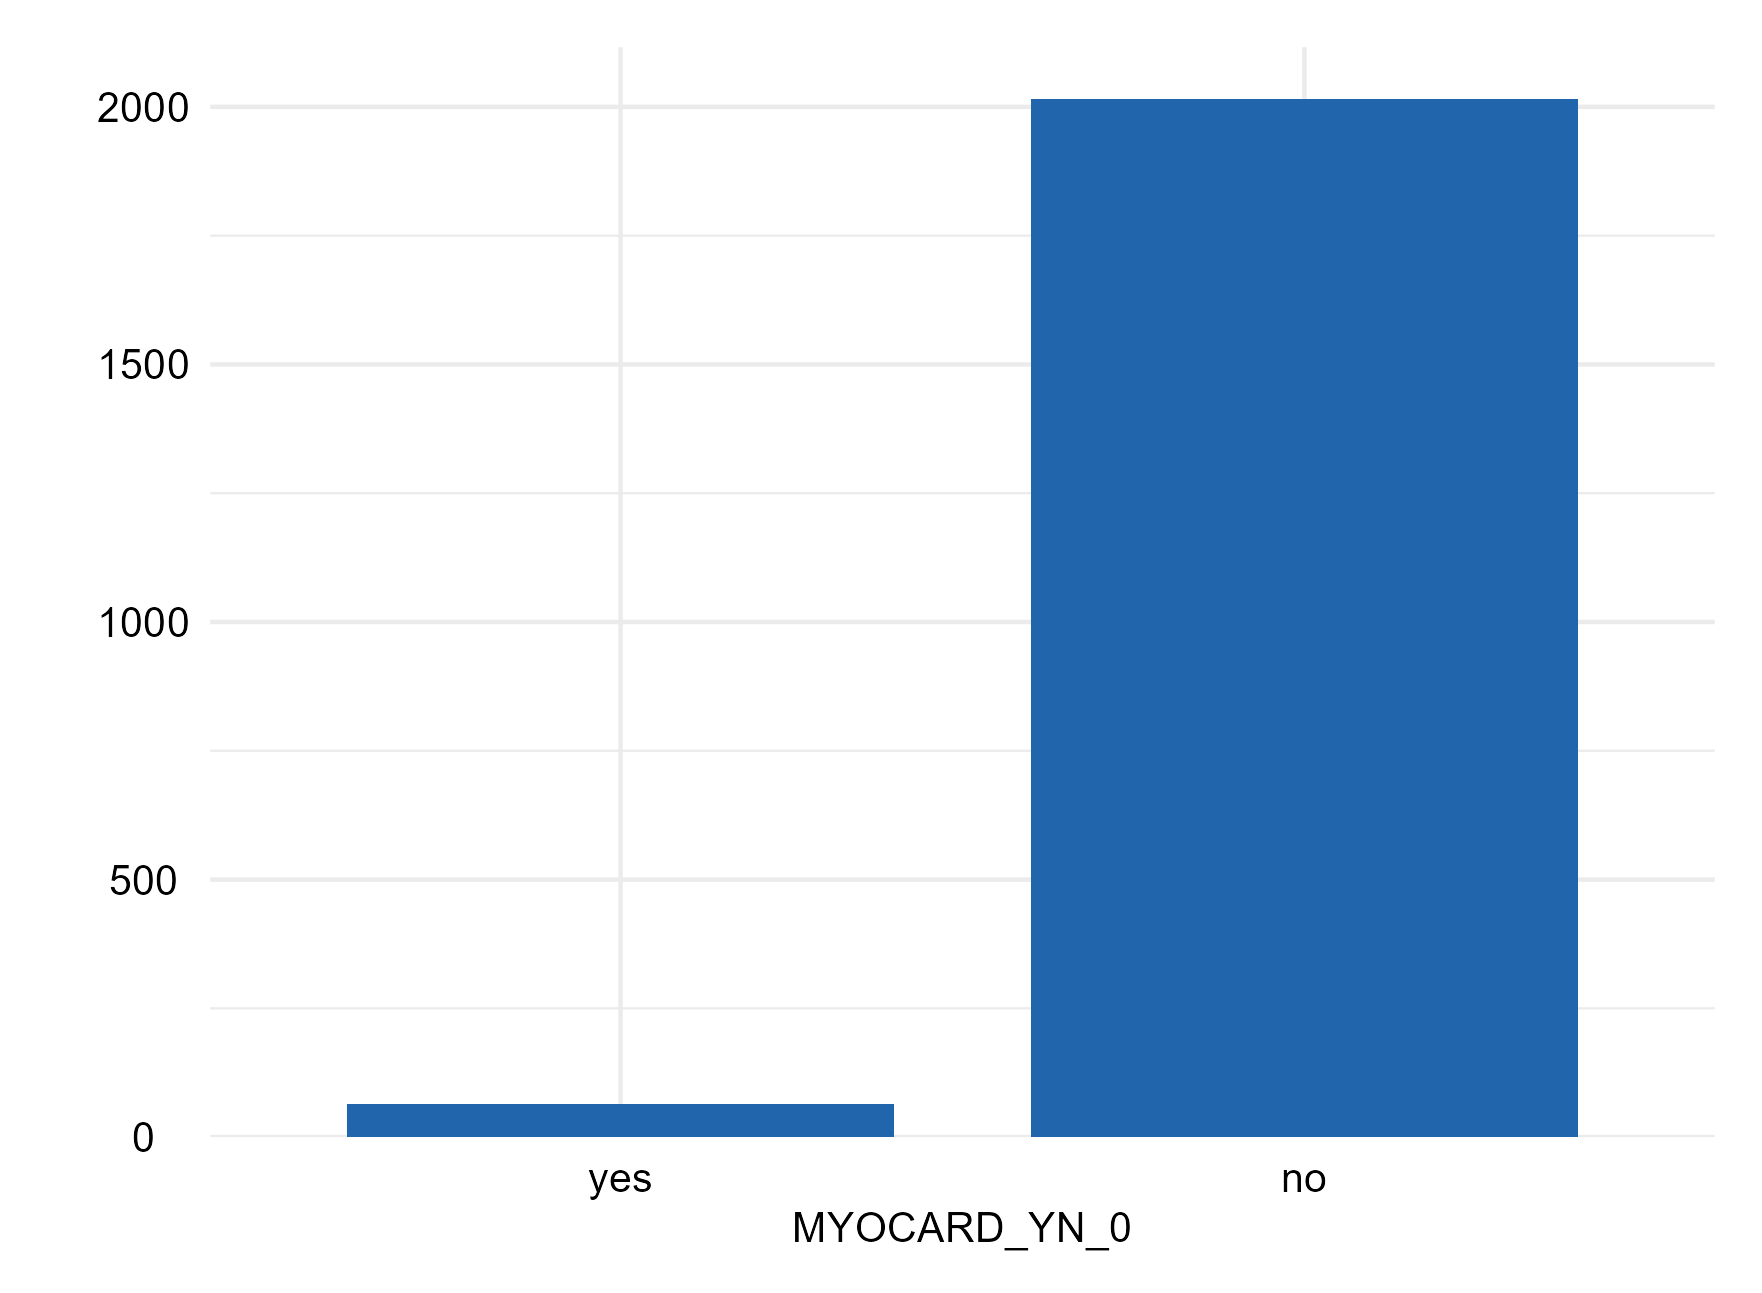
MYOCARD_YN_0
myocard
Ever had myocardial infarction
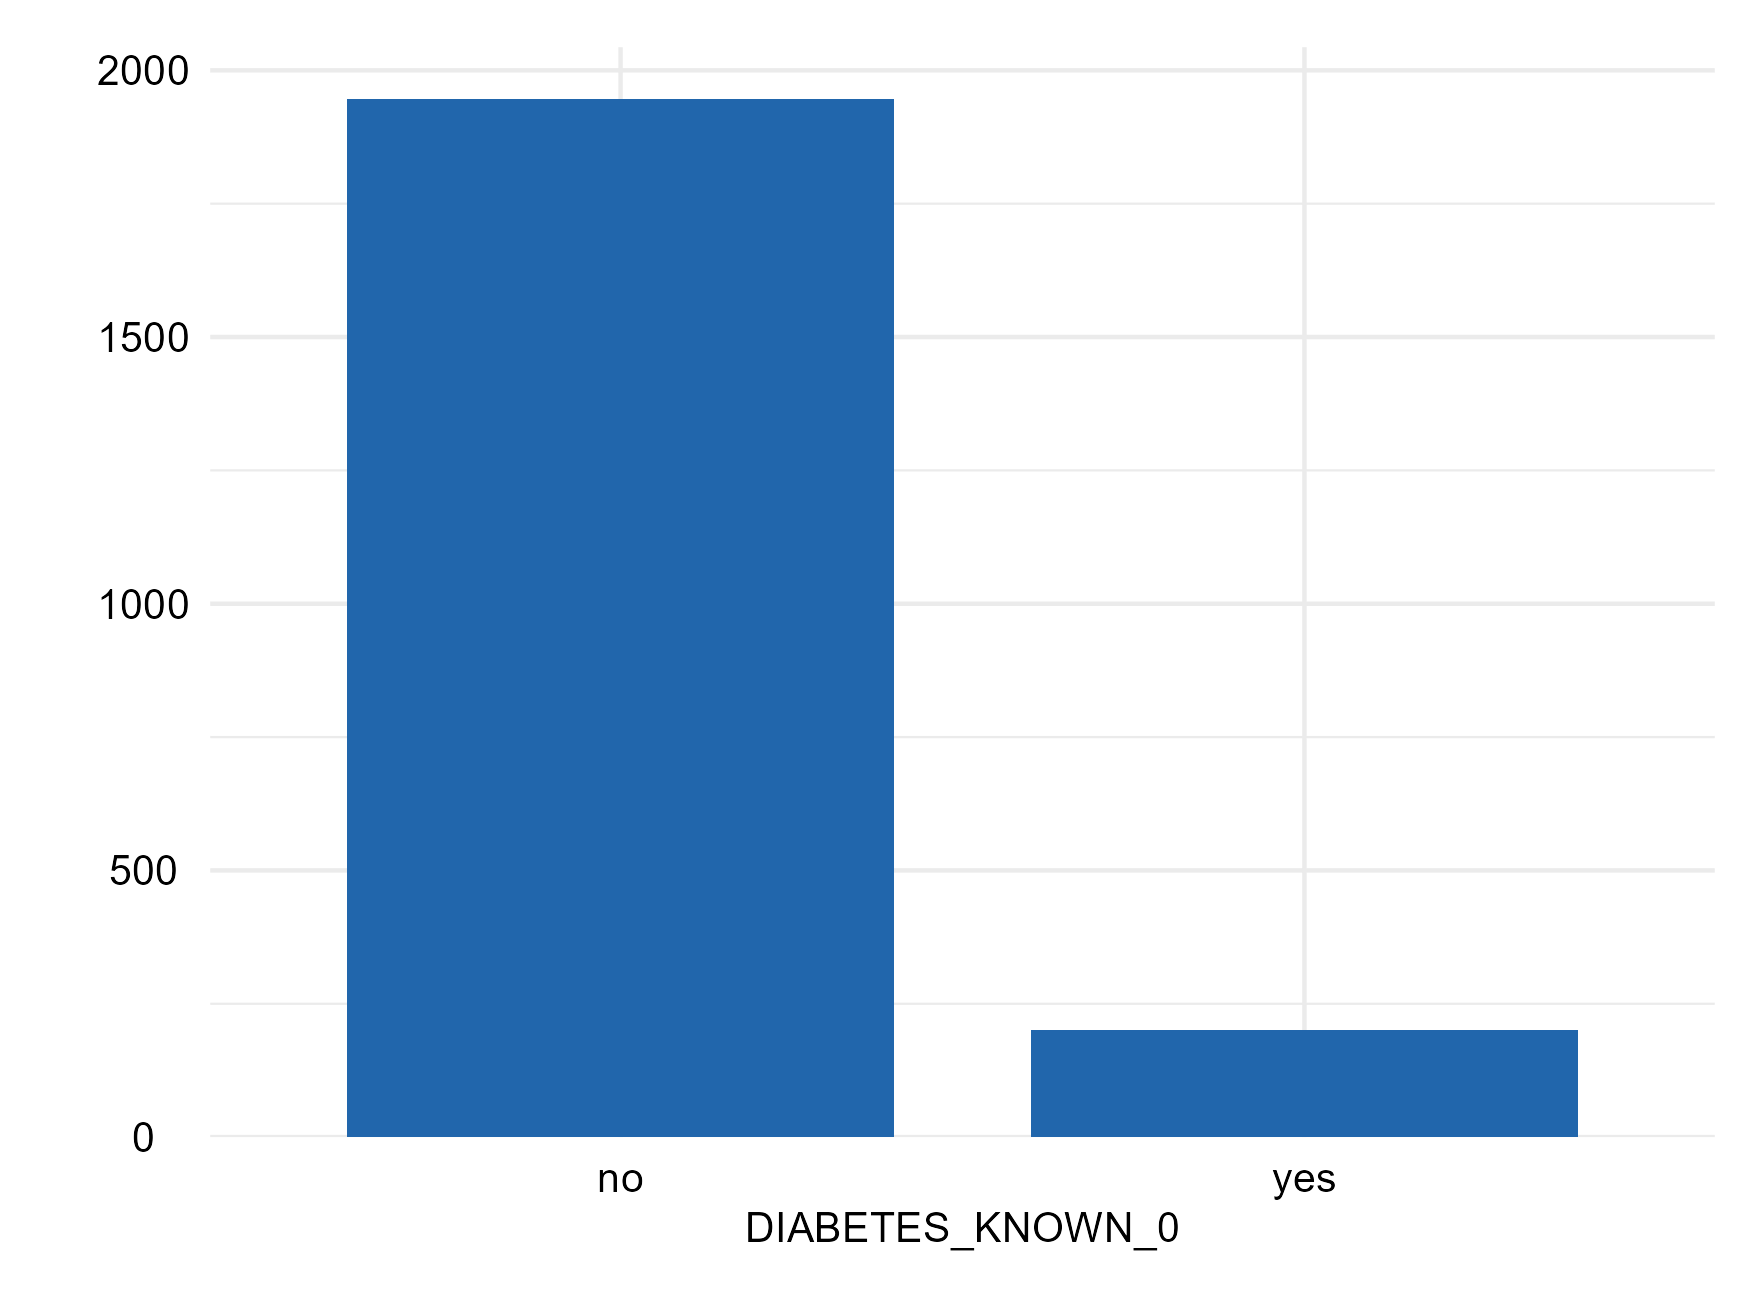
DIABETES_KNOWN_0
diab_known
Known diabetes
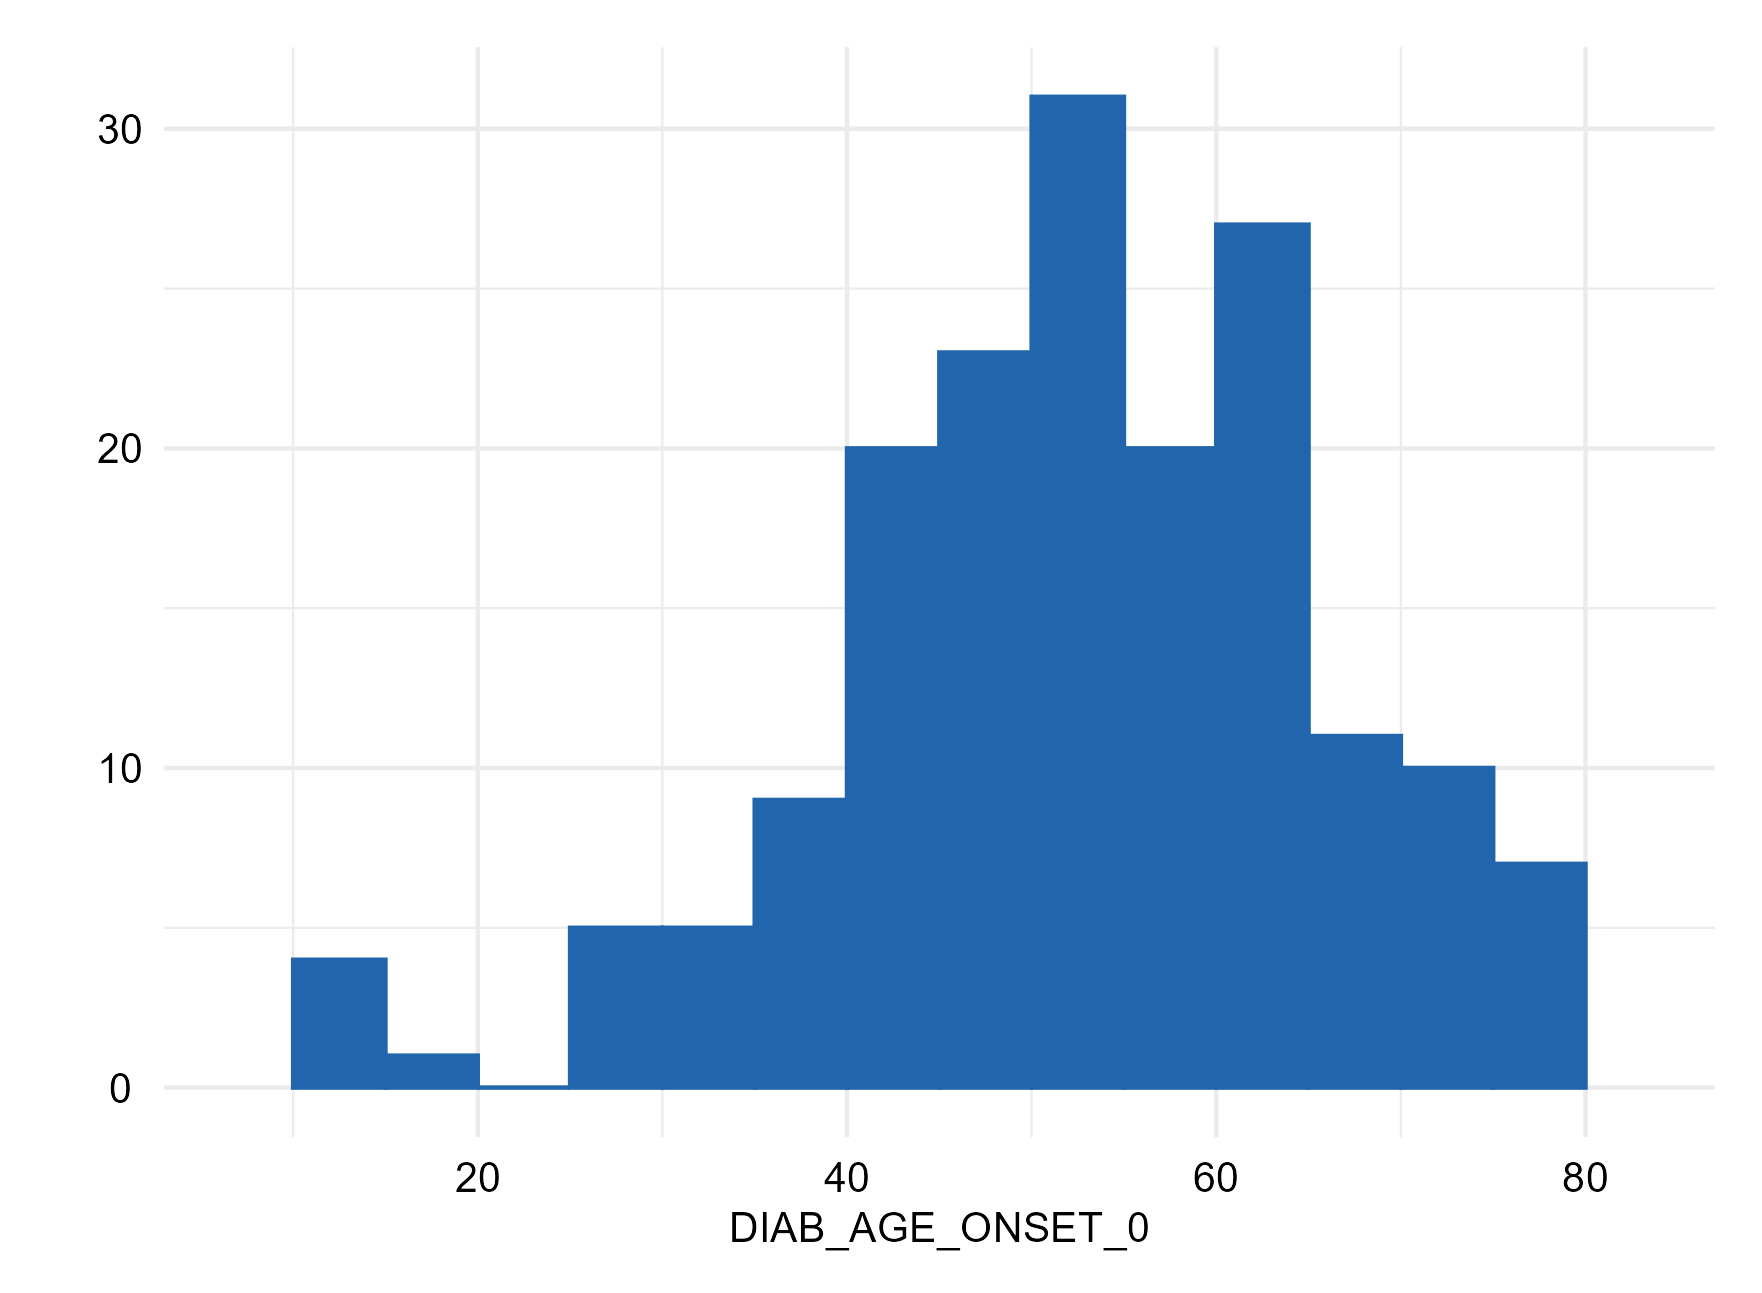
DIAB_AGE_ONSET_0
diab_age
Age of diabetes onset
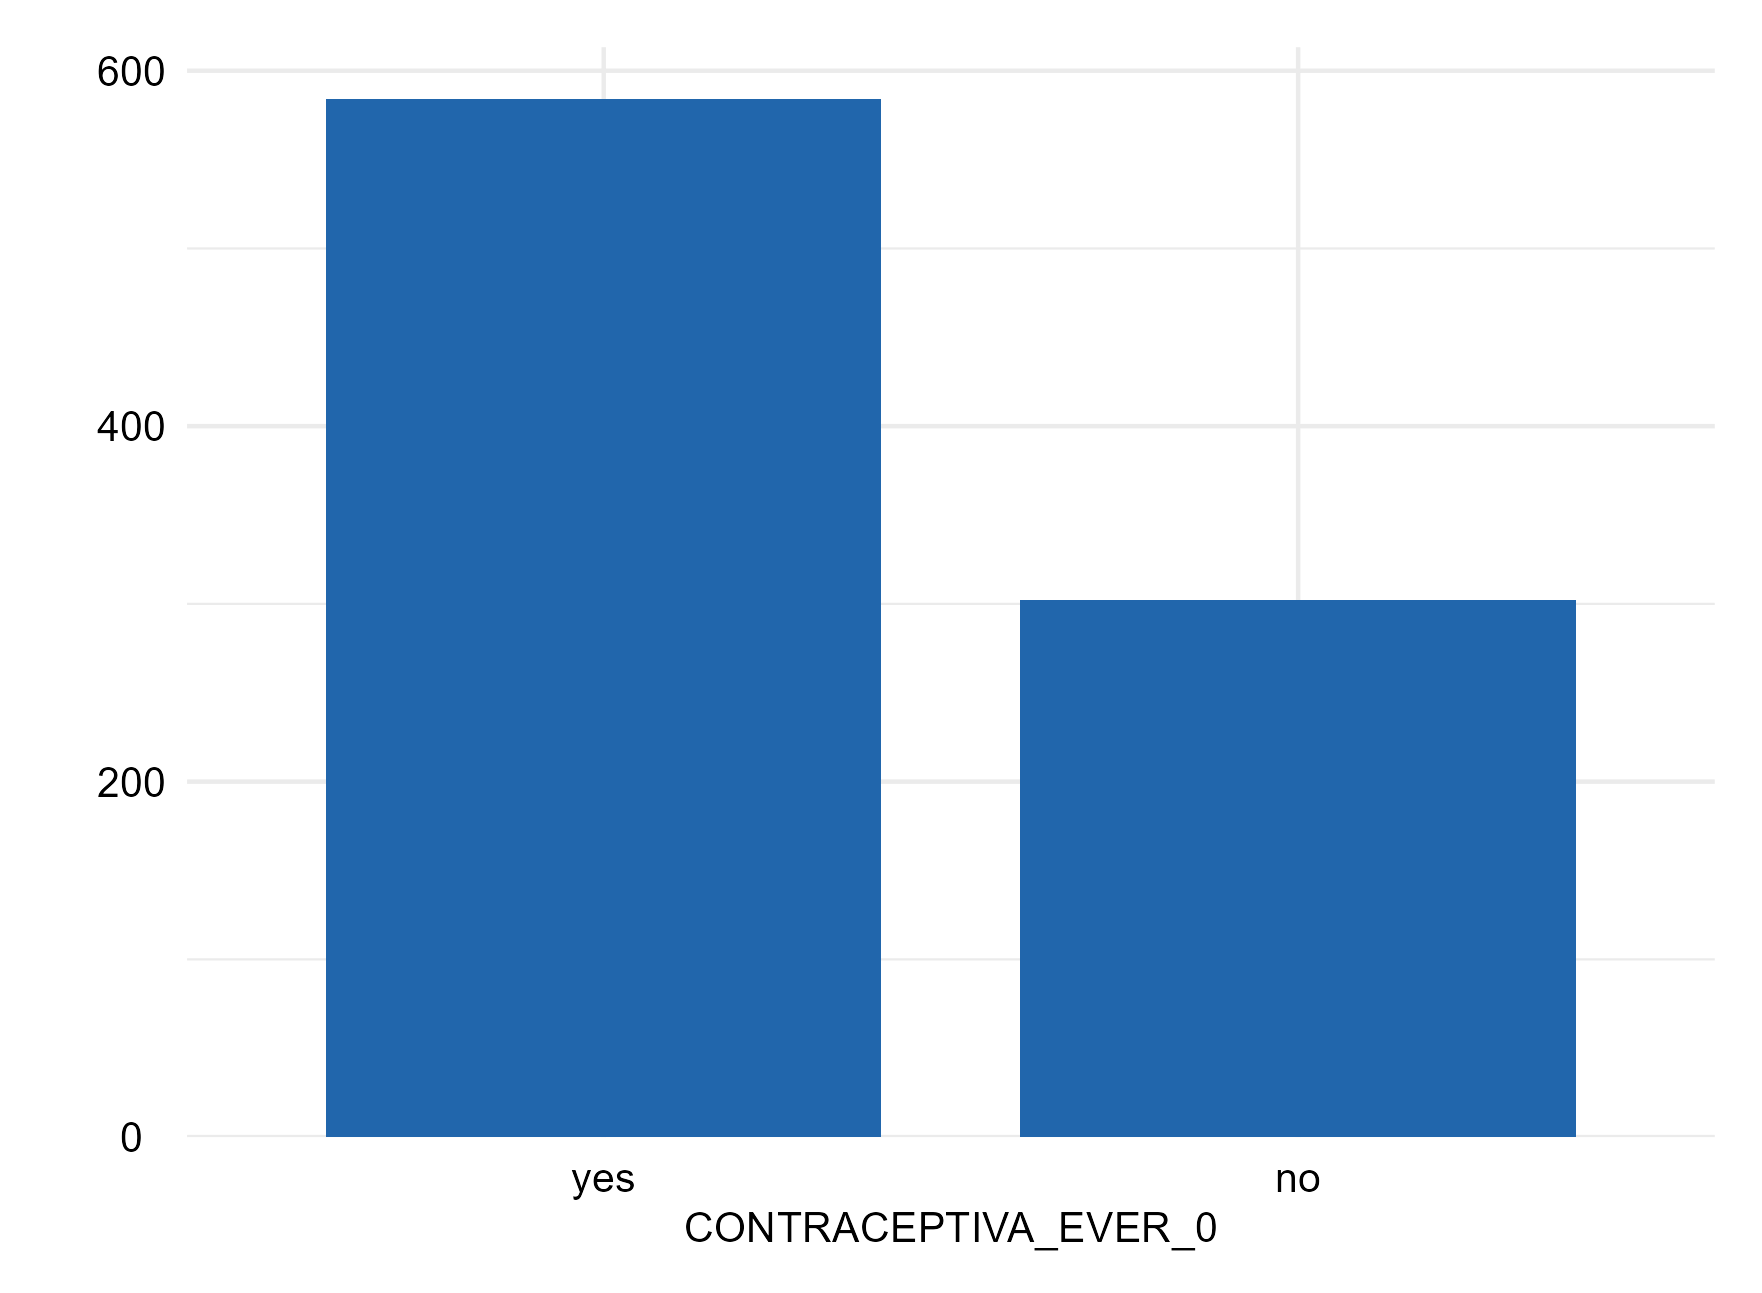
CONTRACEPTIVA_EVER_0
contraception
Ever taken birth control pills
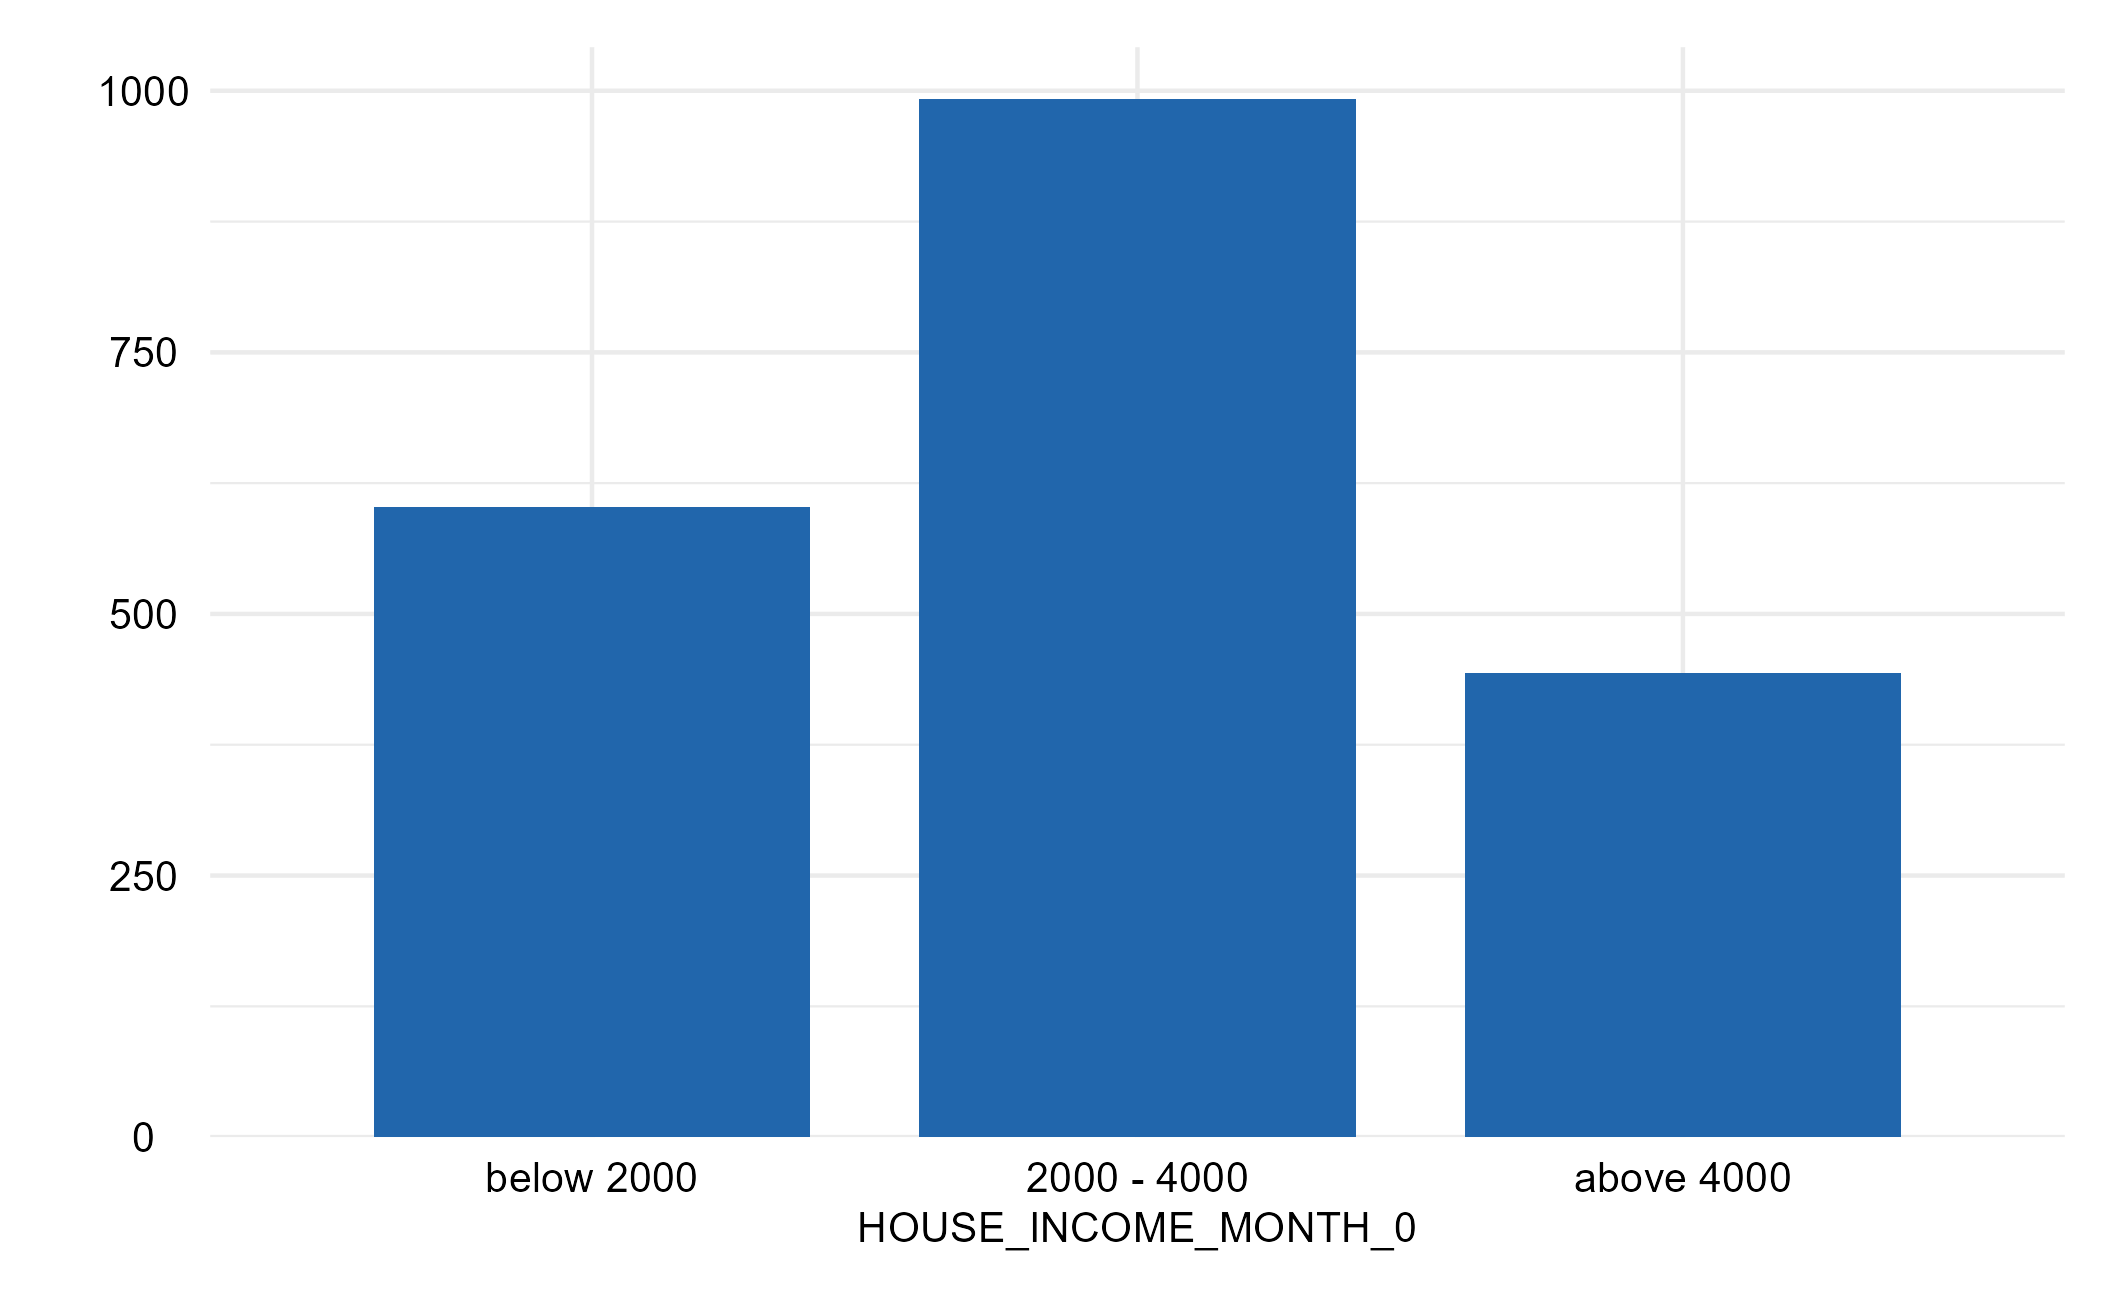
HOUSE_INCOME_MONTH_0
income
Monthly household income
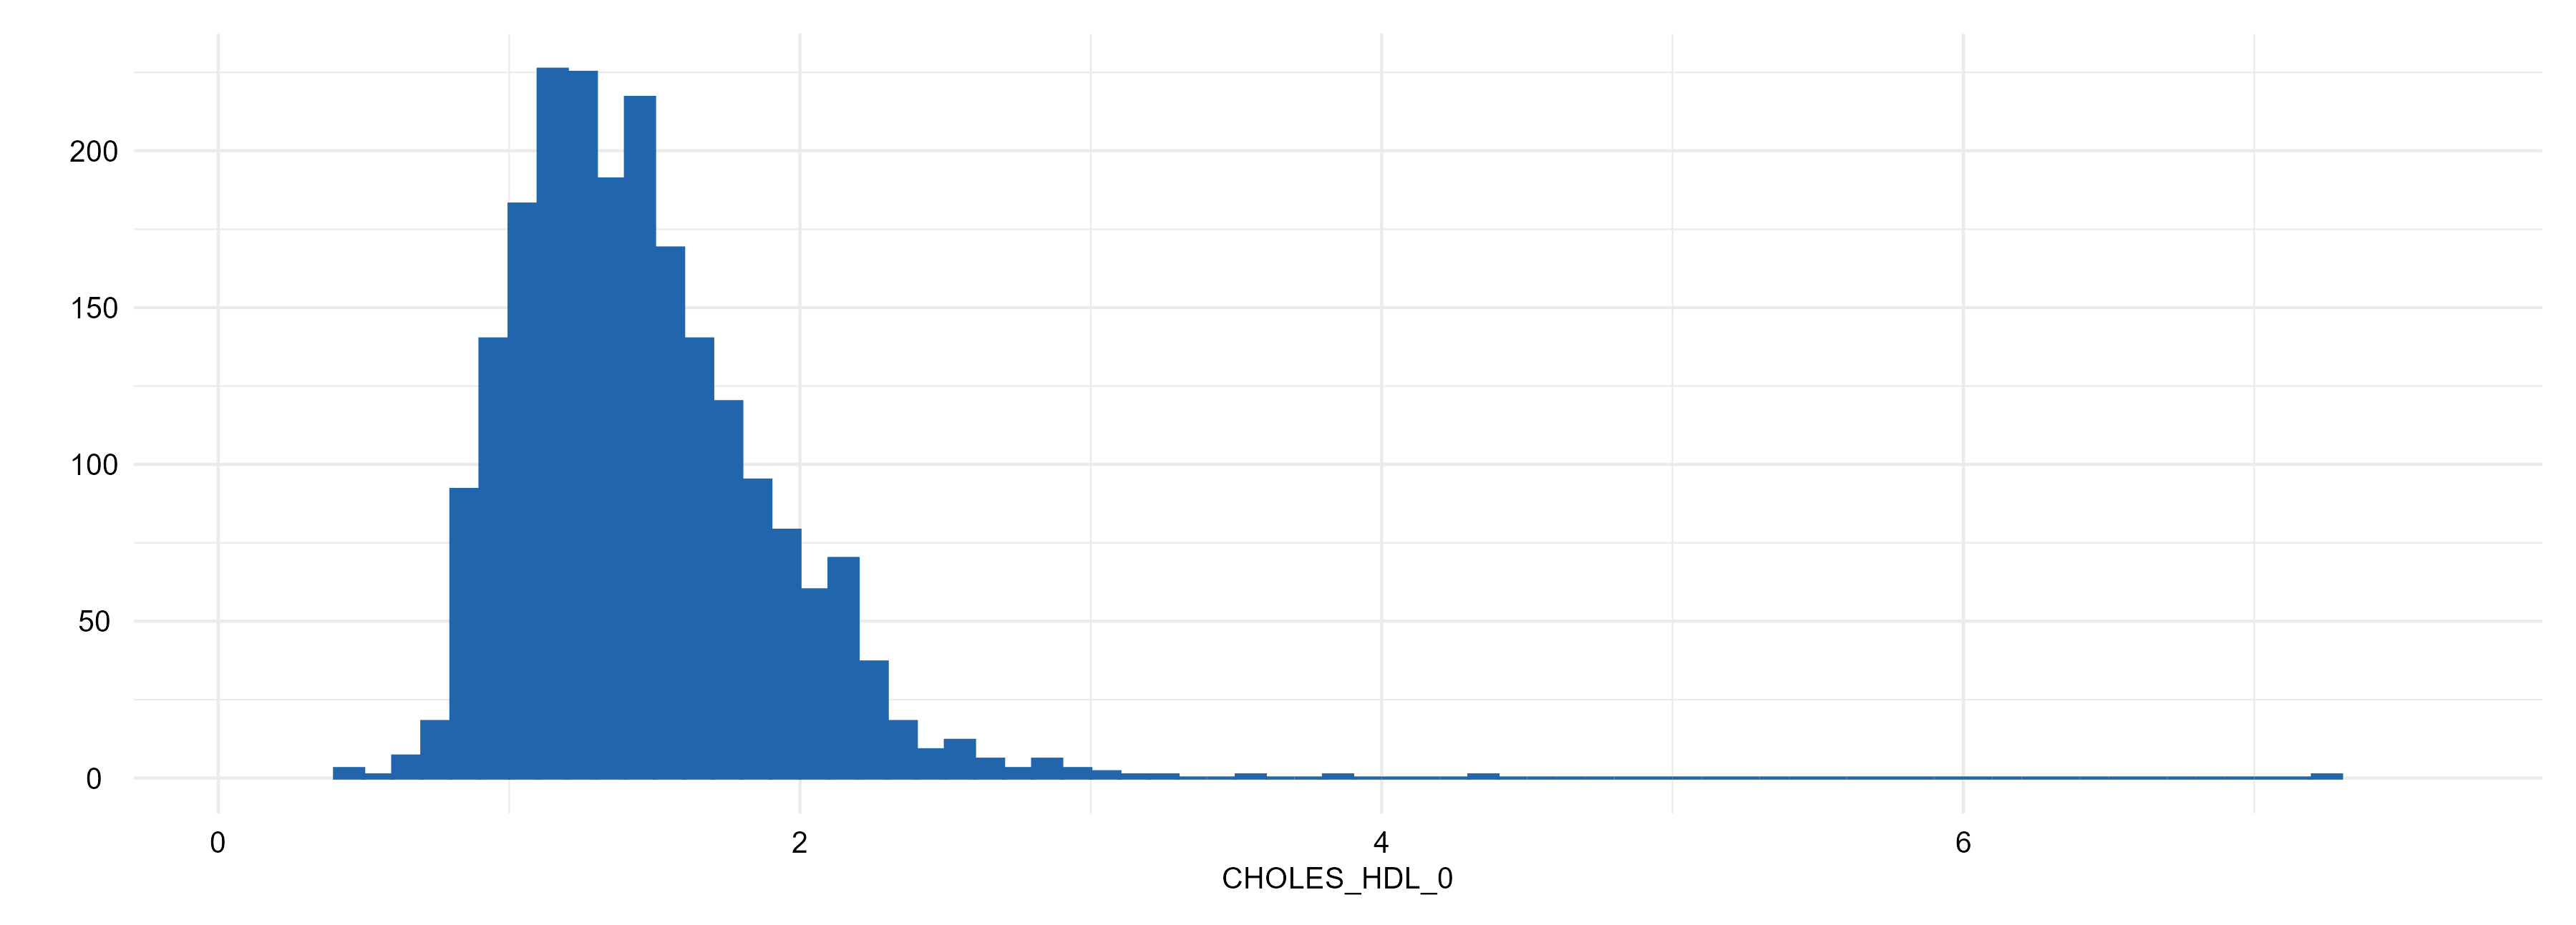
CHOLES_HDL_0
hdl
HDL-cholesterol
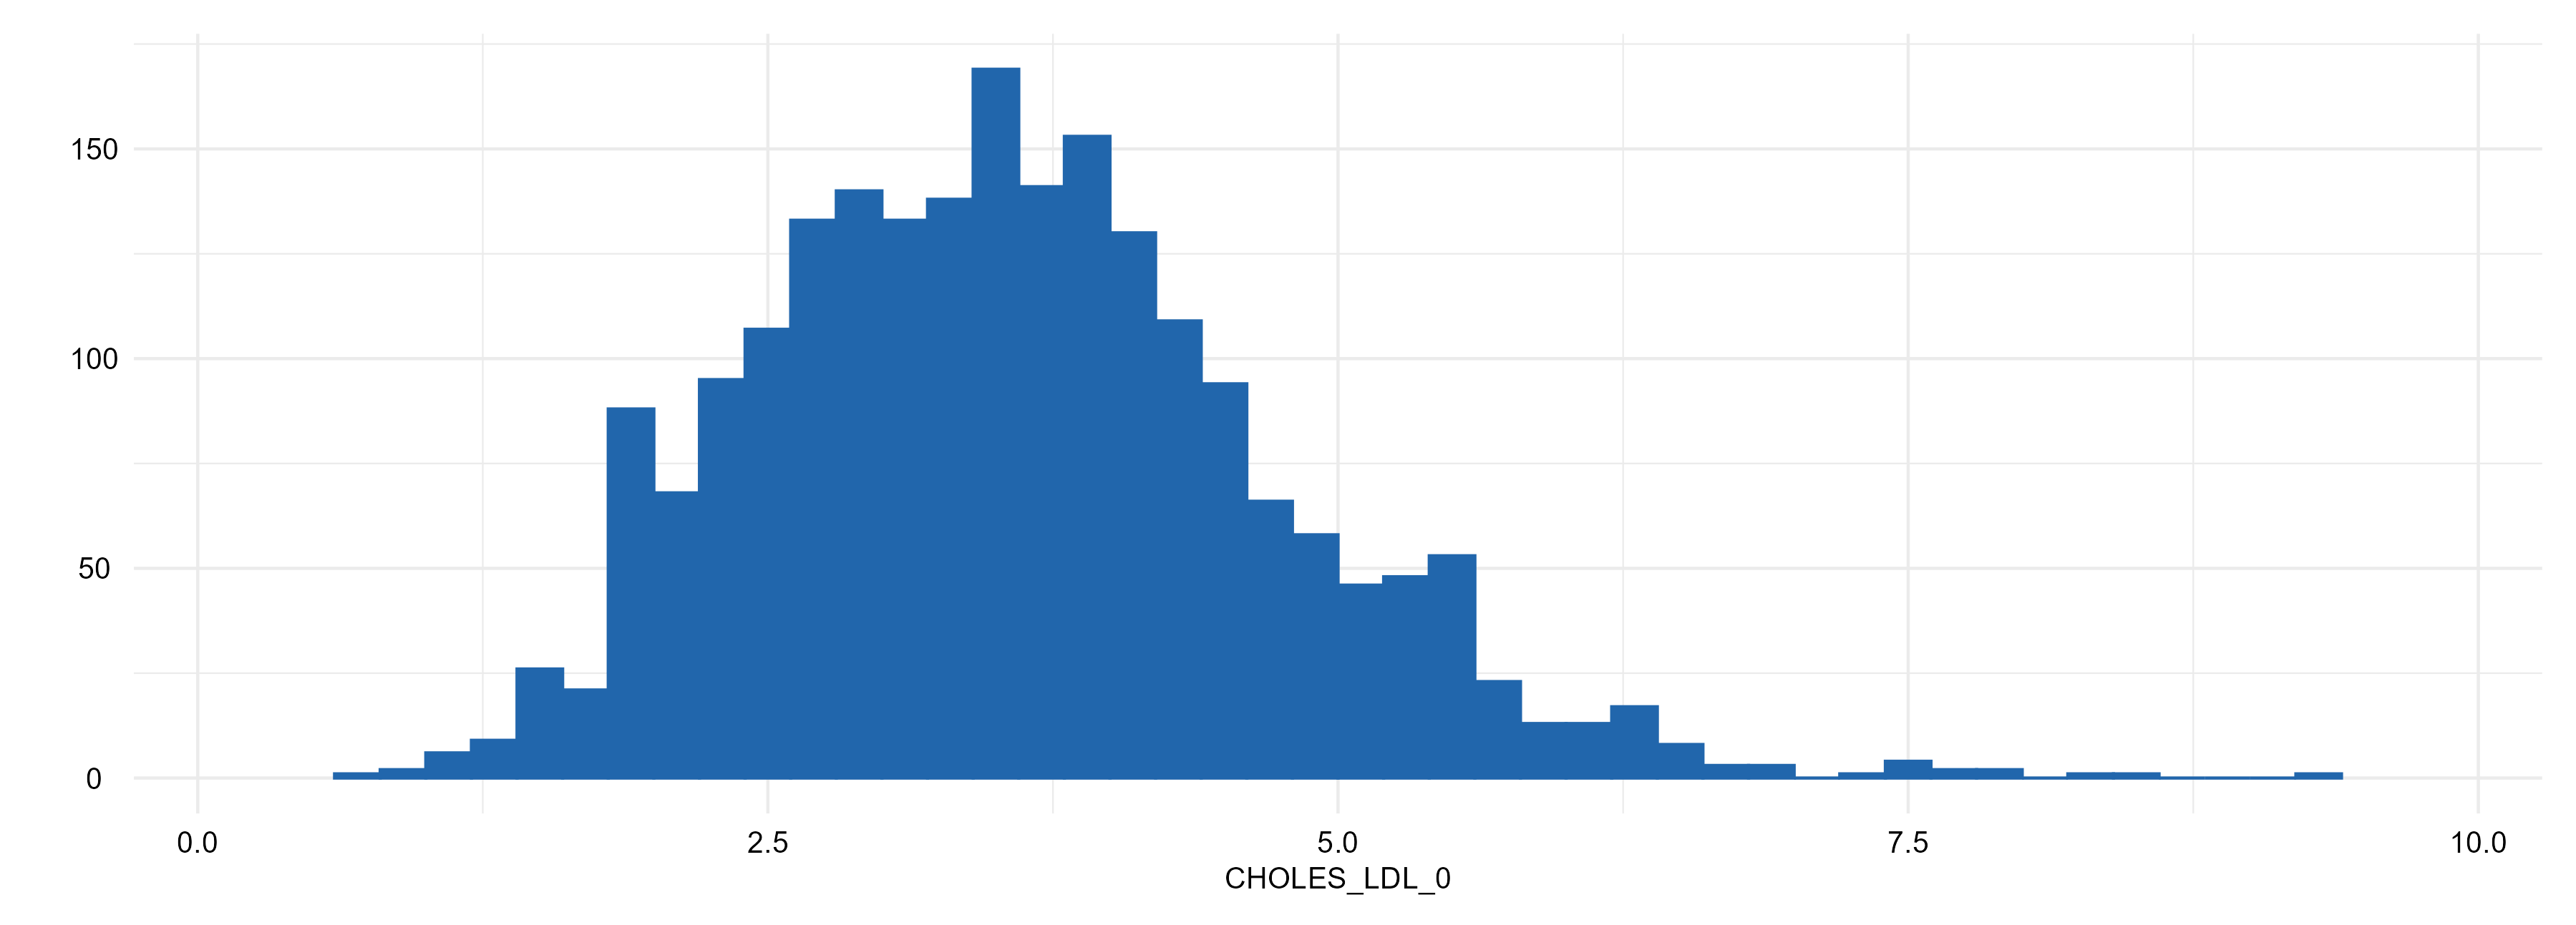
CHOLES_LDL_0
ldl
LDL-cholesterol
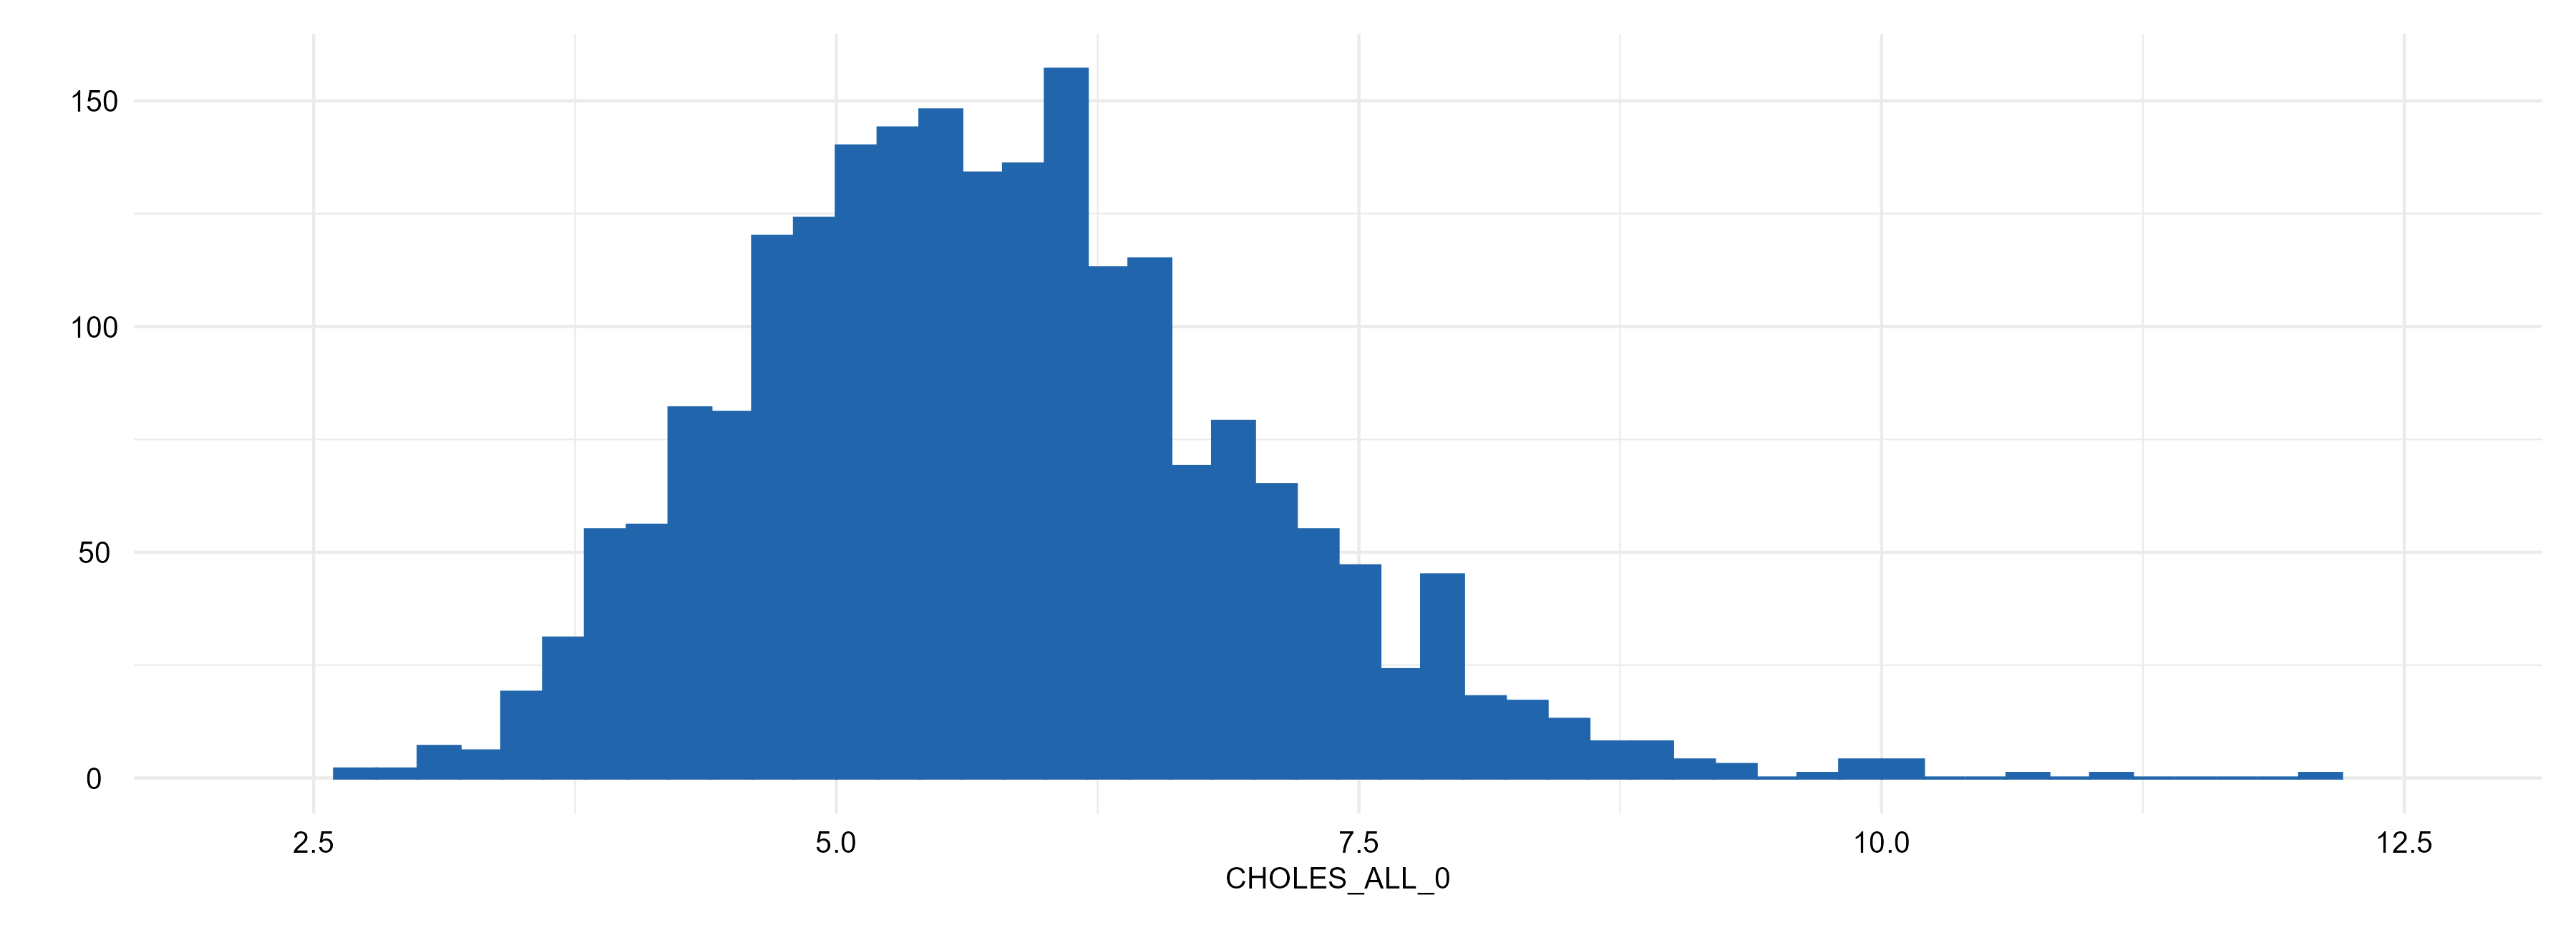
CHOLES_ALL_0
cholesterol
Total cholesterol