Unexpected proportion
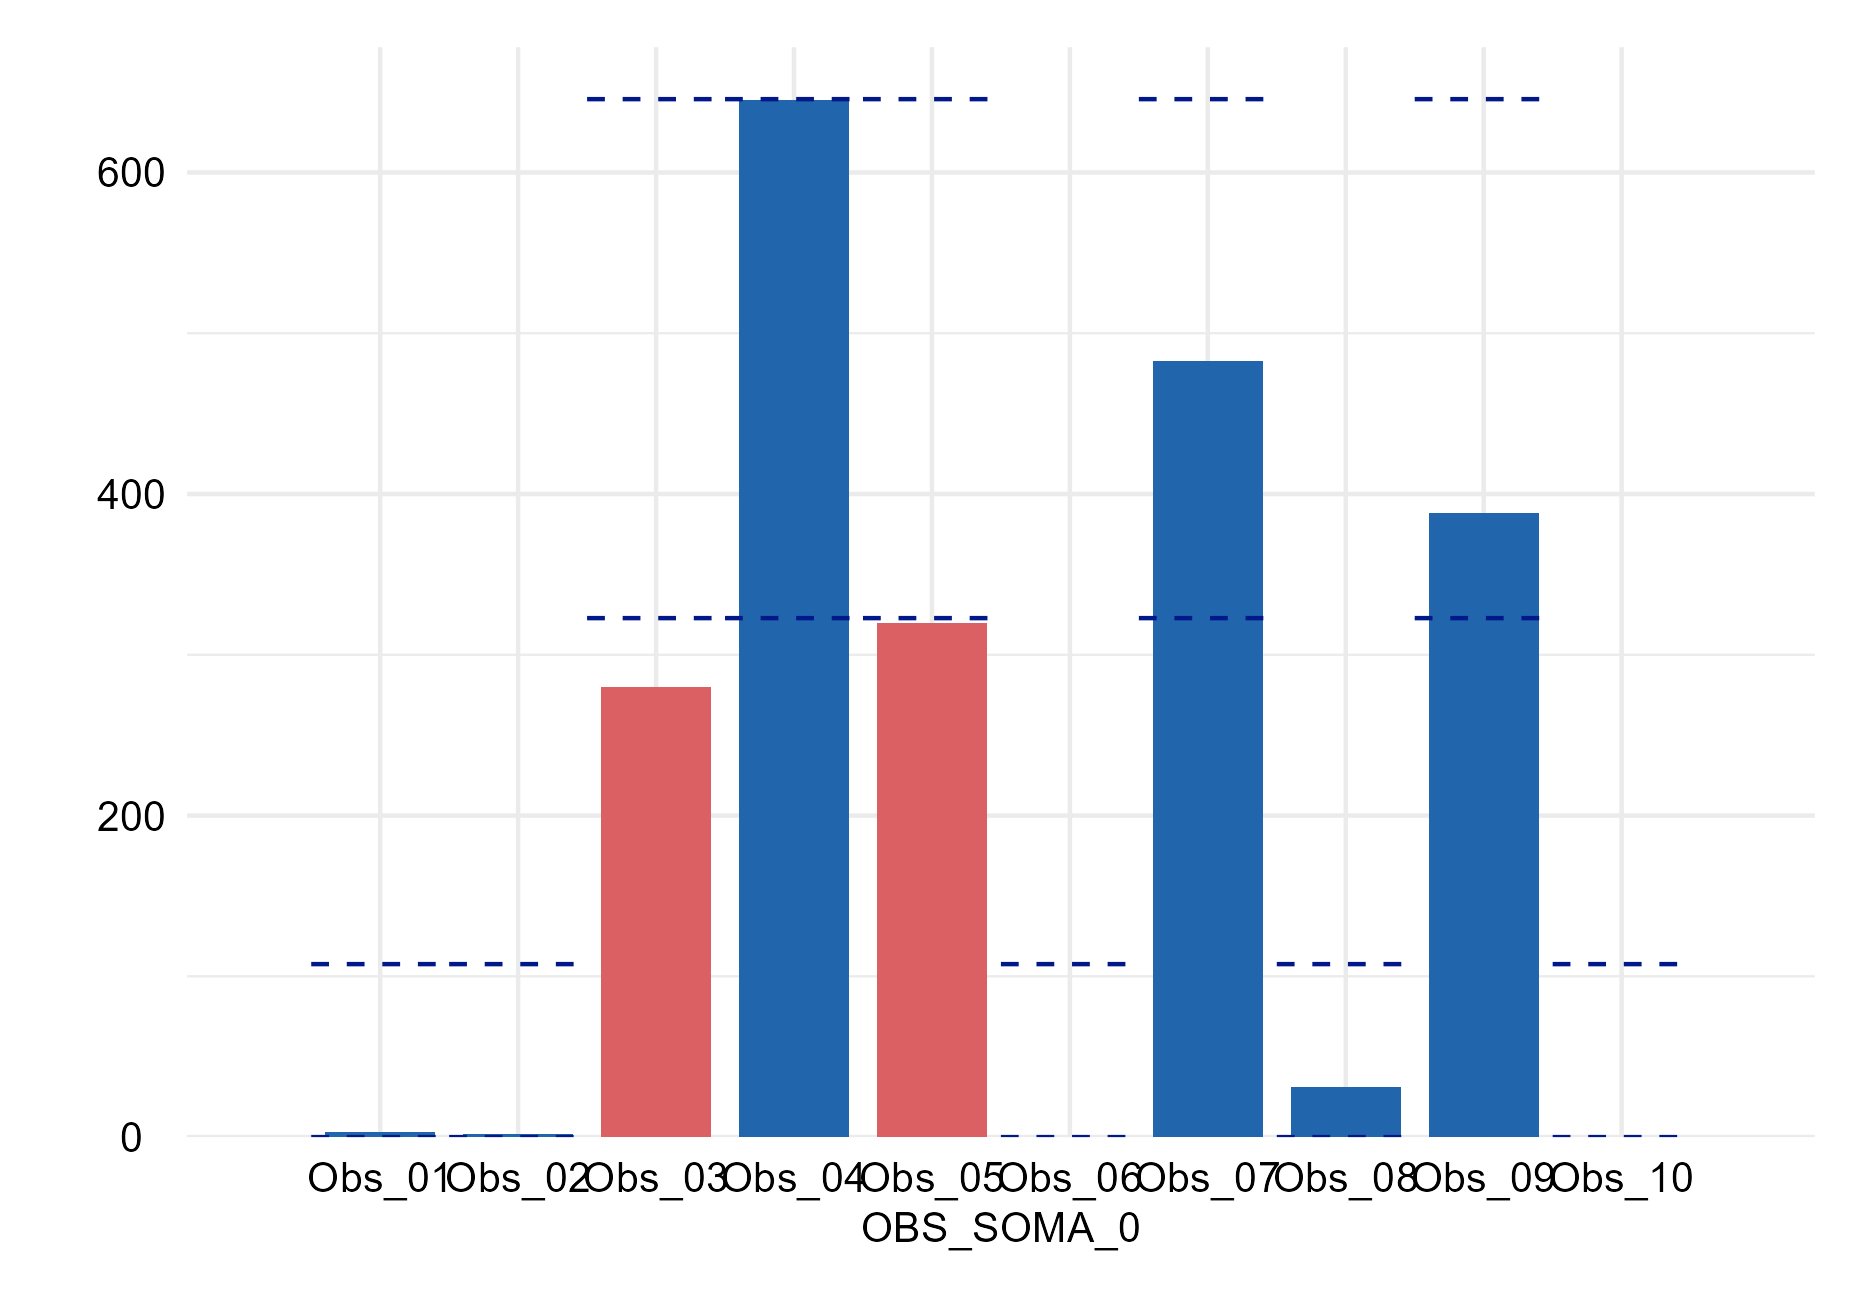
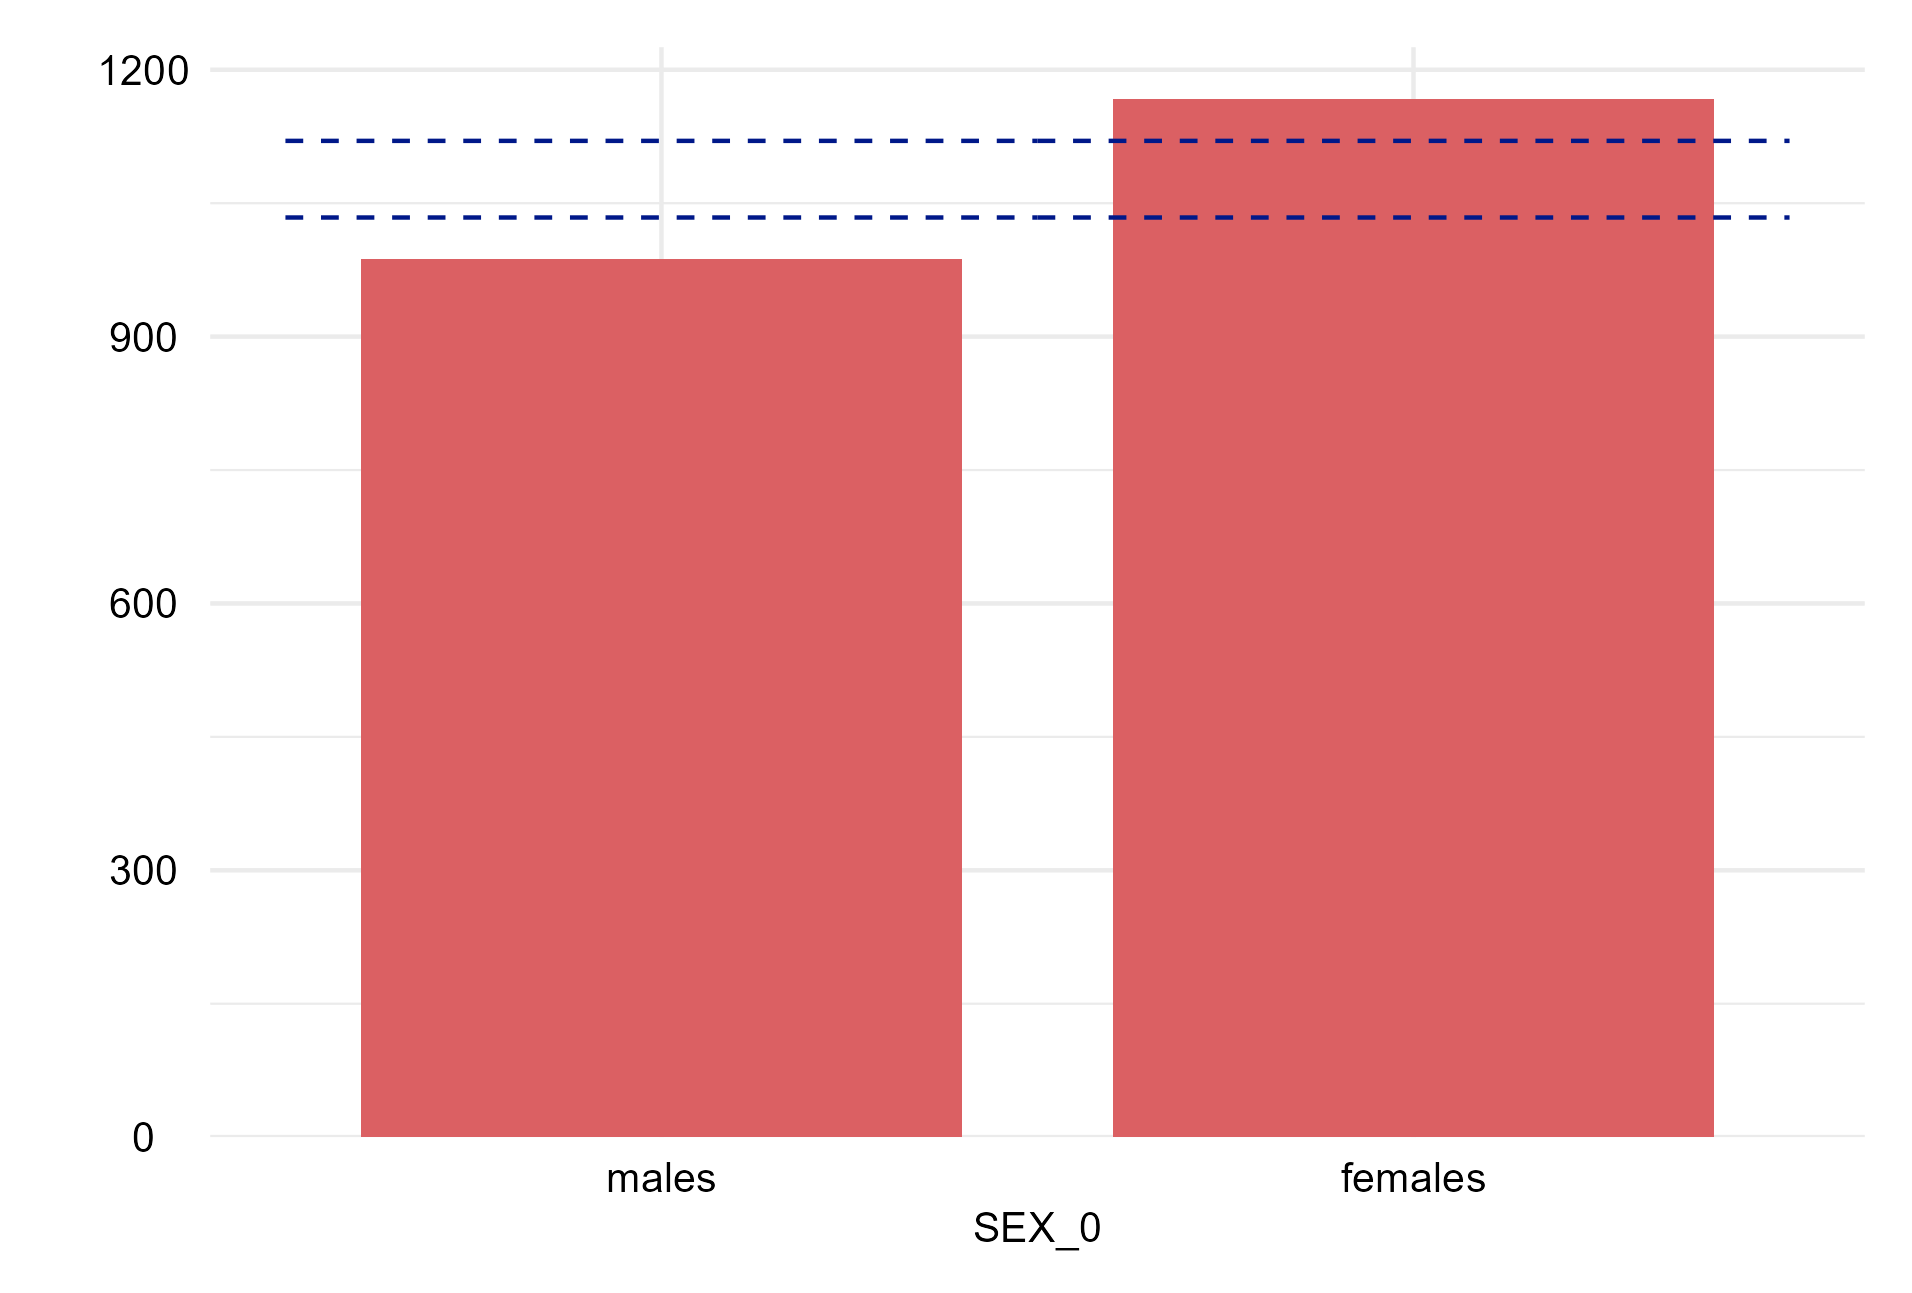
Bar plot representing the absolute frequencies of observations per category. The plot is created only if the column PROPORTION_RANGE in the metadata contains a range of possible values for all the categories, e.g., [49, 51], or a list containing the range of expected values per category, e.g., low in [20, 22] | medium in [20, 22] | high in [60, 62].
SEX_0
sex
Sex
OBS_SOMA_0
obs_soma
Somatometry examiner