Time trend
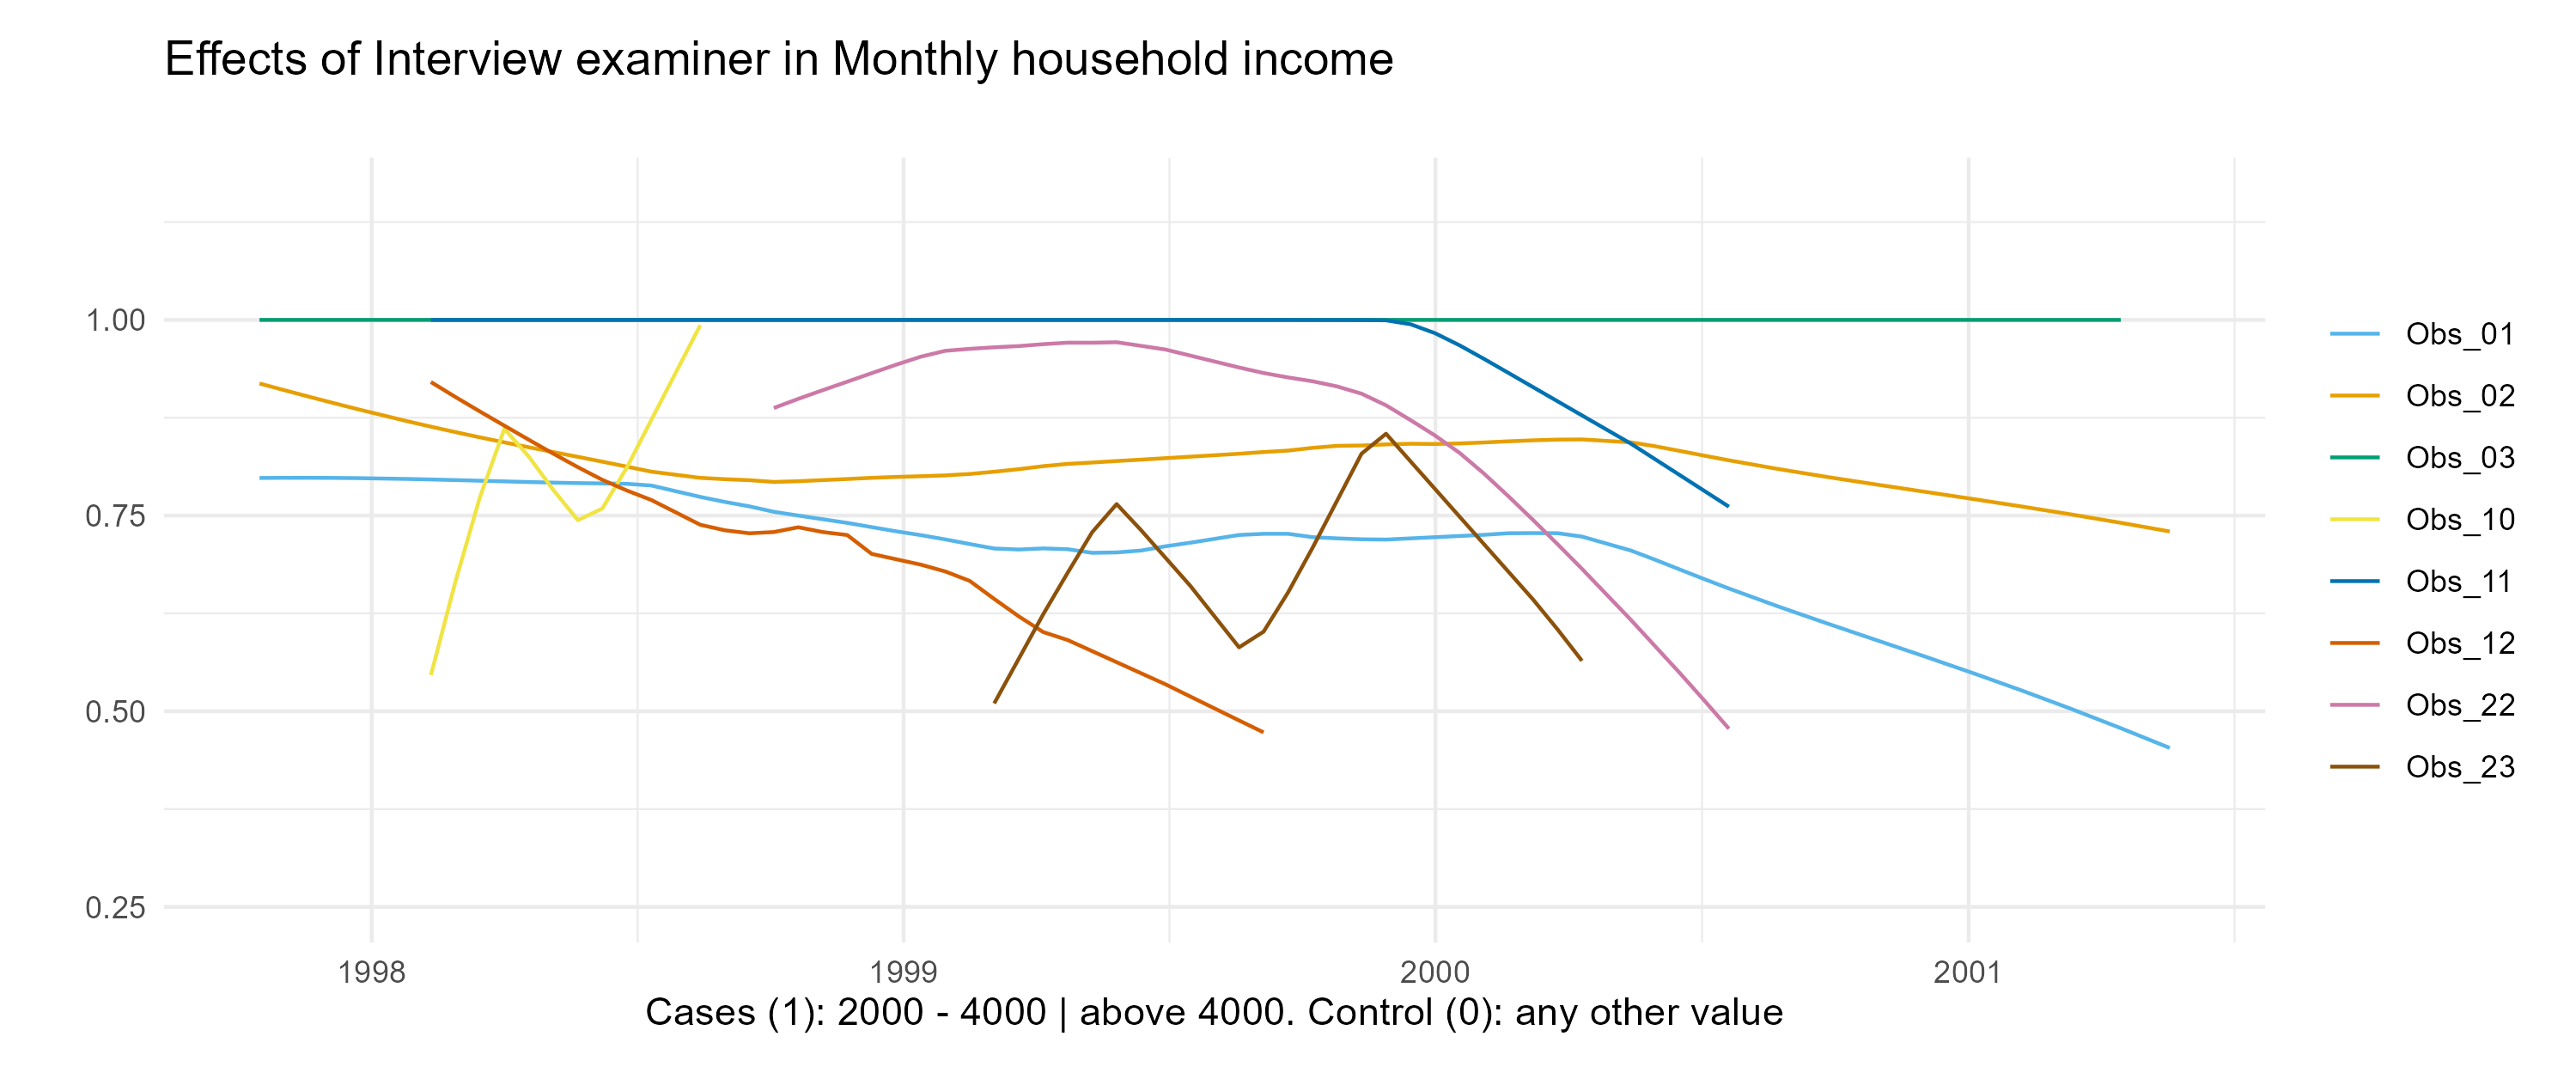
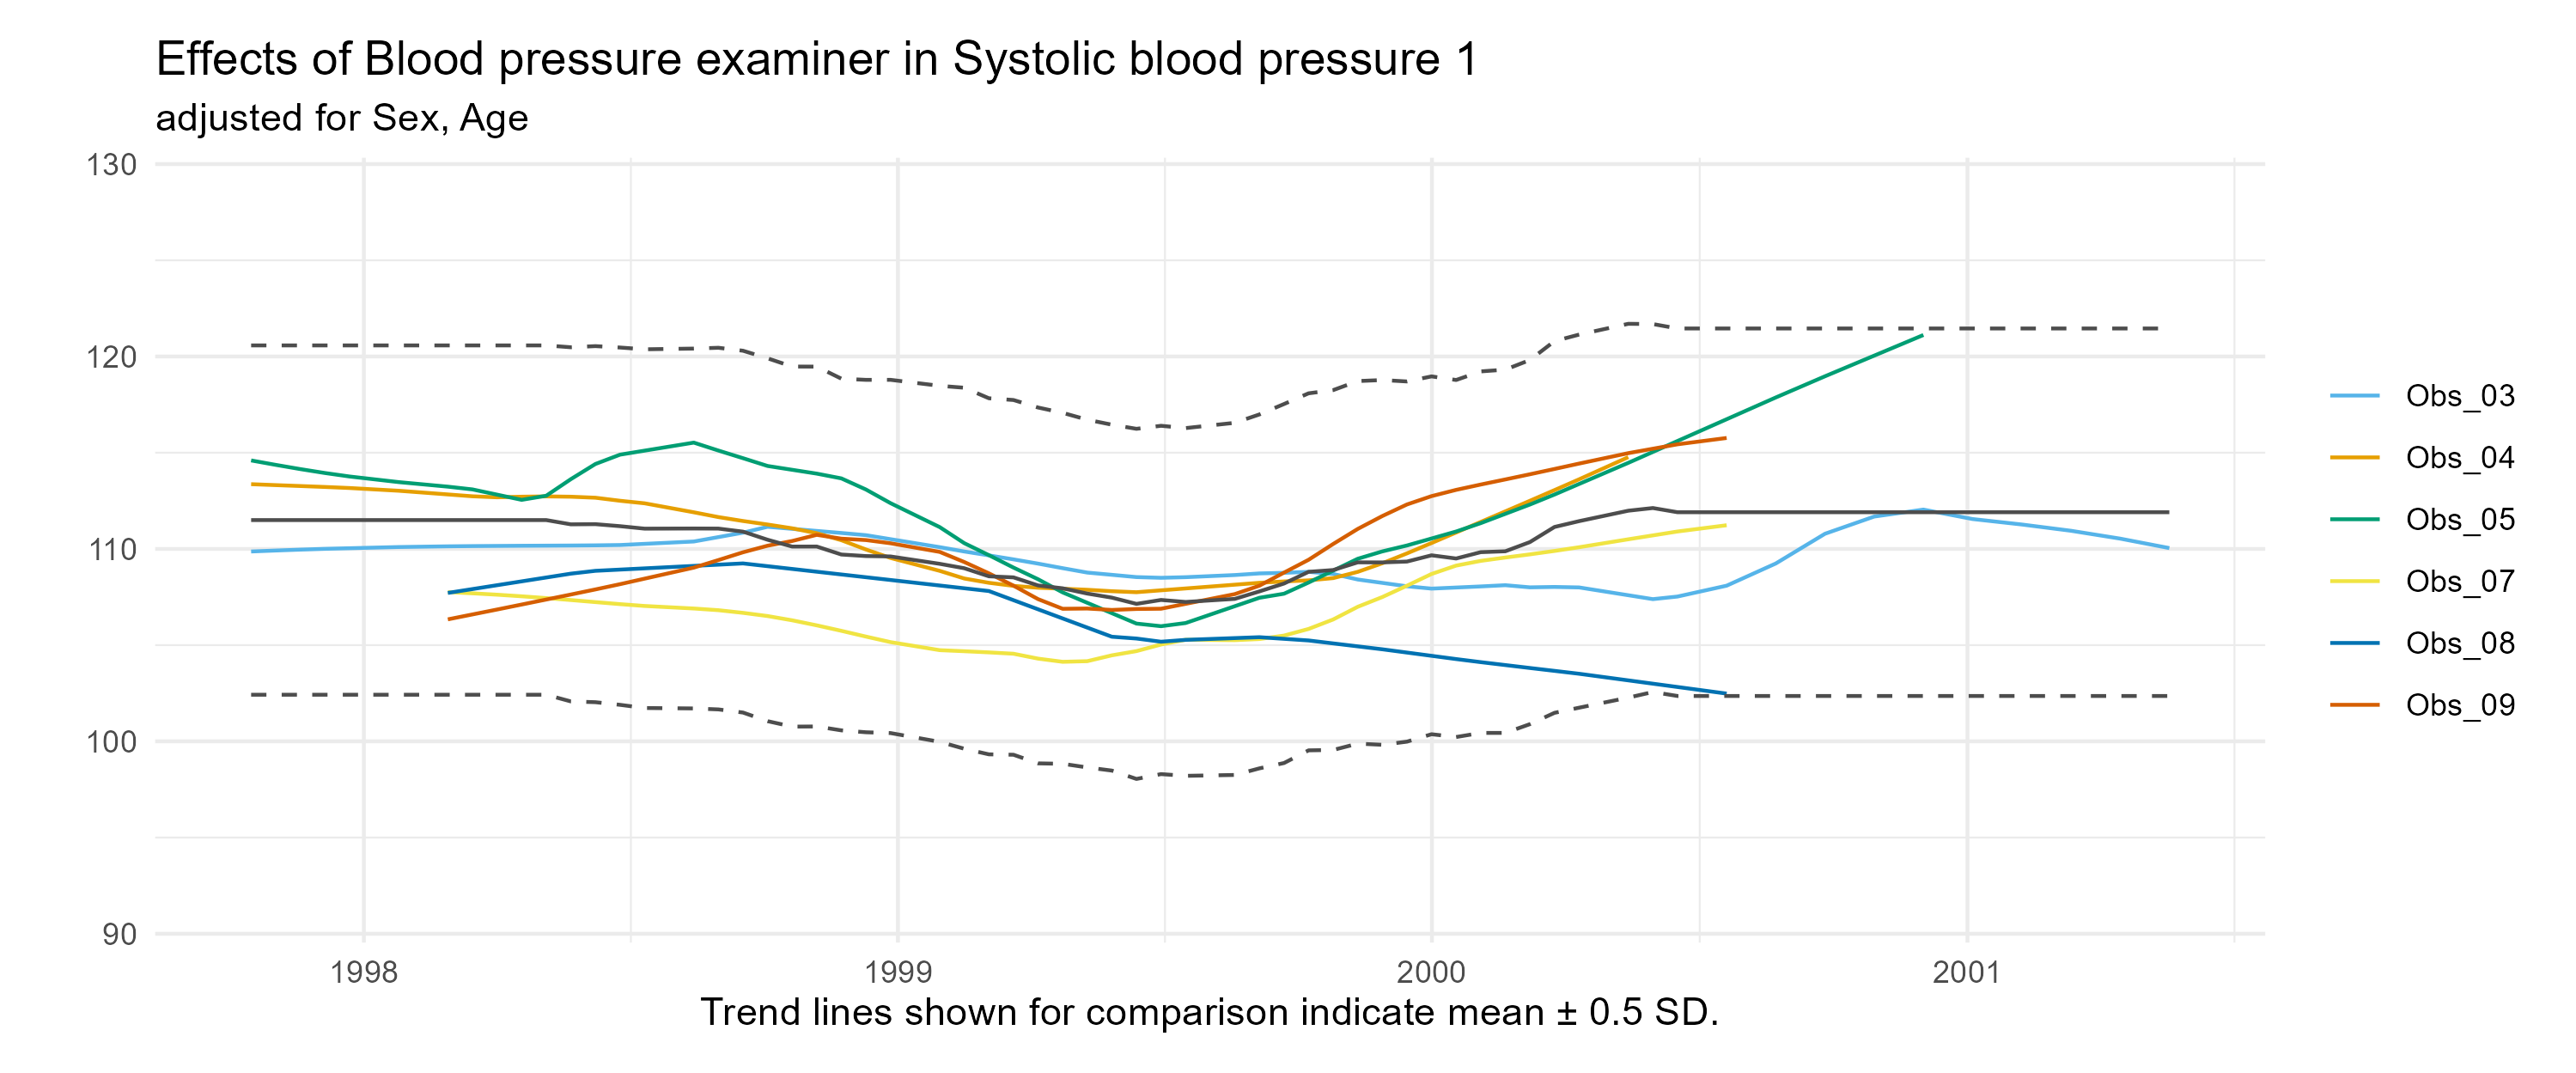
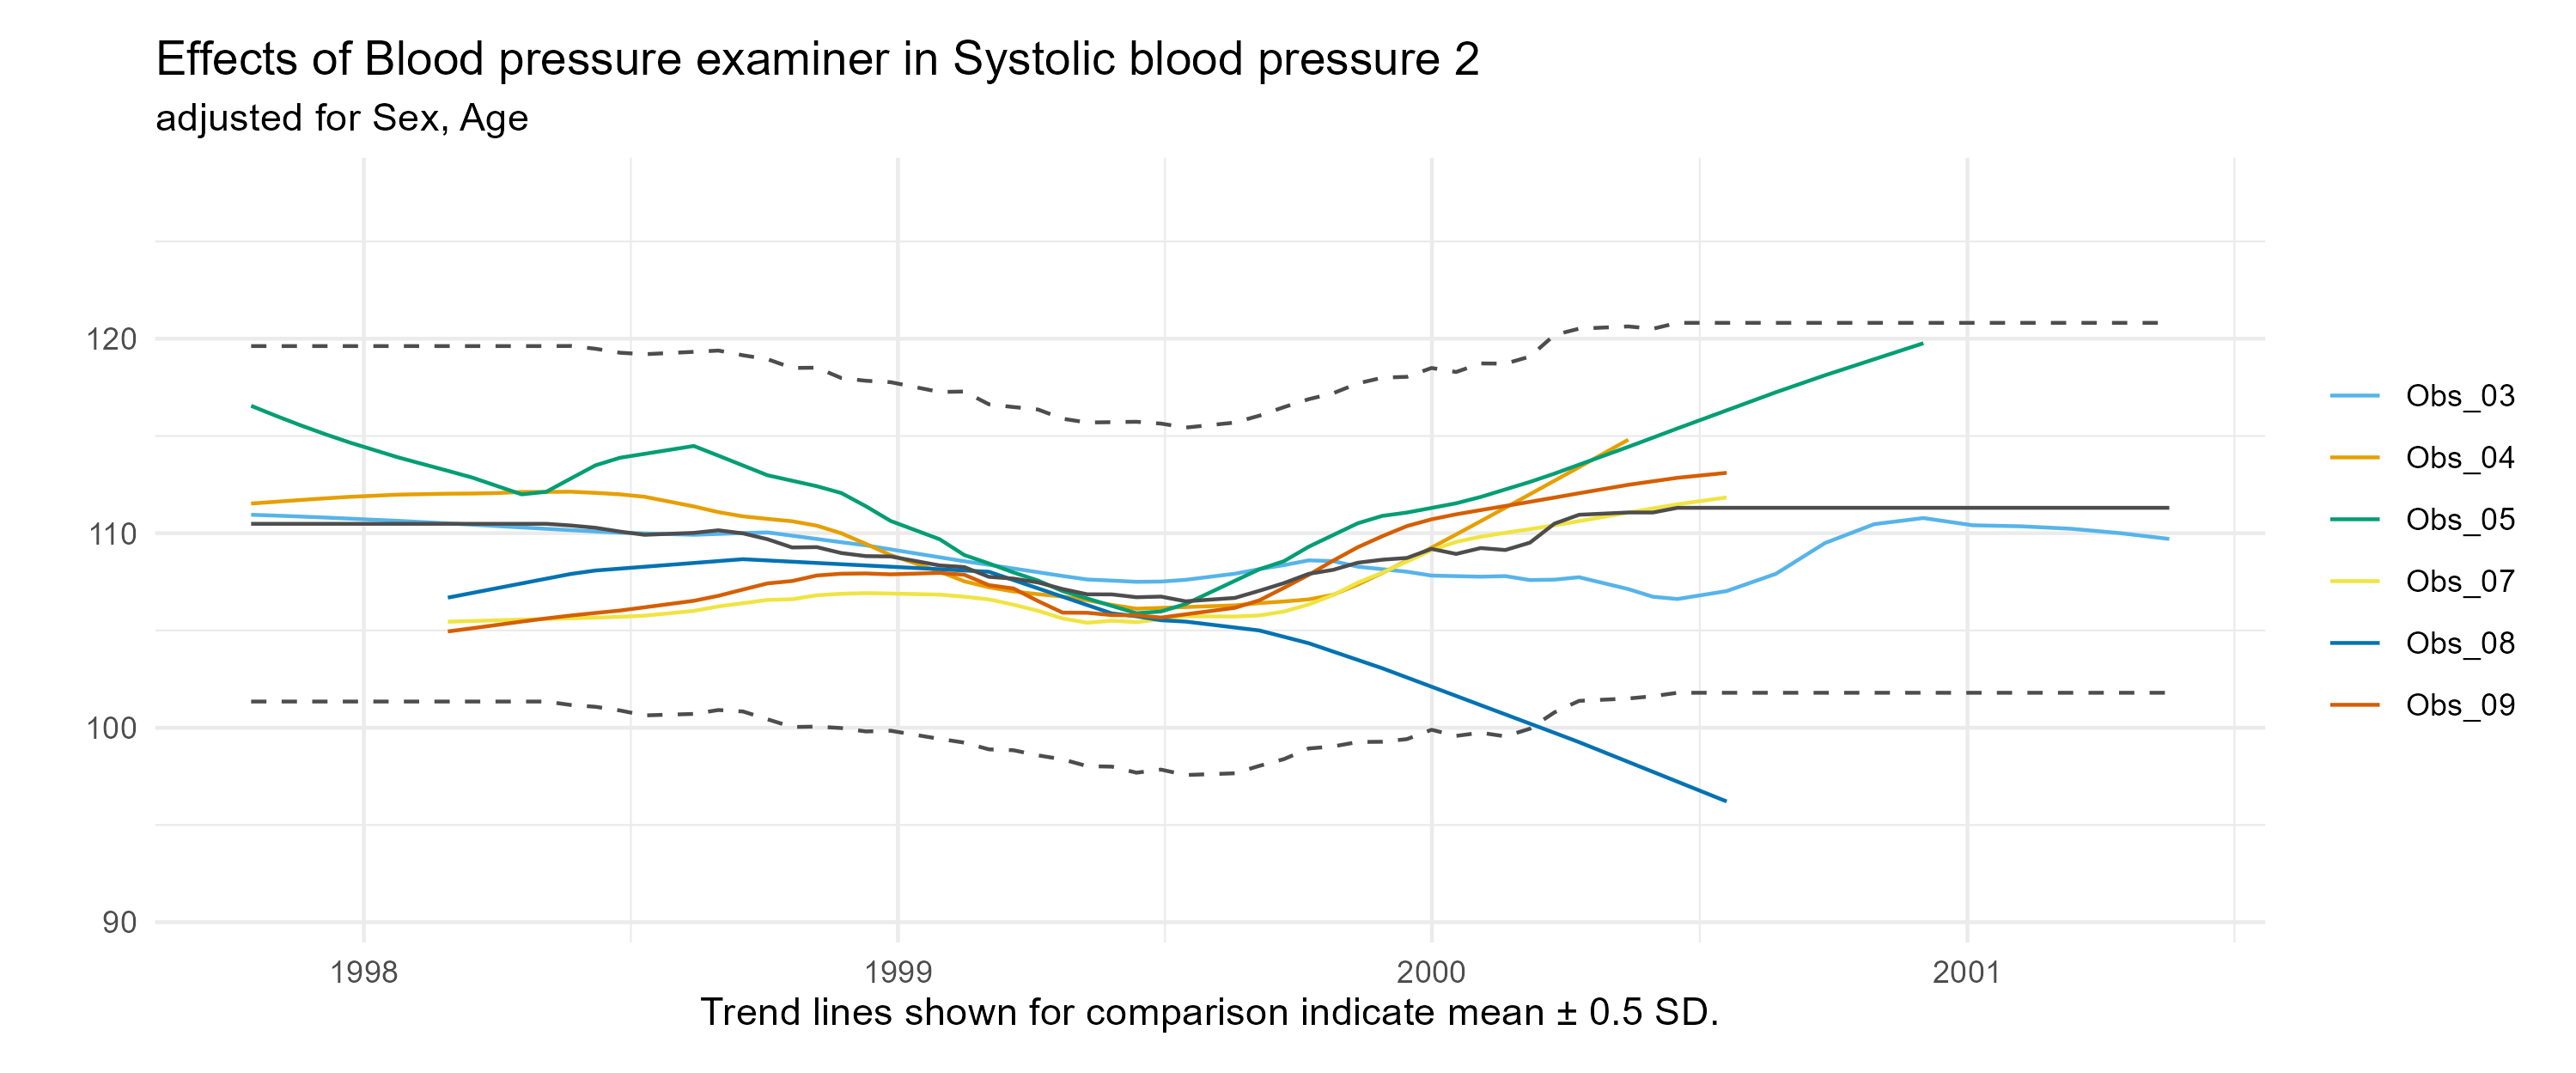
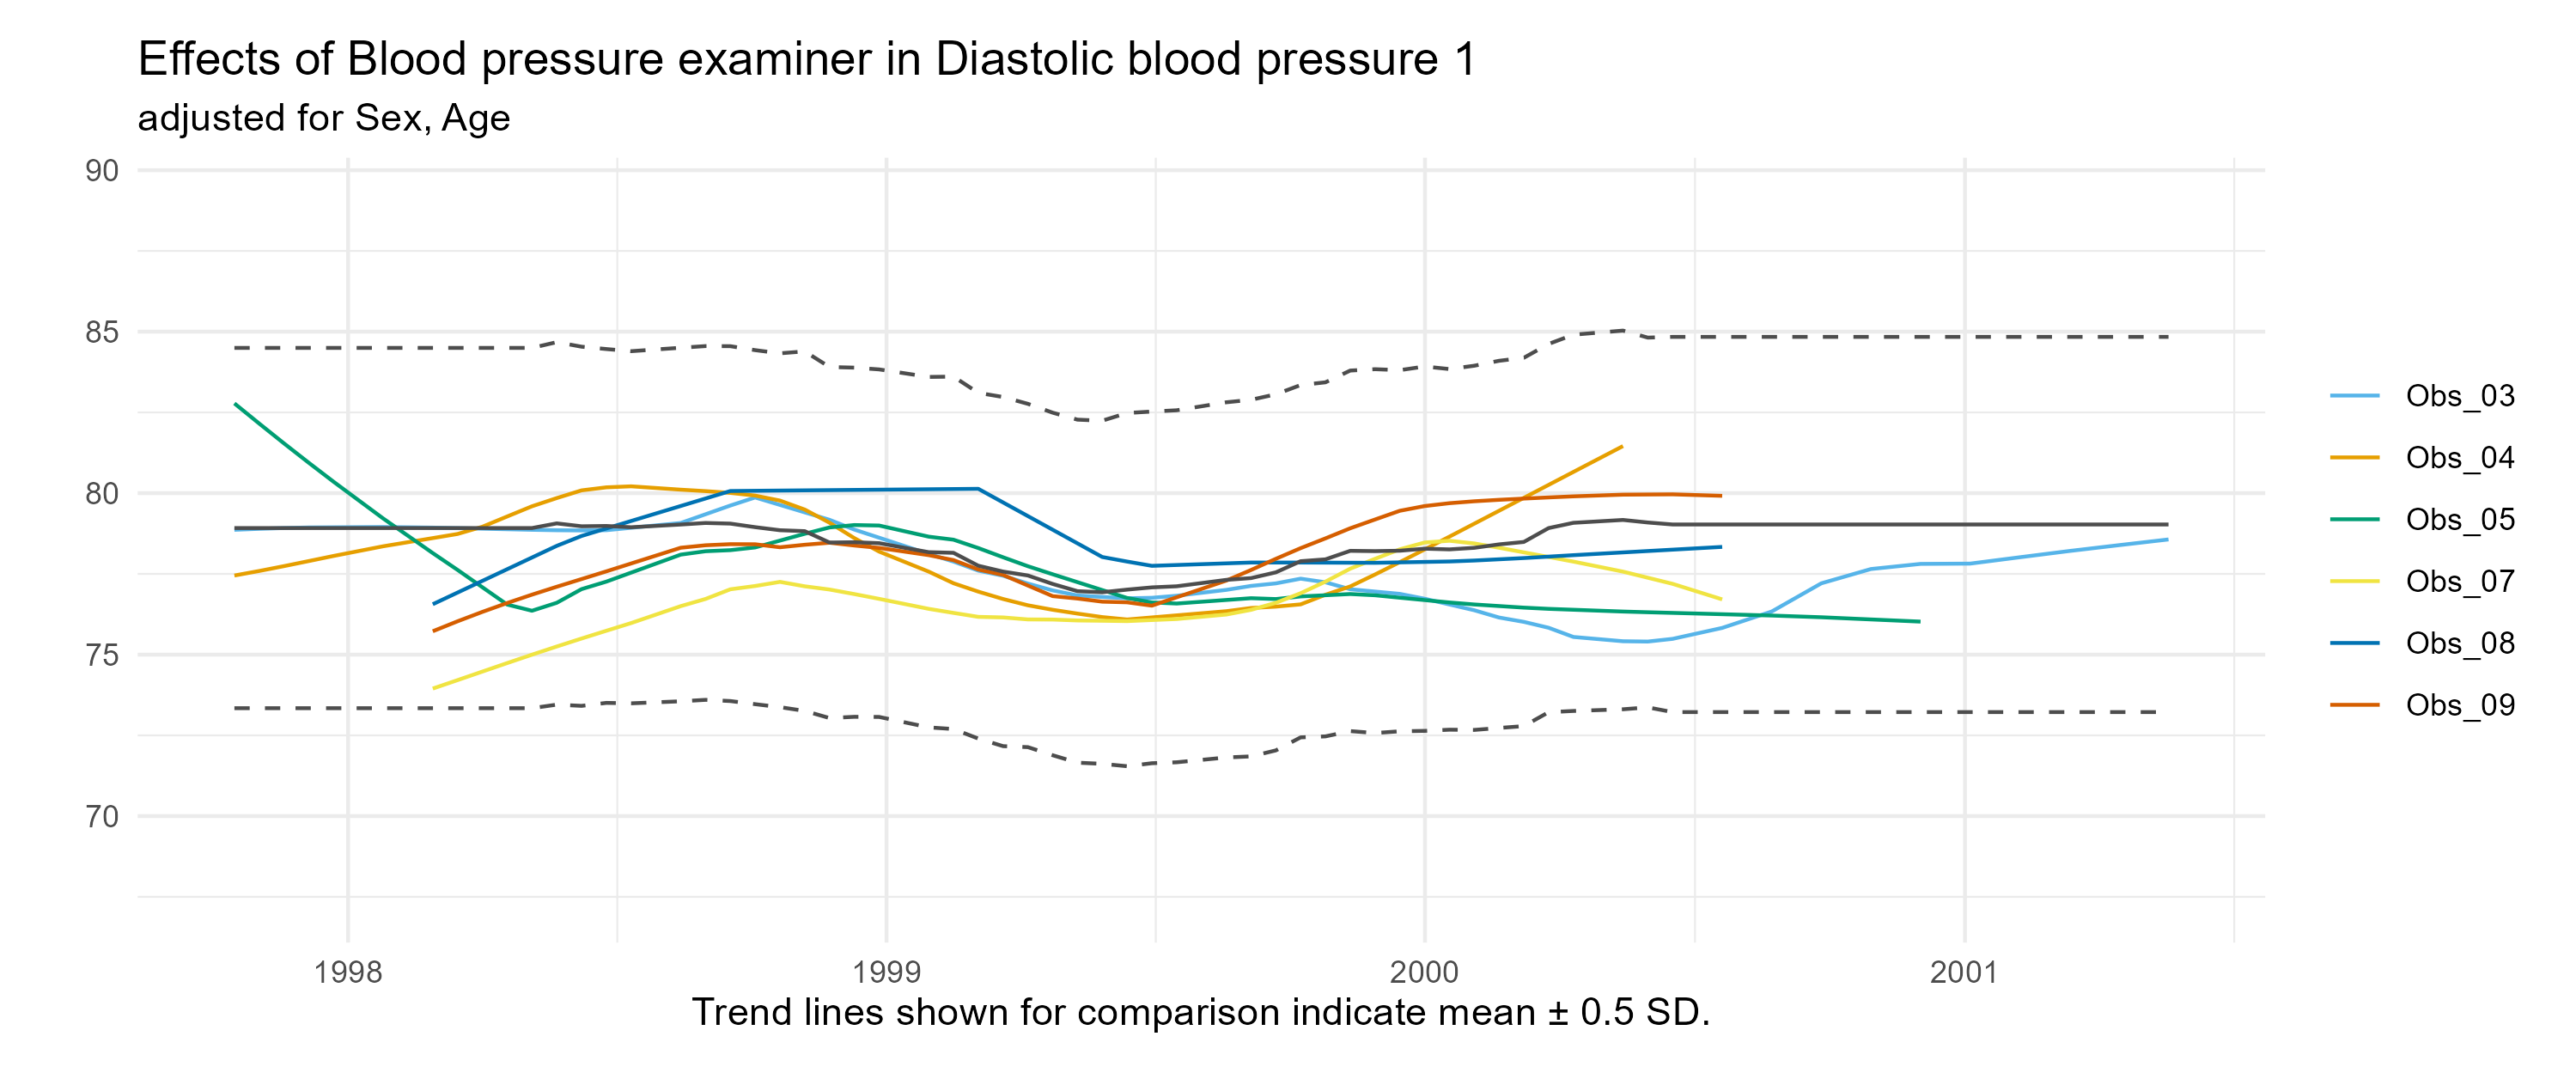
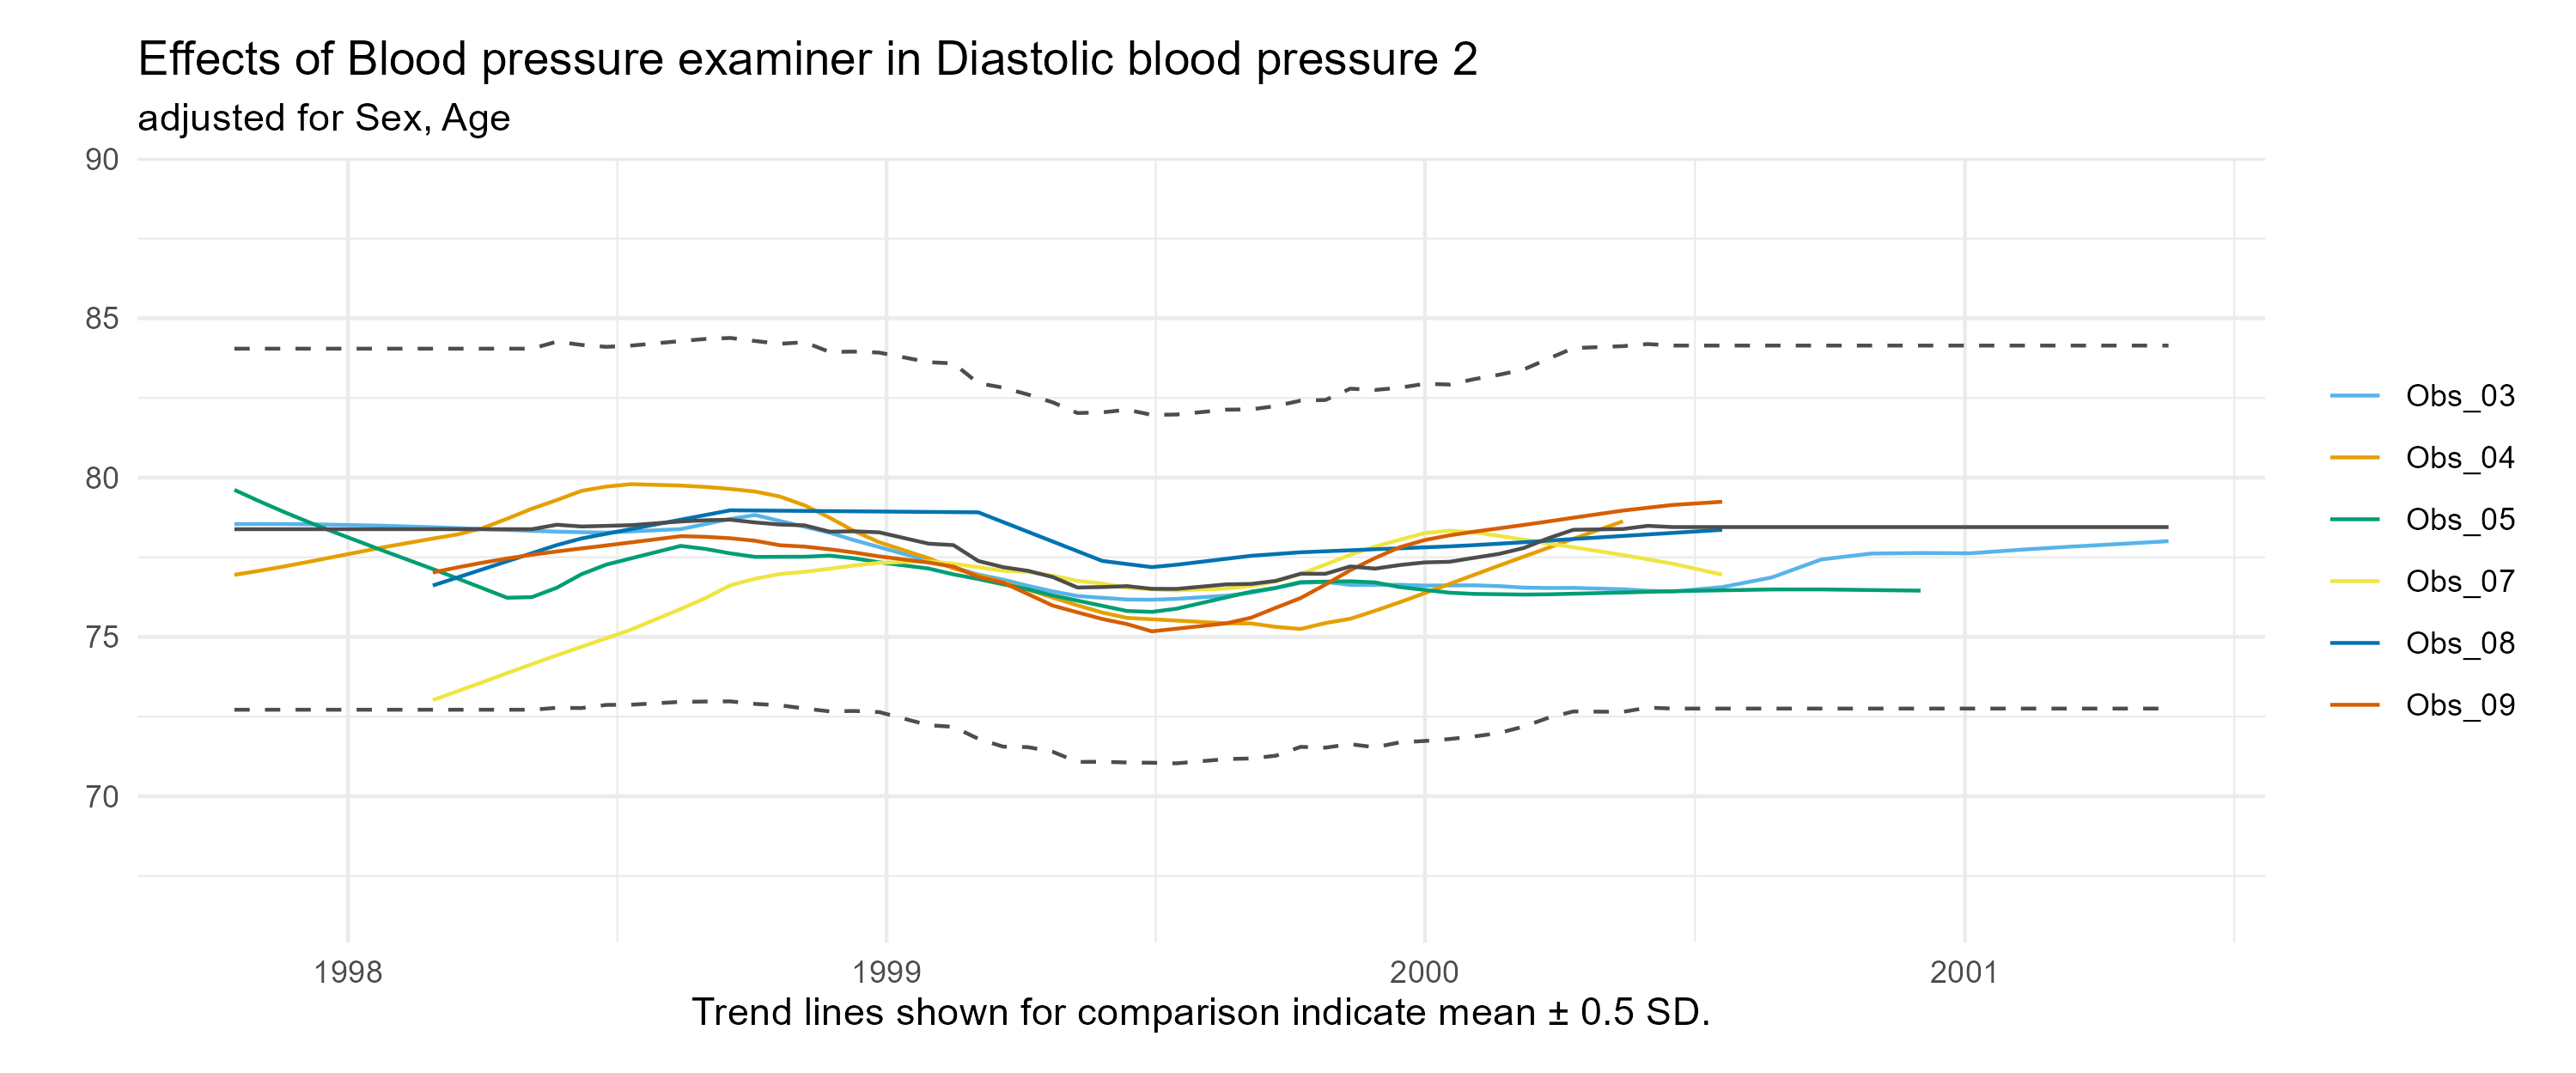
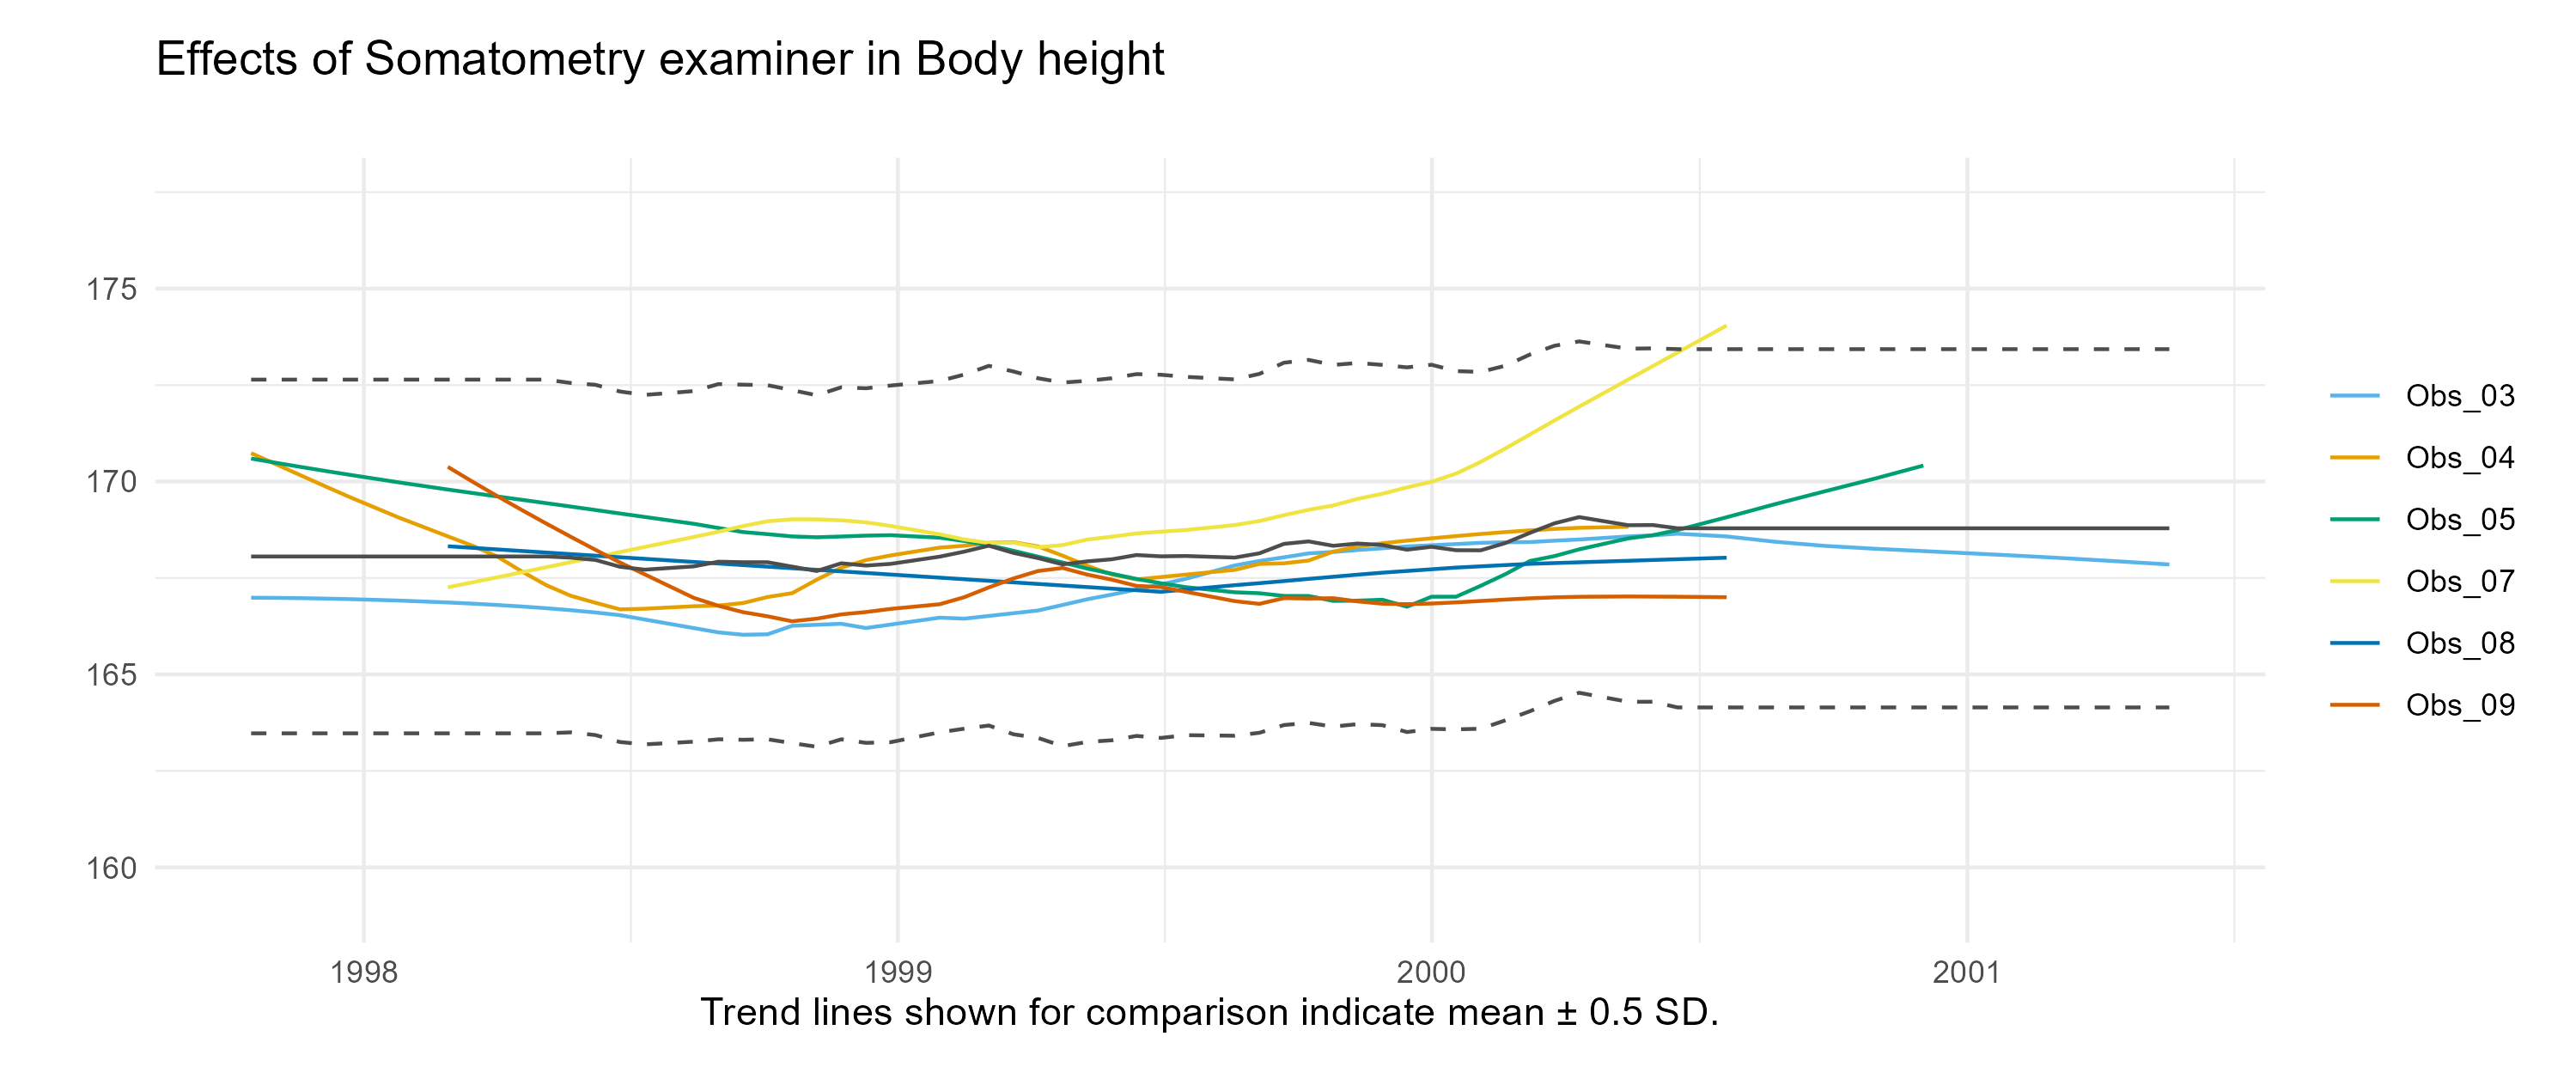
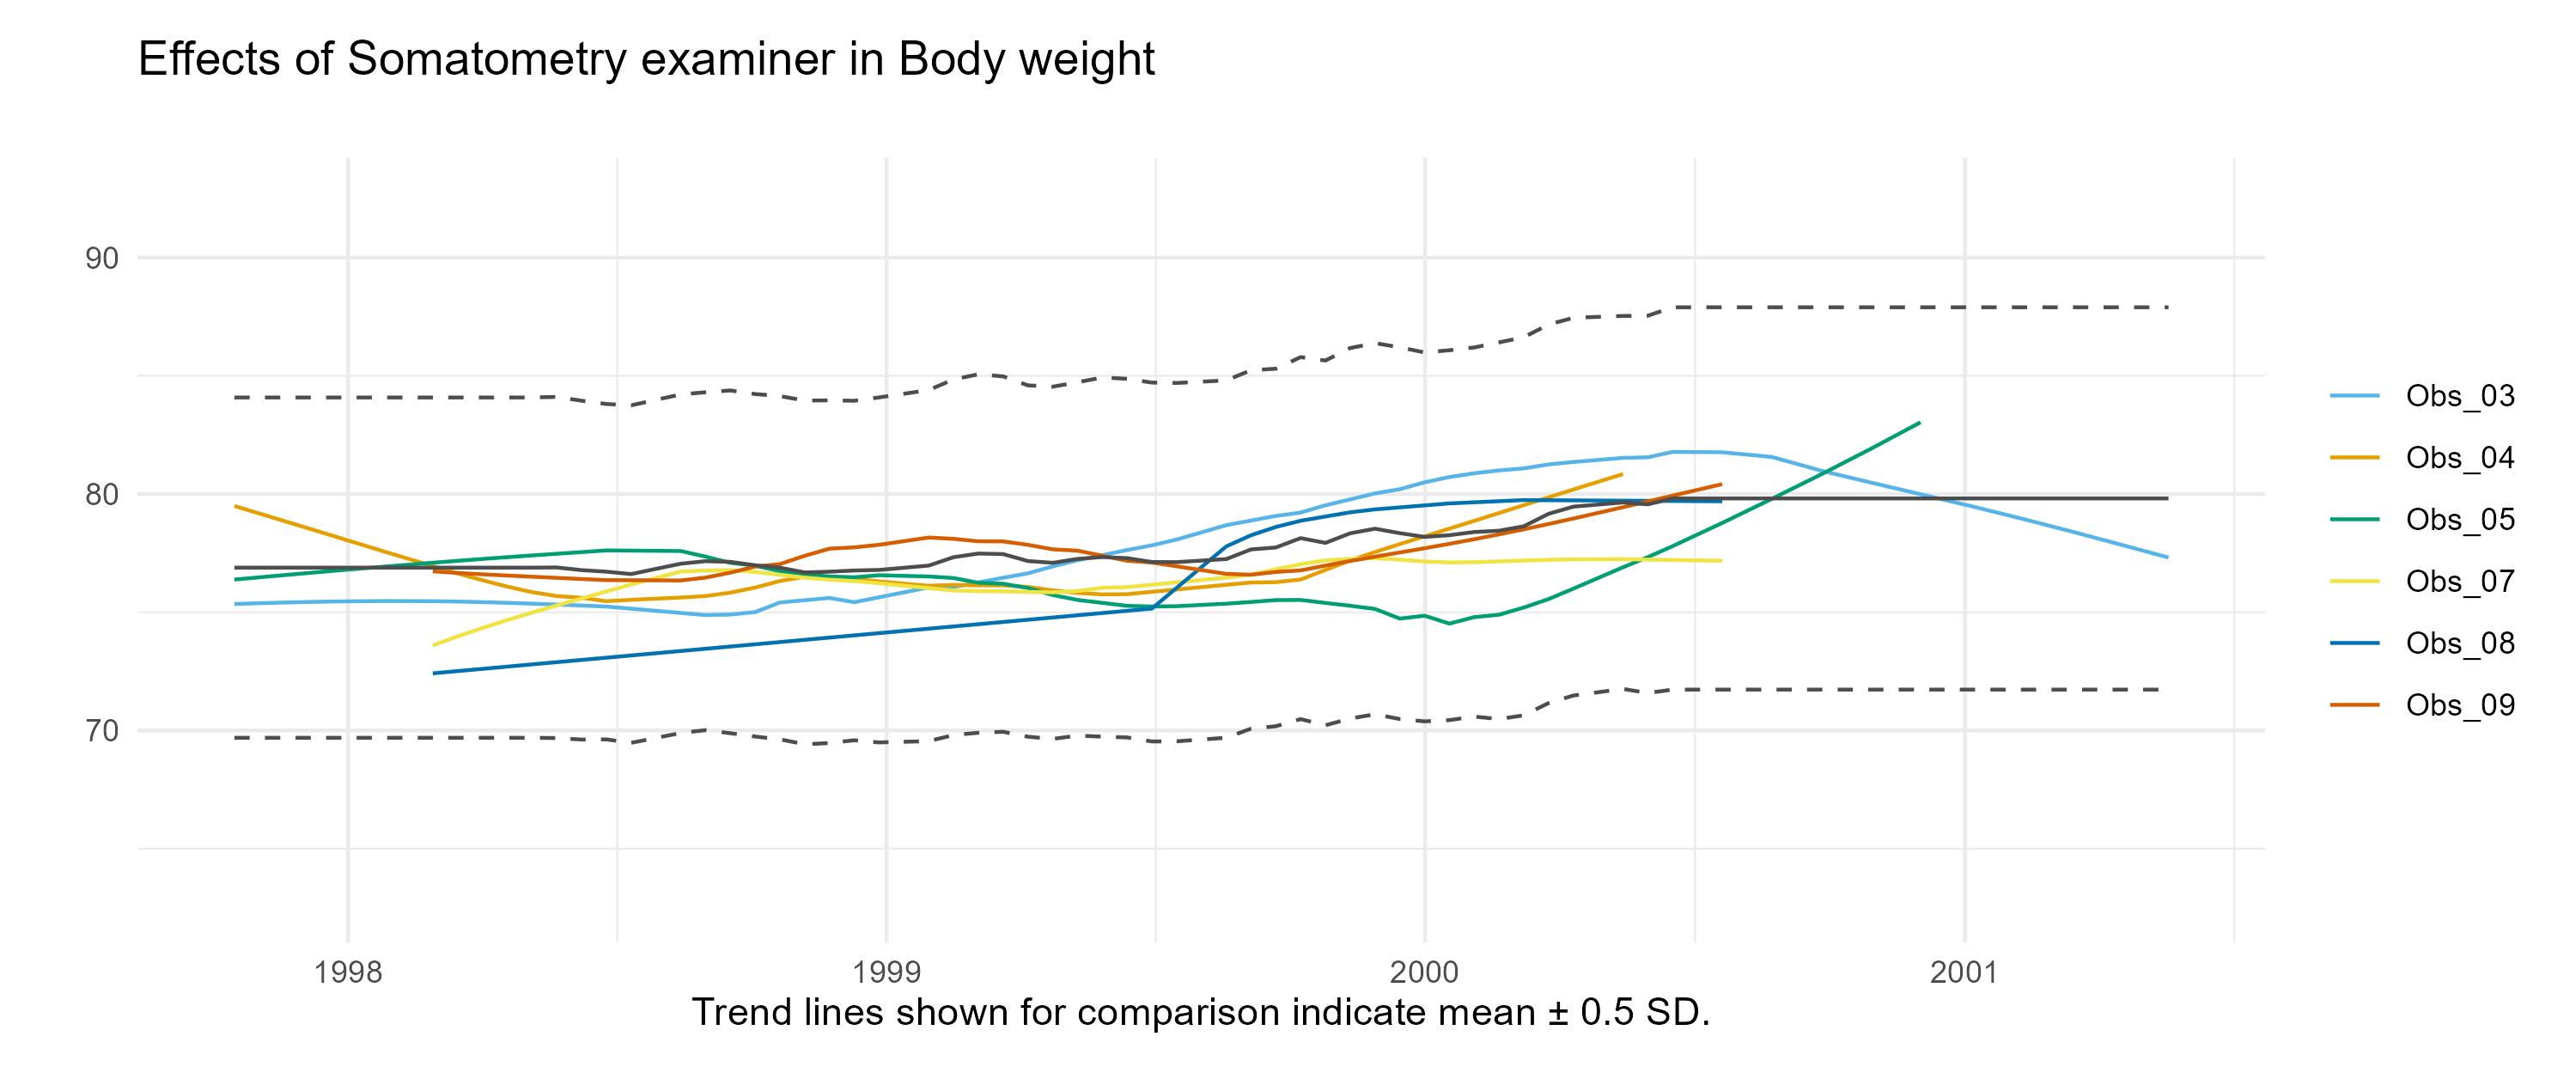
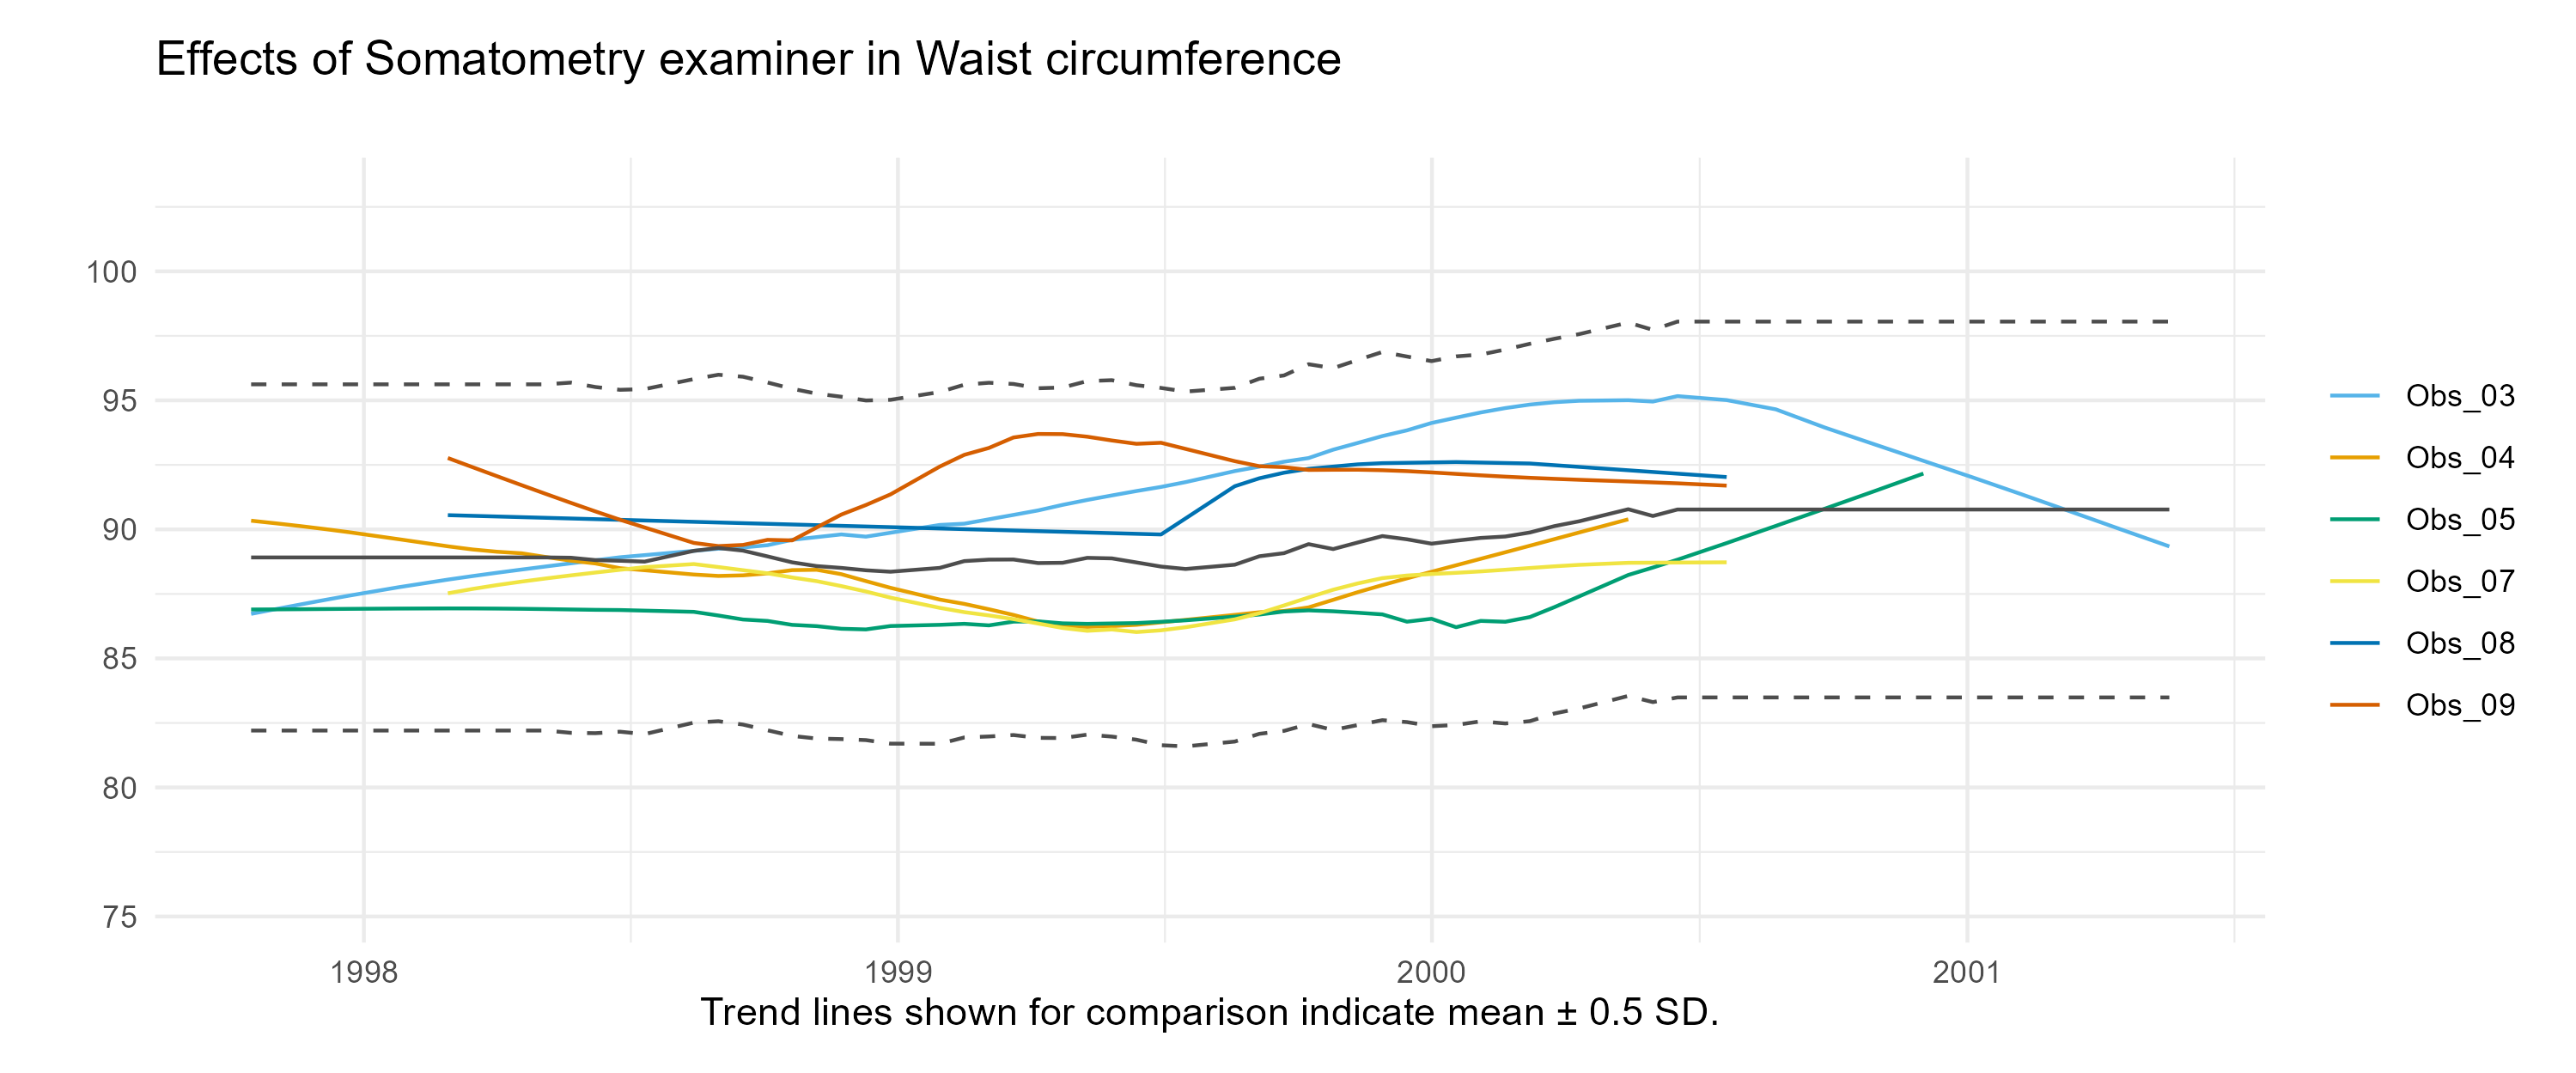
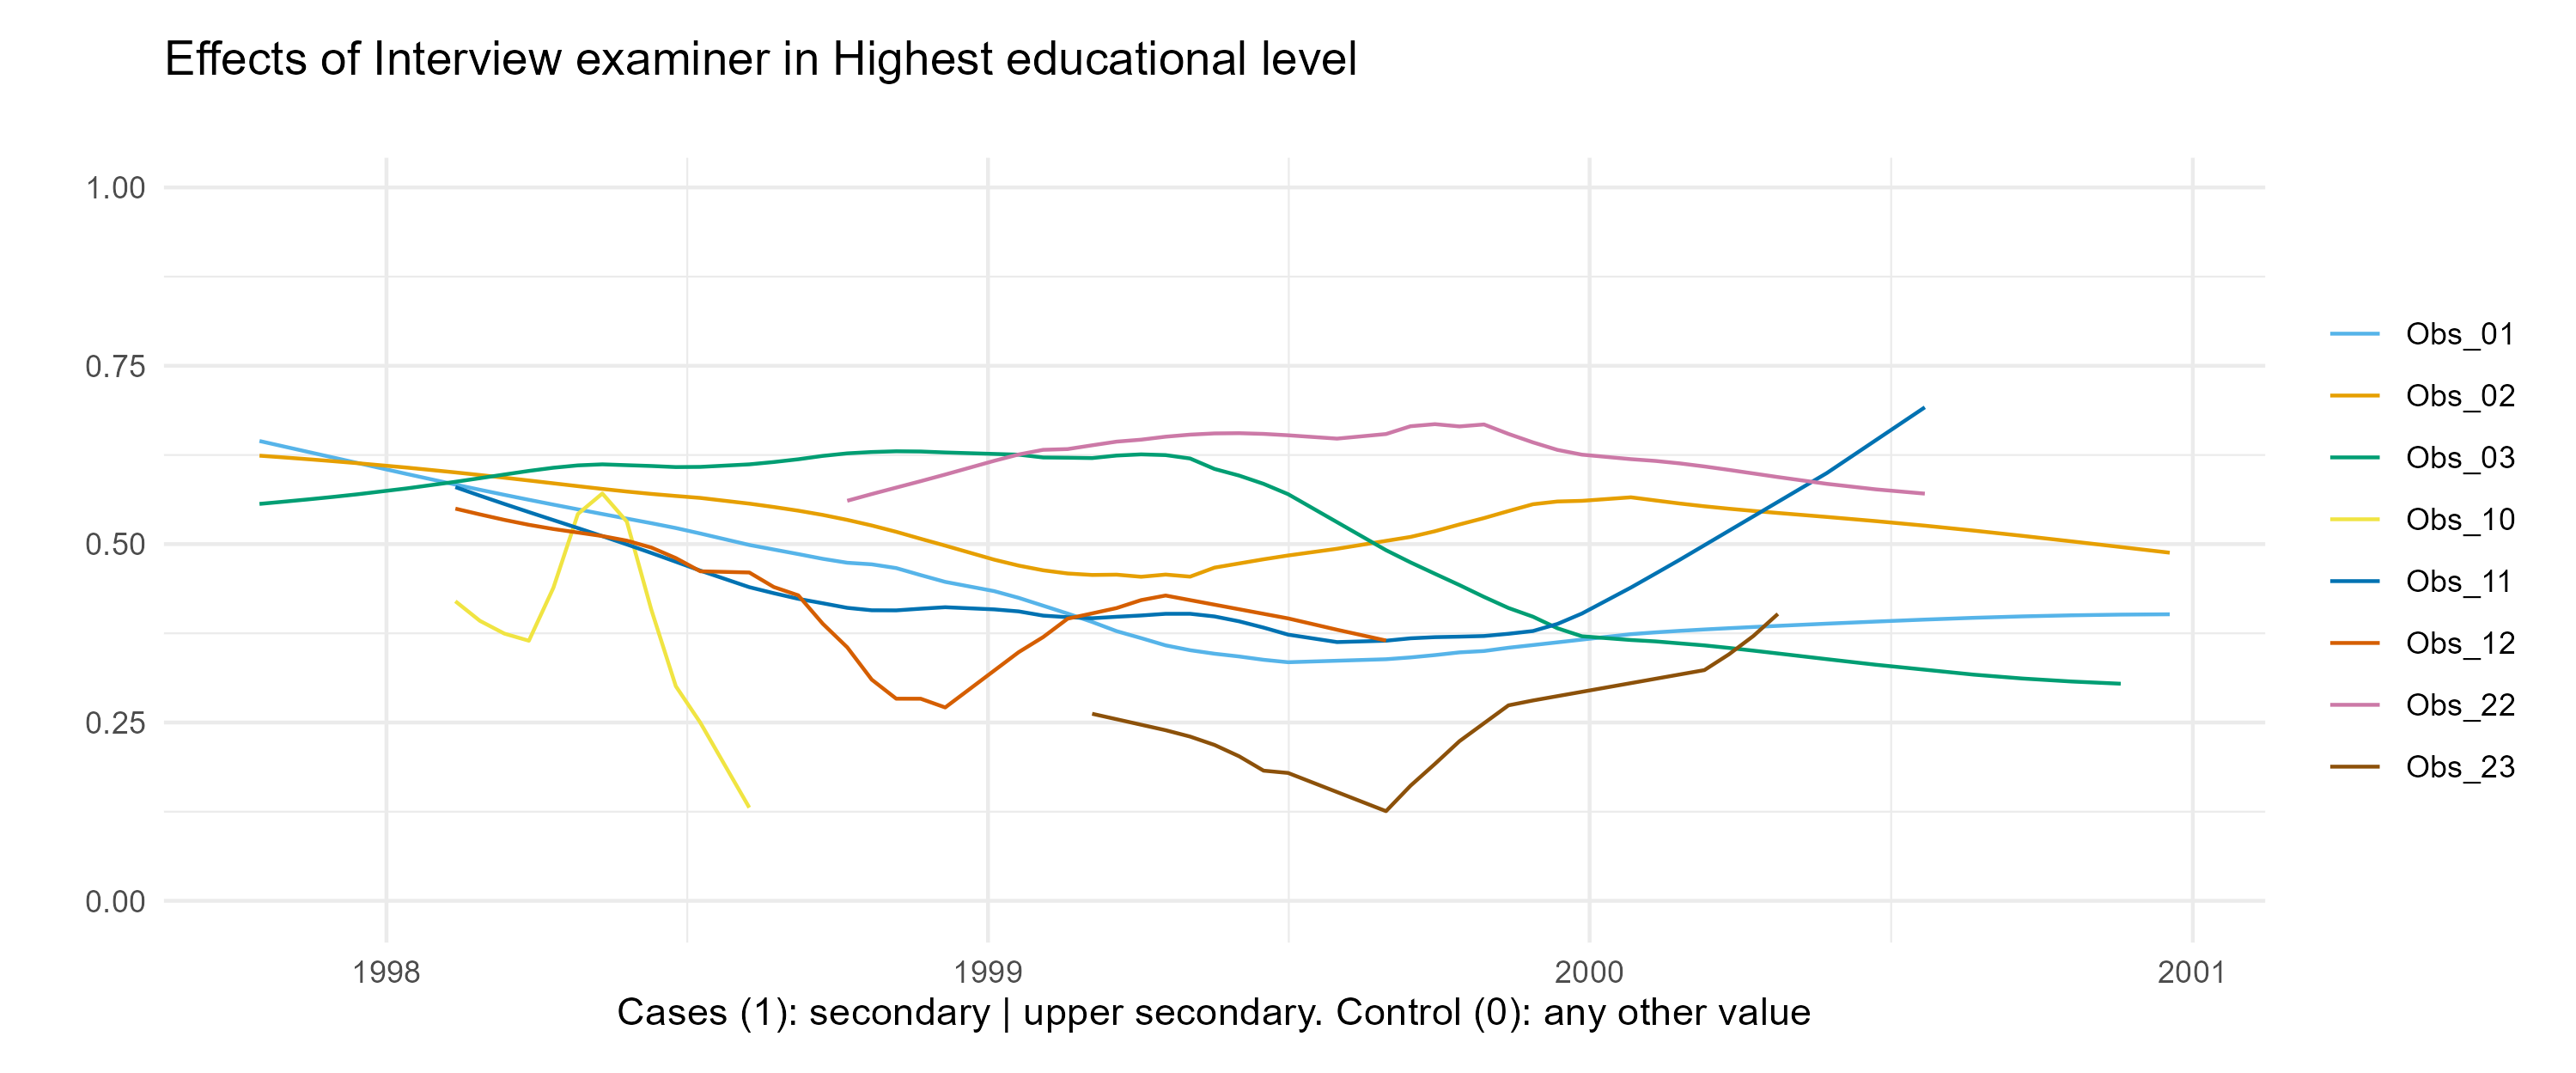
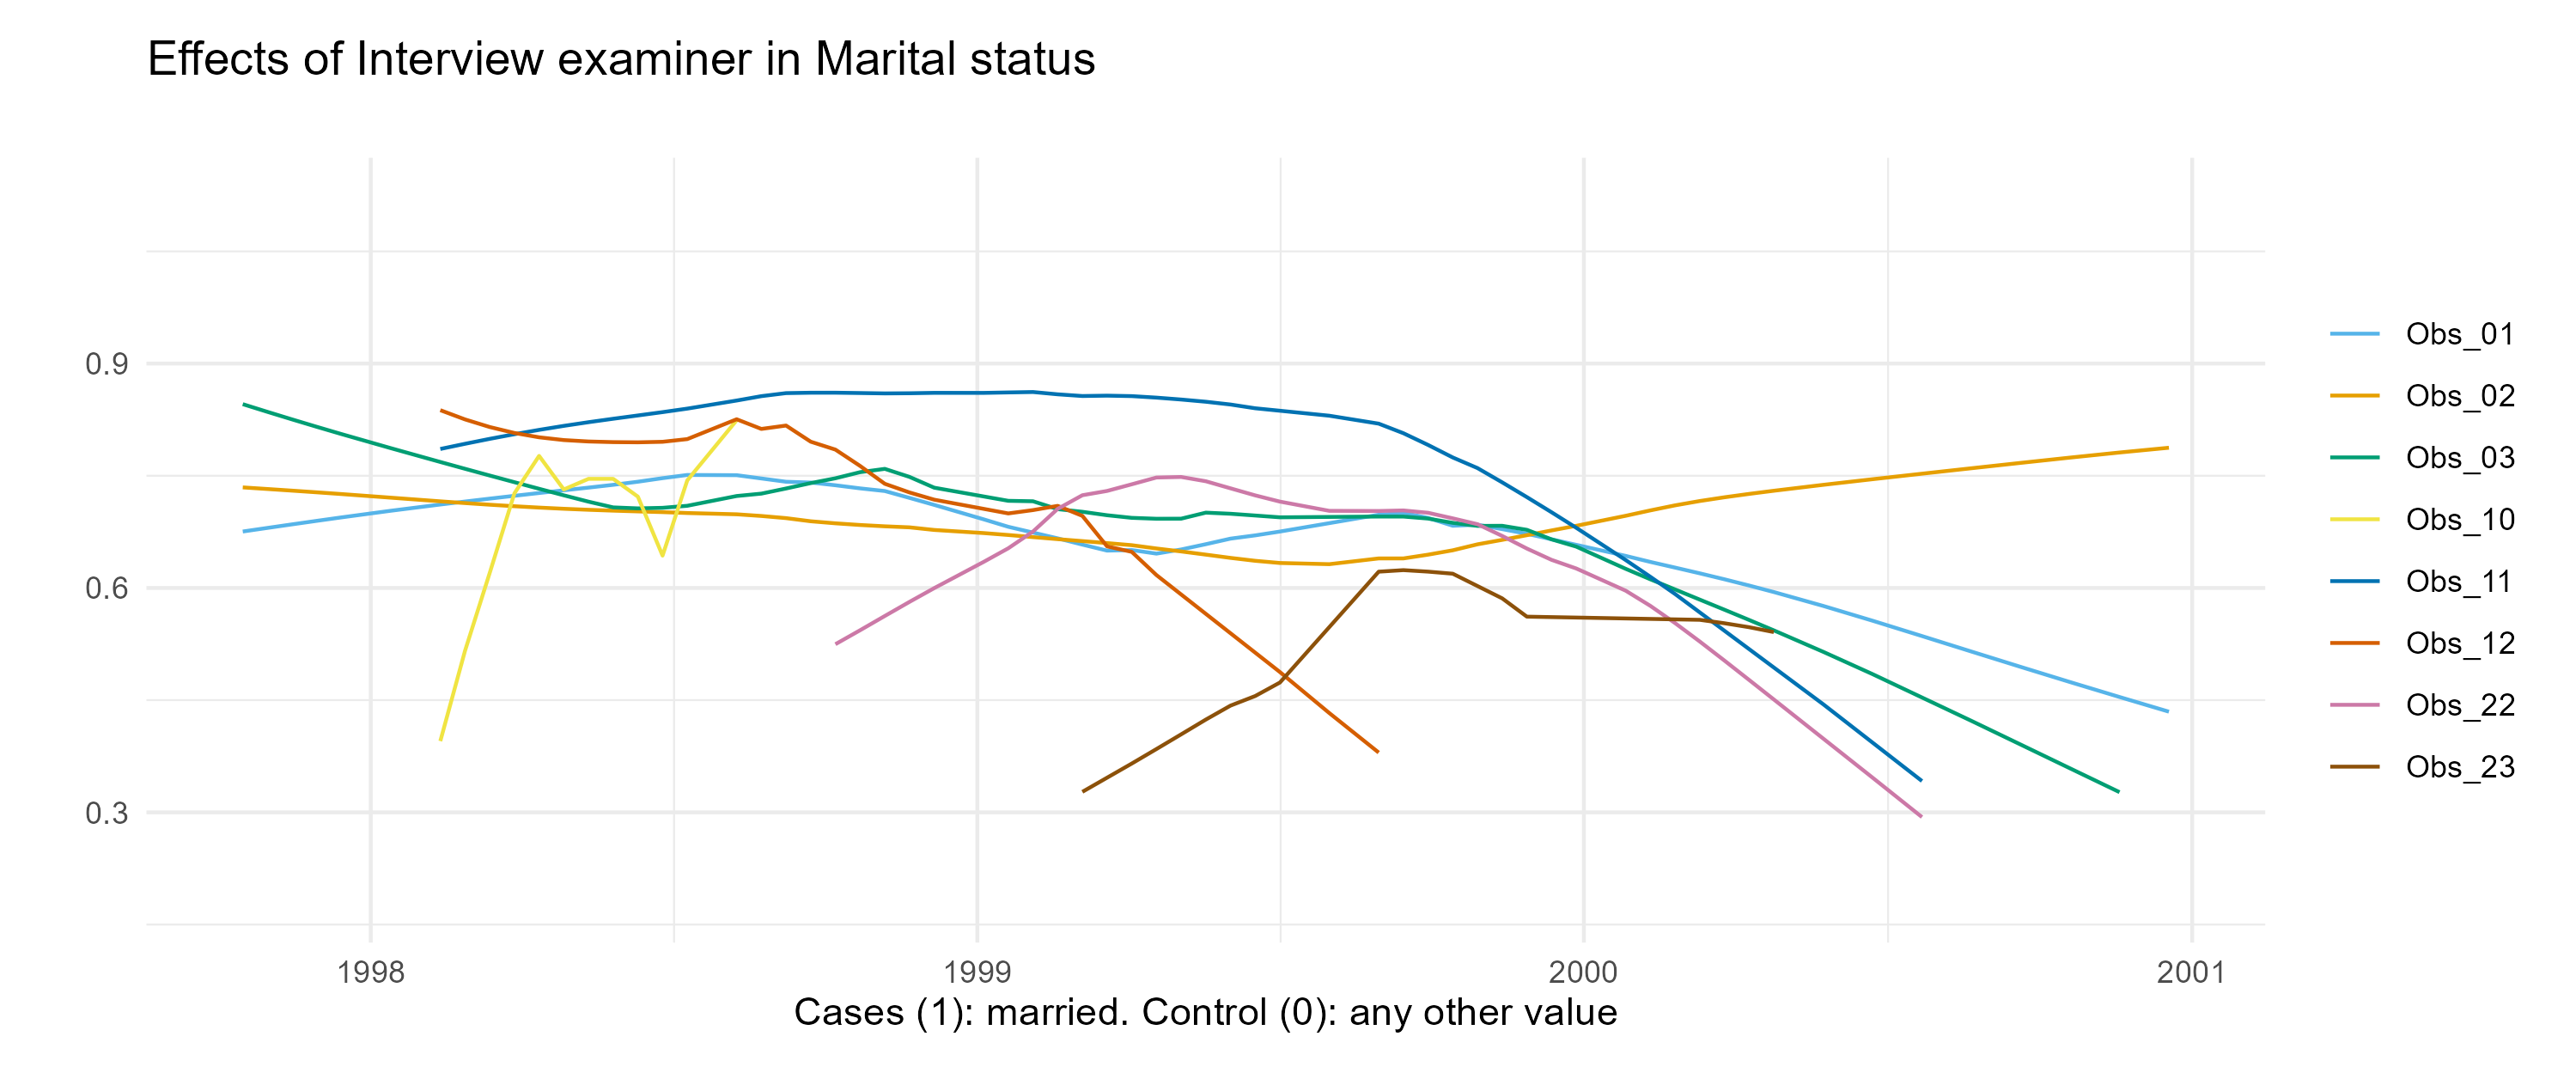
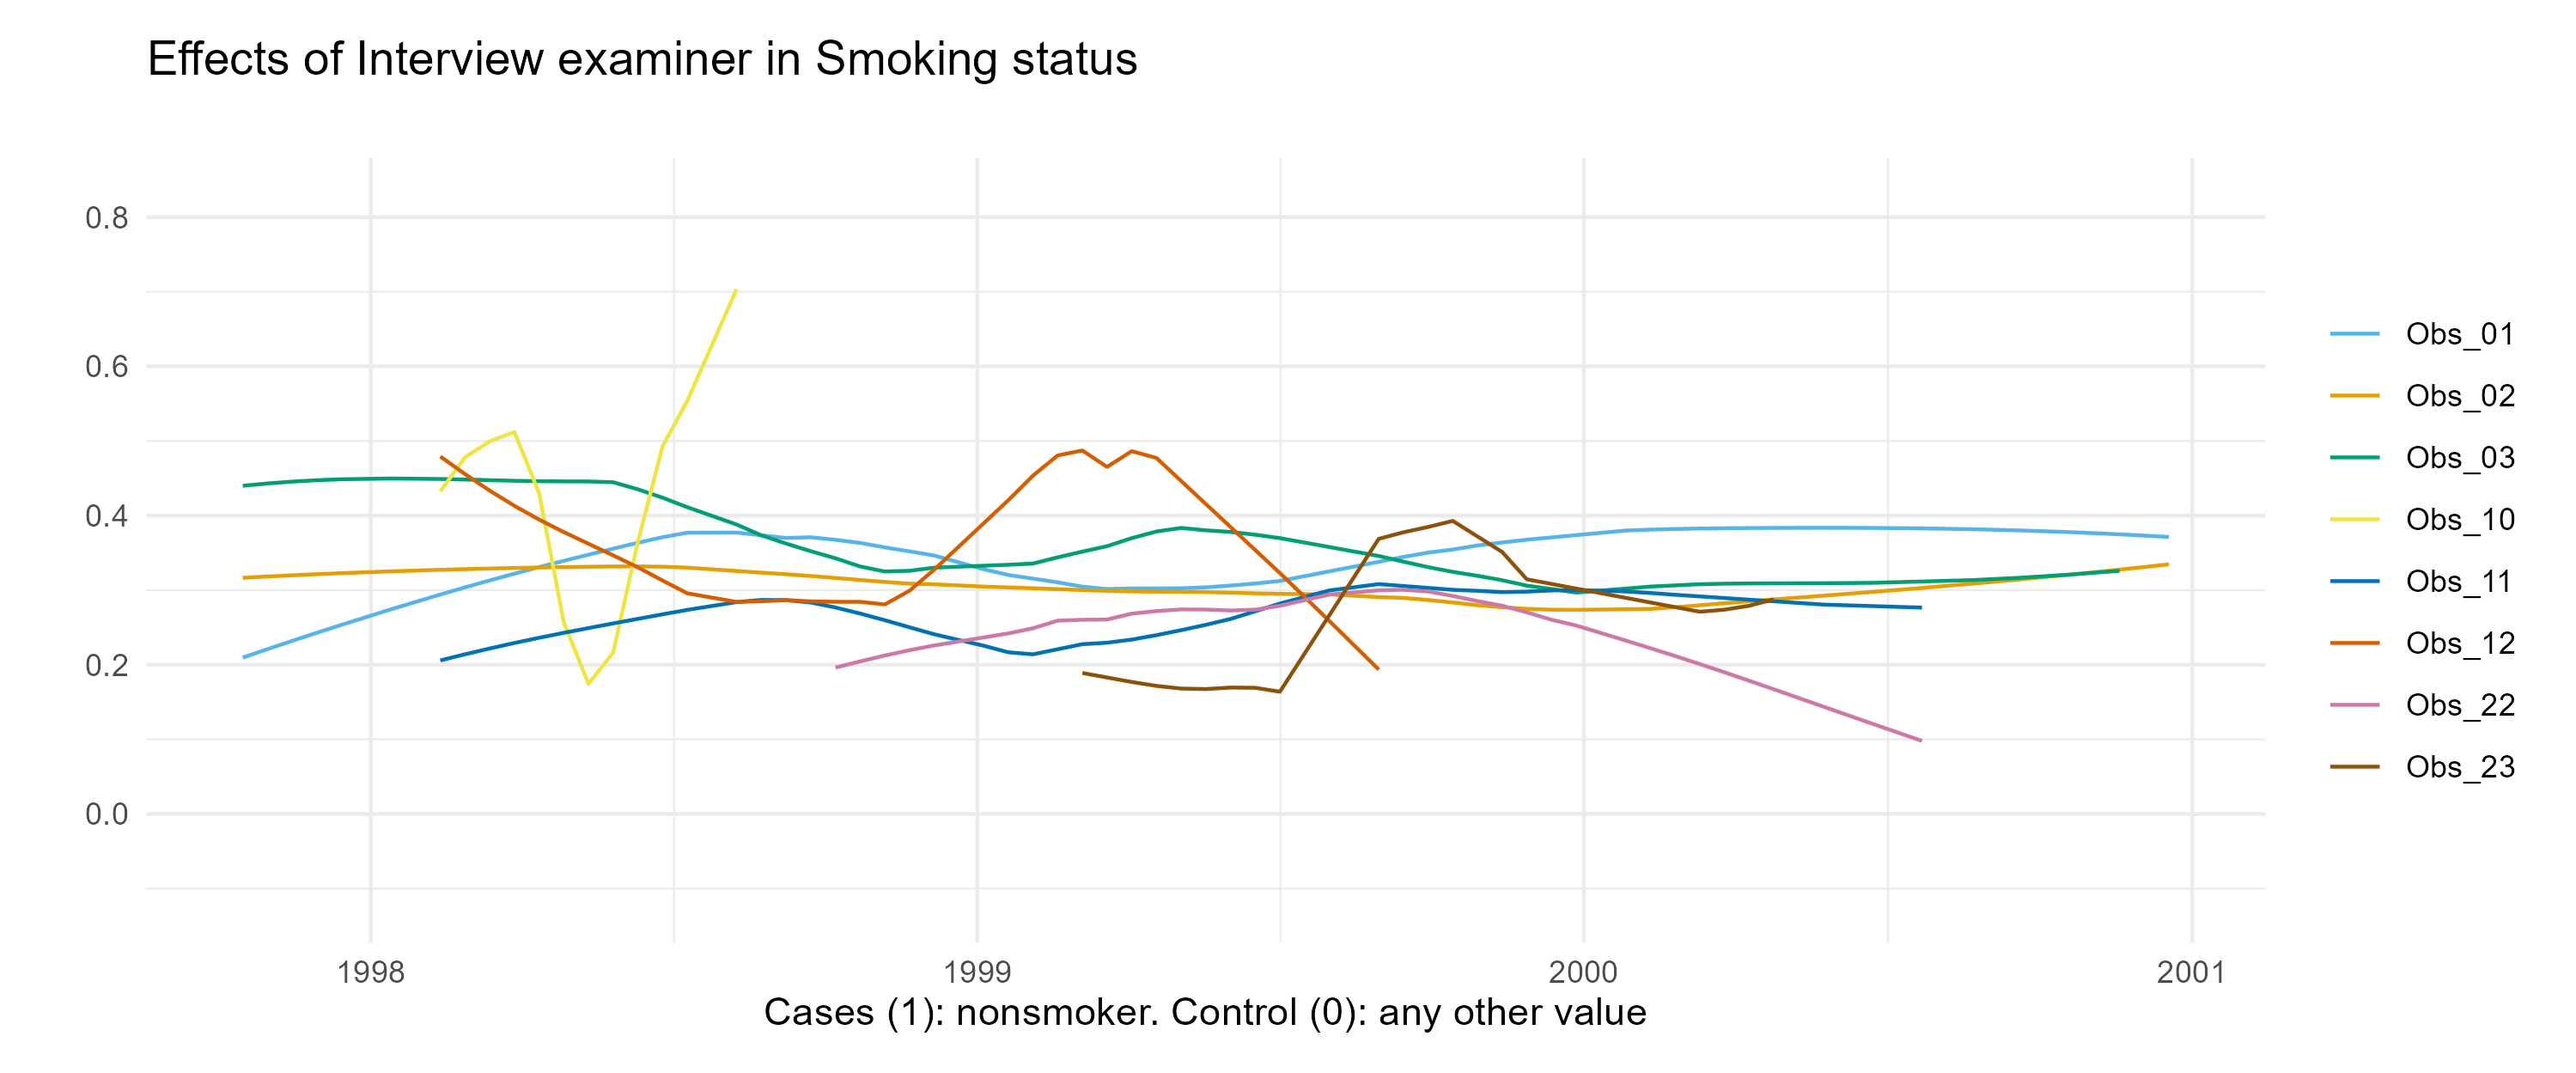
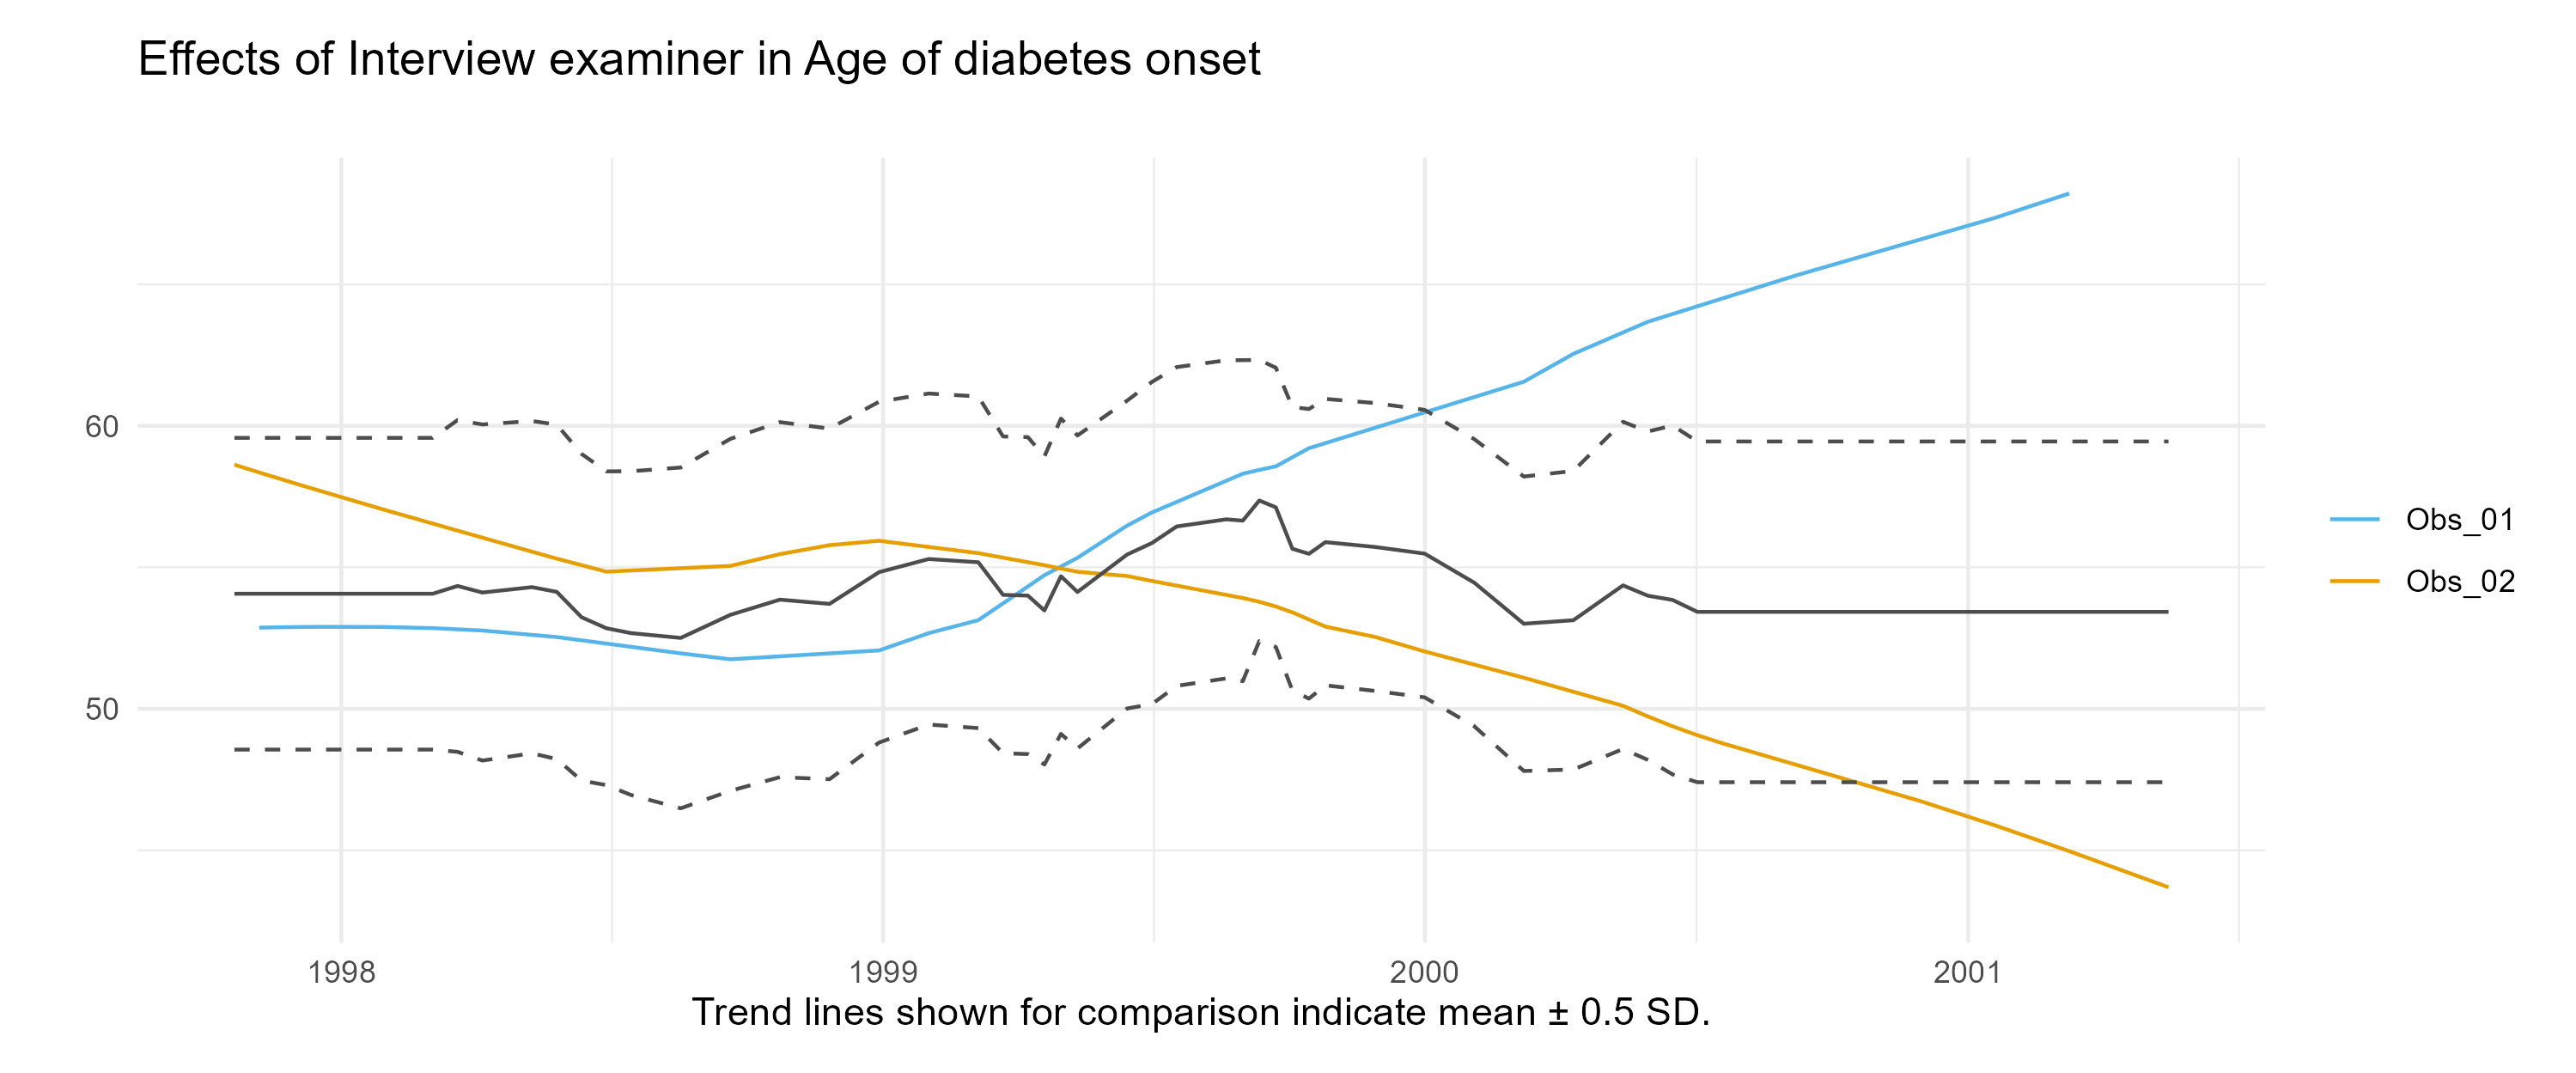
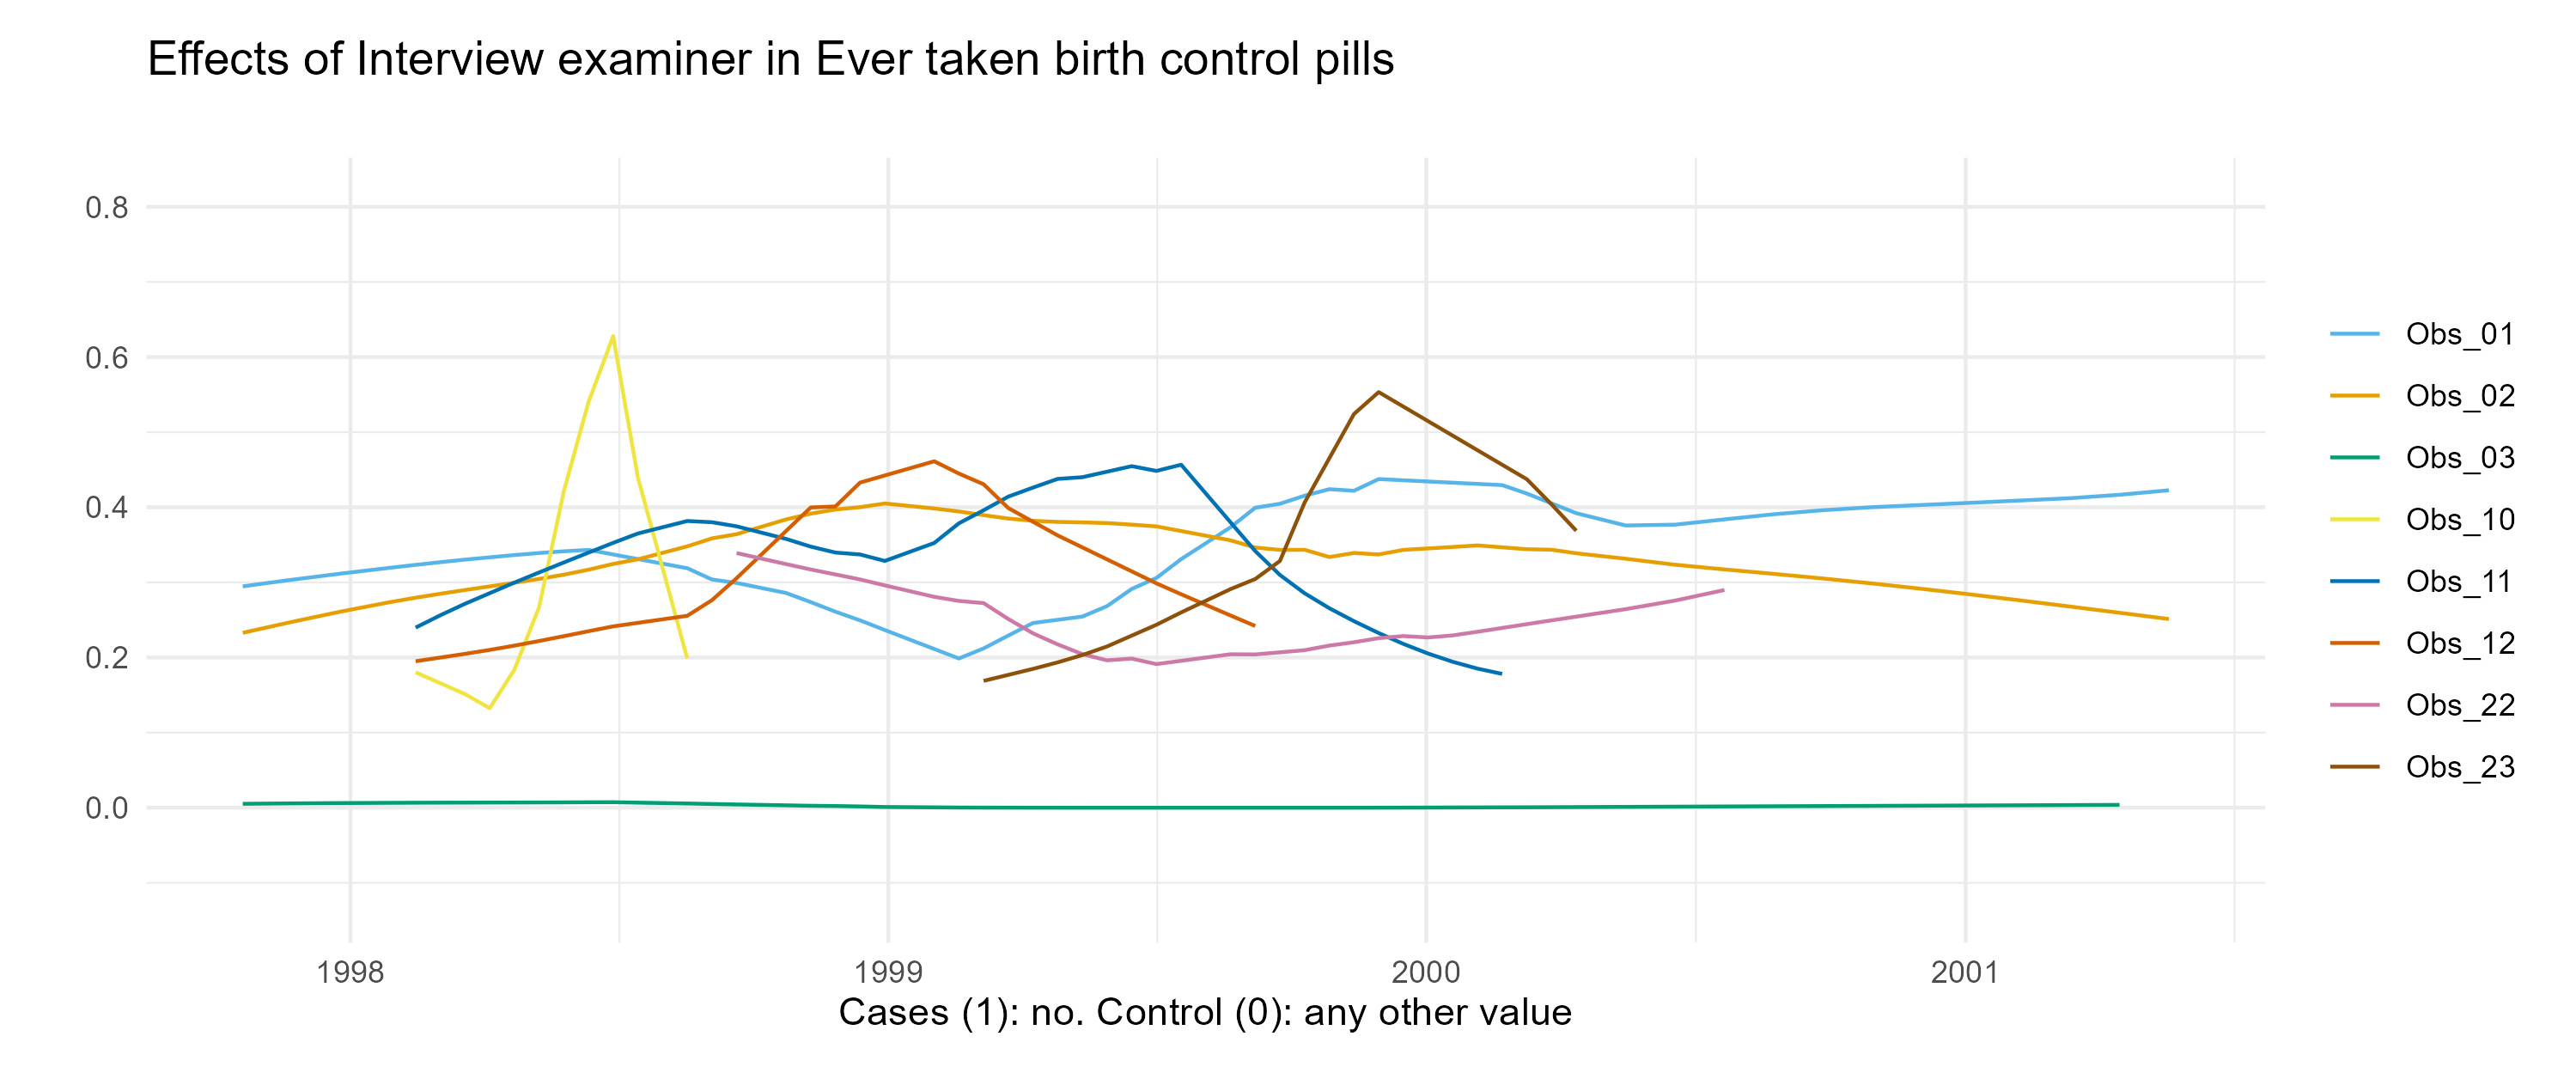
Lowess regression models are used to display time trends and potential effects of instruments used or examiners on the measurements. Background knowledge is needed to interpret the graph. Typically the further the graphs for different devices or examiners are apart from each other, the bigger the instruments or examiners effect.
- Unexpected location
- Unexpected association strength
- Unexpected association direction
- Unexpected association form
SBP_0.1
sbp1
Systolic blood pressure 1
SBP_0.2
sbp2
Systolic blood pressure 2
DBP_0.1
dbp1
Diastolic blood pressure 1
DBP_0.2
dbp2
Diastolic blood pressure 2
BODY_HEIGHT_0
height
Body height
BODY_WEIGHT_0
weight
Body weight
WAIST_CIRC_0
waist
Waist circumference
SCHOOL_GRAD_0
school
Highest educational level
RELATION_STATUS_0
family
Marital status
SMOKING_STATUS_0
smoking
Smoking status
DIAB_AGE_ONSET_0
diab_age
Age of diabetes onset
CONTRACEPTIVA_EVER_0
contraception
Ever taken birth control pills
HOUSE_INCOME_MONTH_0
income
Monthly household income