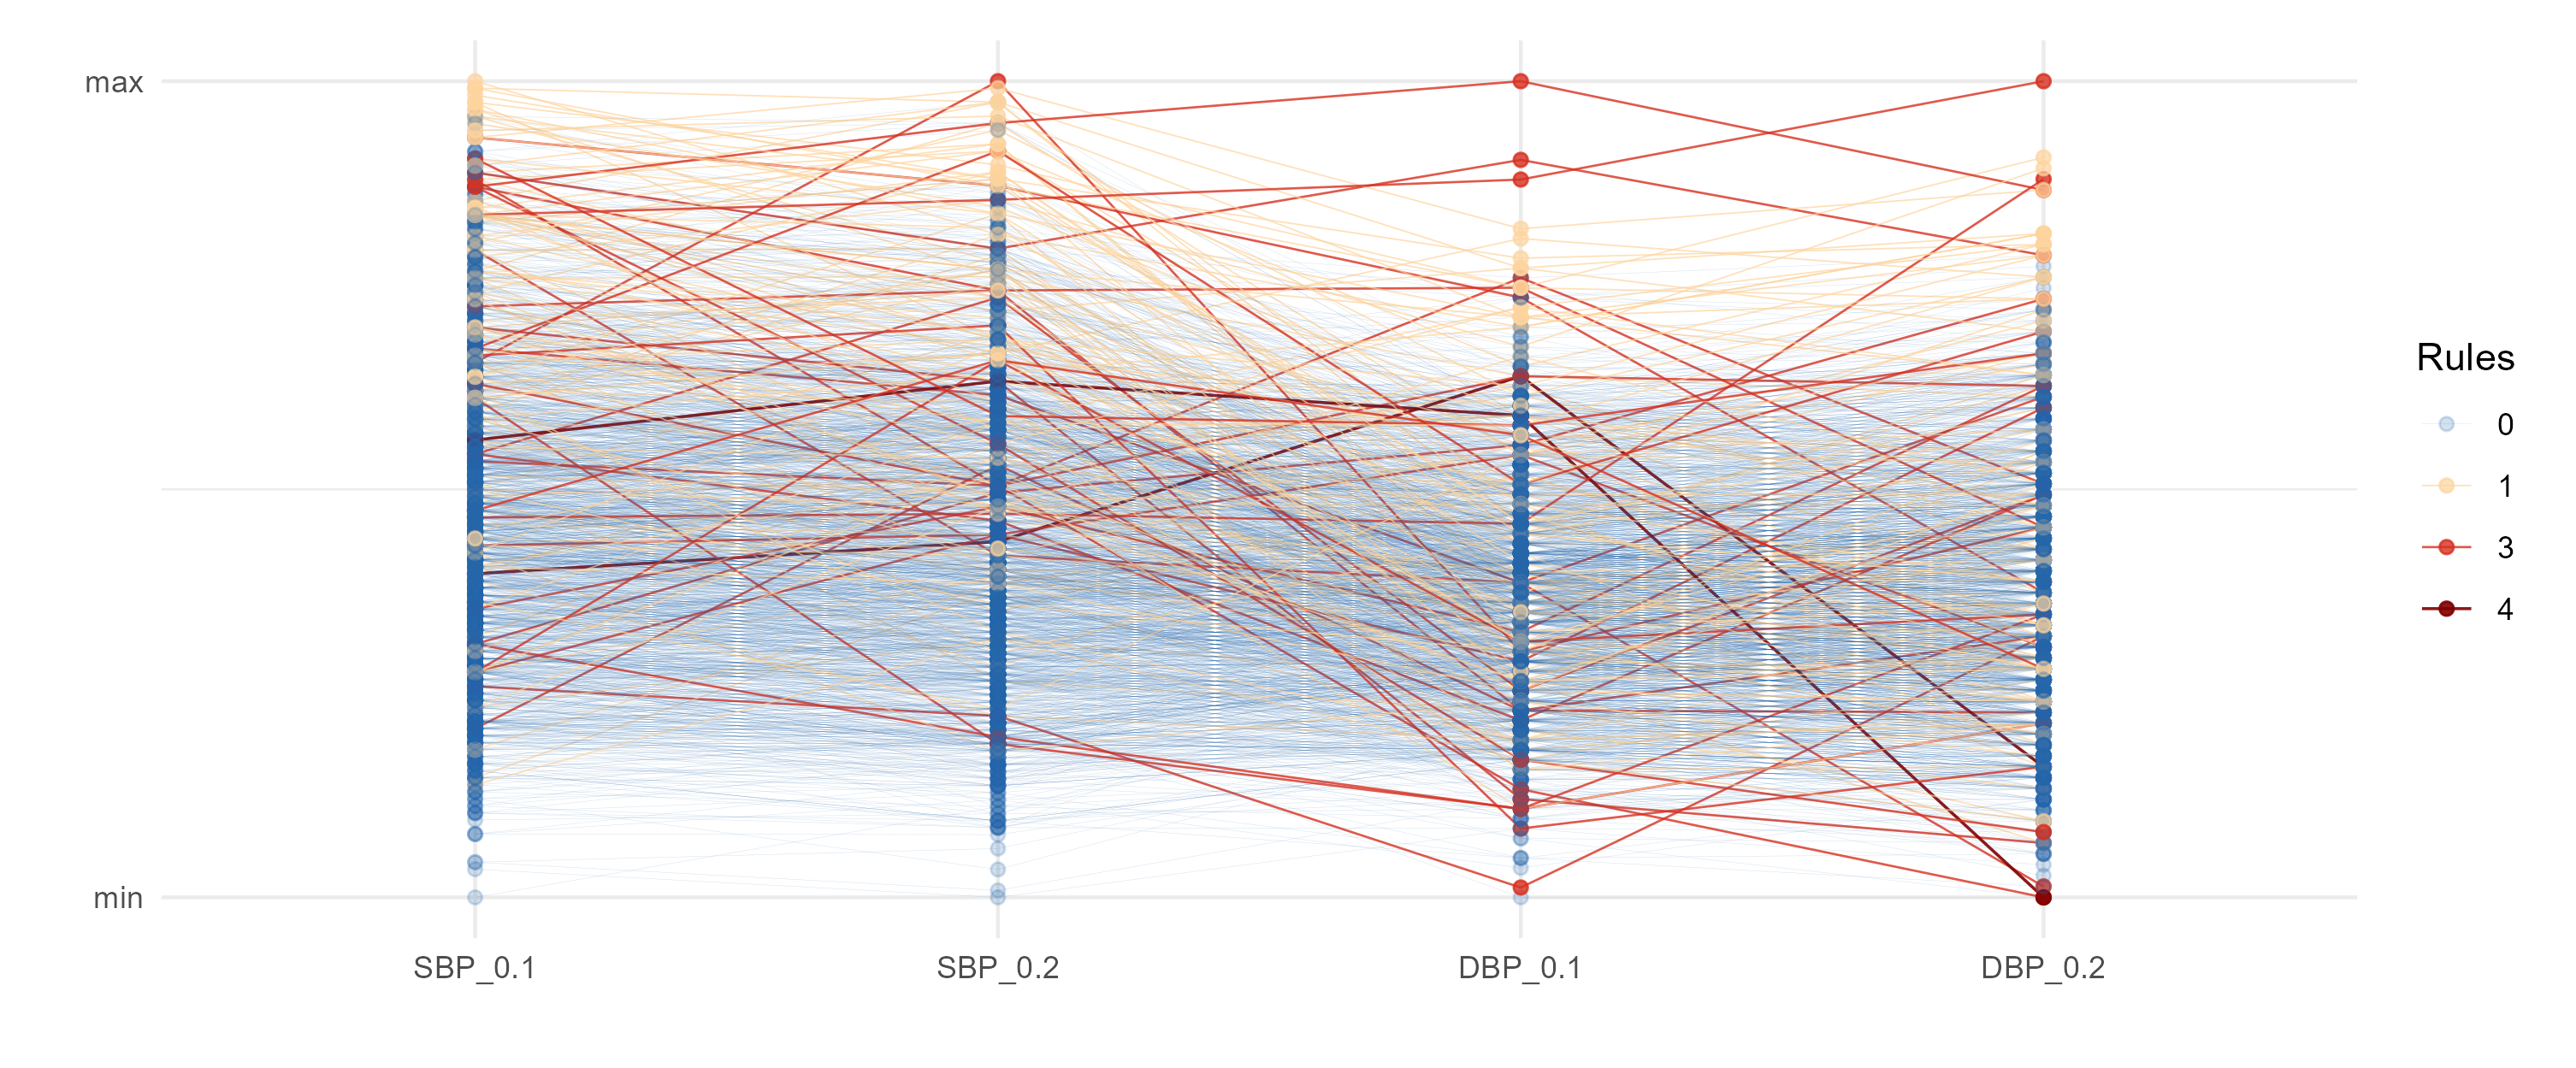
Multivariate outliers
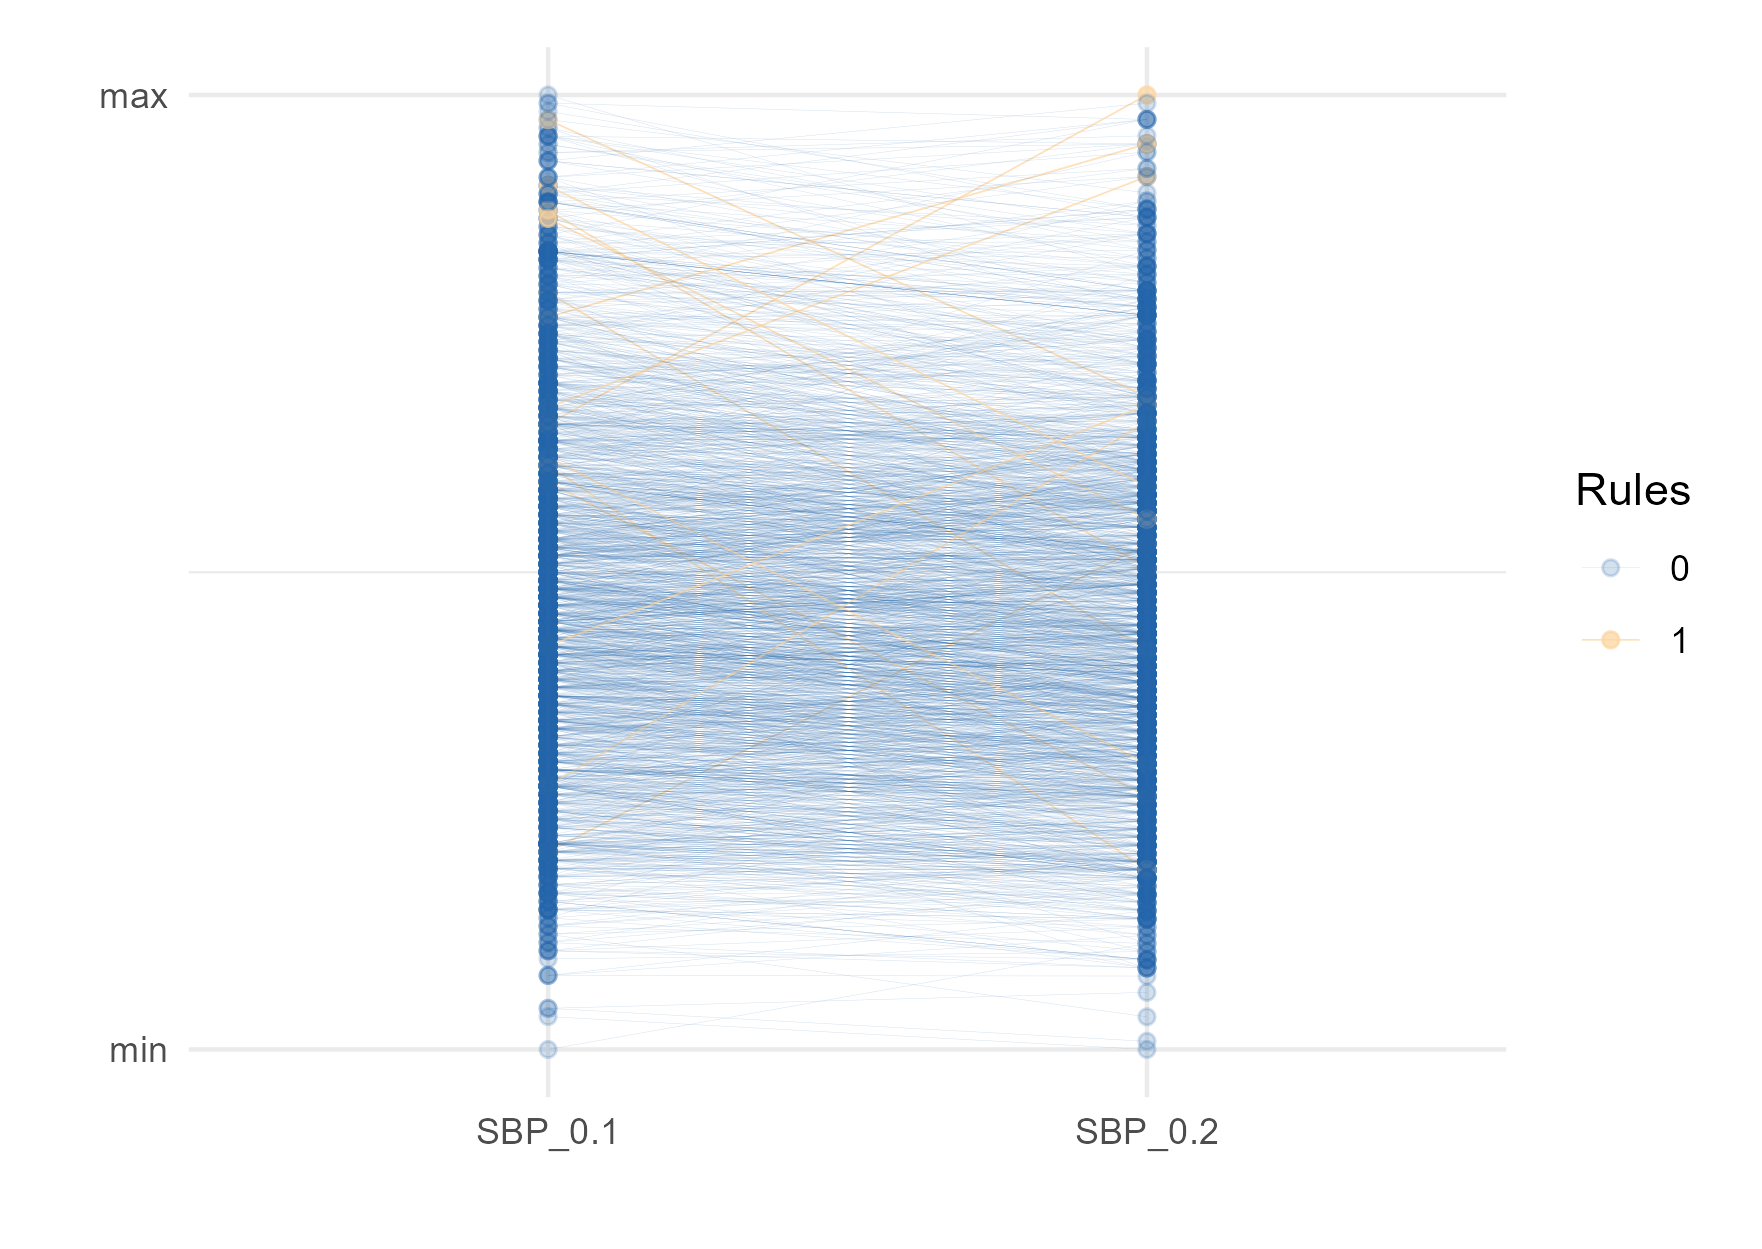
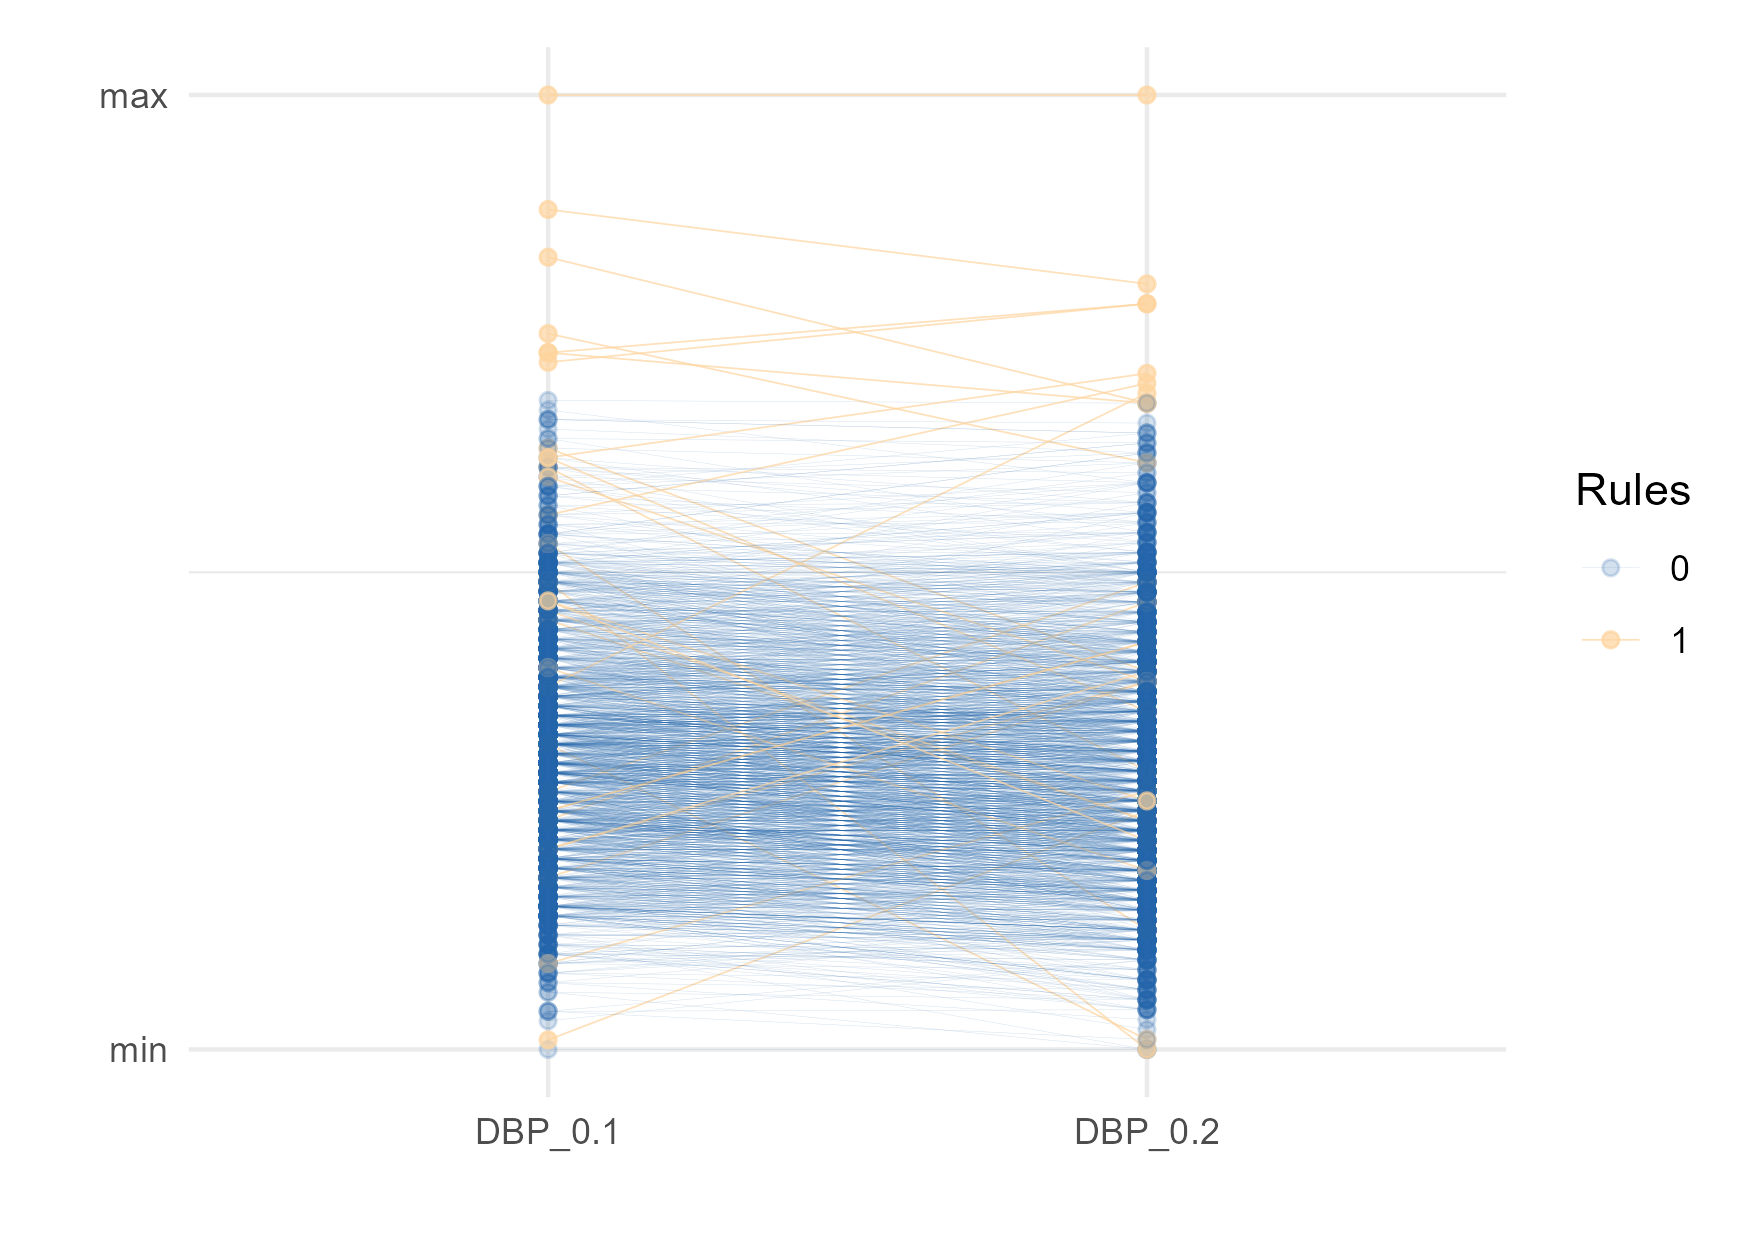
Presence of outliers in the study data is performed calculating the Mahalanobis distances first, and then using the 4 approaches for identifying univariate outliers using these distances (Tukey, 3SD, Hubert, and SigmaGap). In the plot, variables are represented on the x-axis and values on the y-axis. Paths represent observational units and they are coloured depending on the number of outlier rules violated by the unit.
The higher the number of assumed outliers, the lower potentially the data quality.
Note: the presence of an outlier does not necessarily reflects a data quality issue.
Systolic blood pressure checks
Diastolic blood pressure checks
Blood pressure checks