Distribution (Categorical)
The higher the number of variables with unexpected location or proportions, the lower the data quality. Deviations from the expected central tendency or unexpected proportions might indicate data issues and should be further investigated. There is no formal interpretation rule for the histograms and bar plots; expert background knowledge on expected distribution of the targeted outcome variable in the studied sample is necessary.
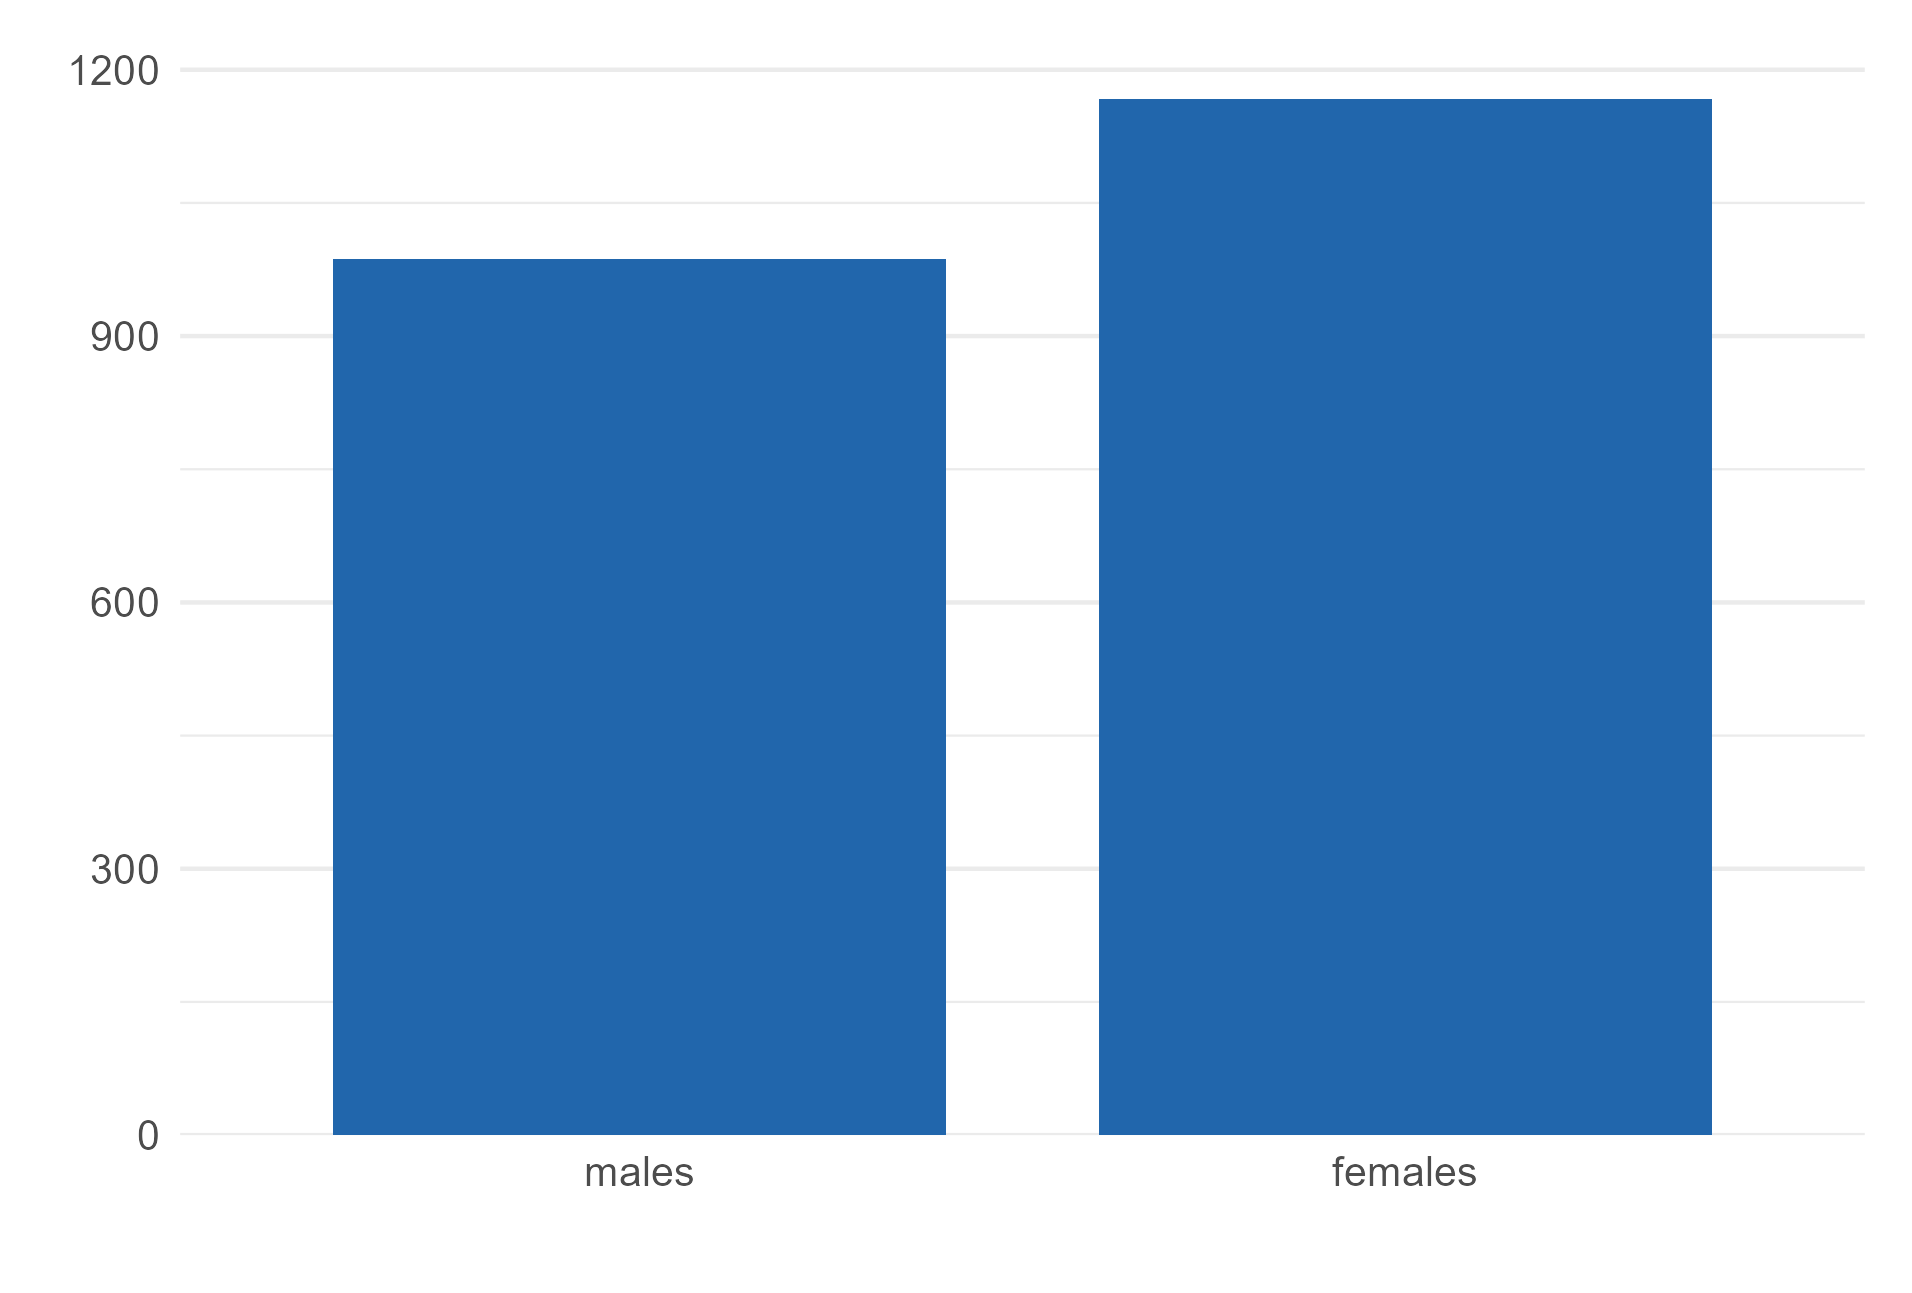
SEX_0
sex
Sex
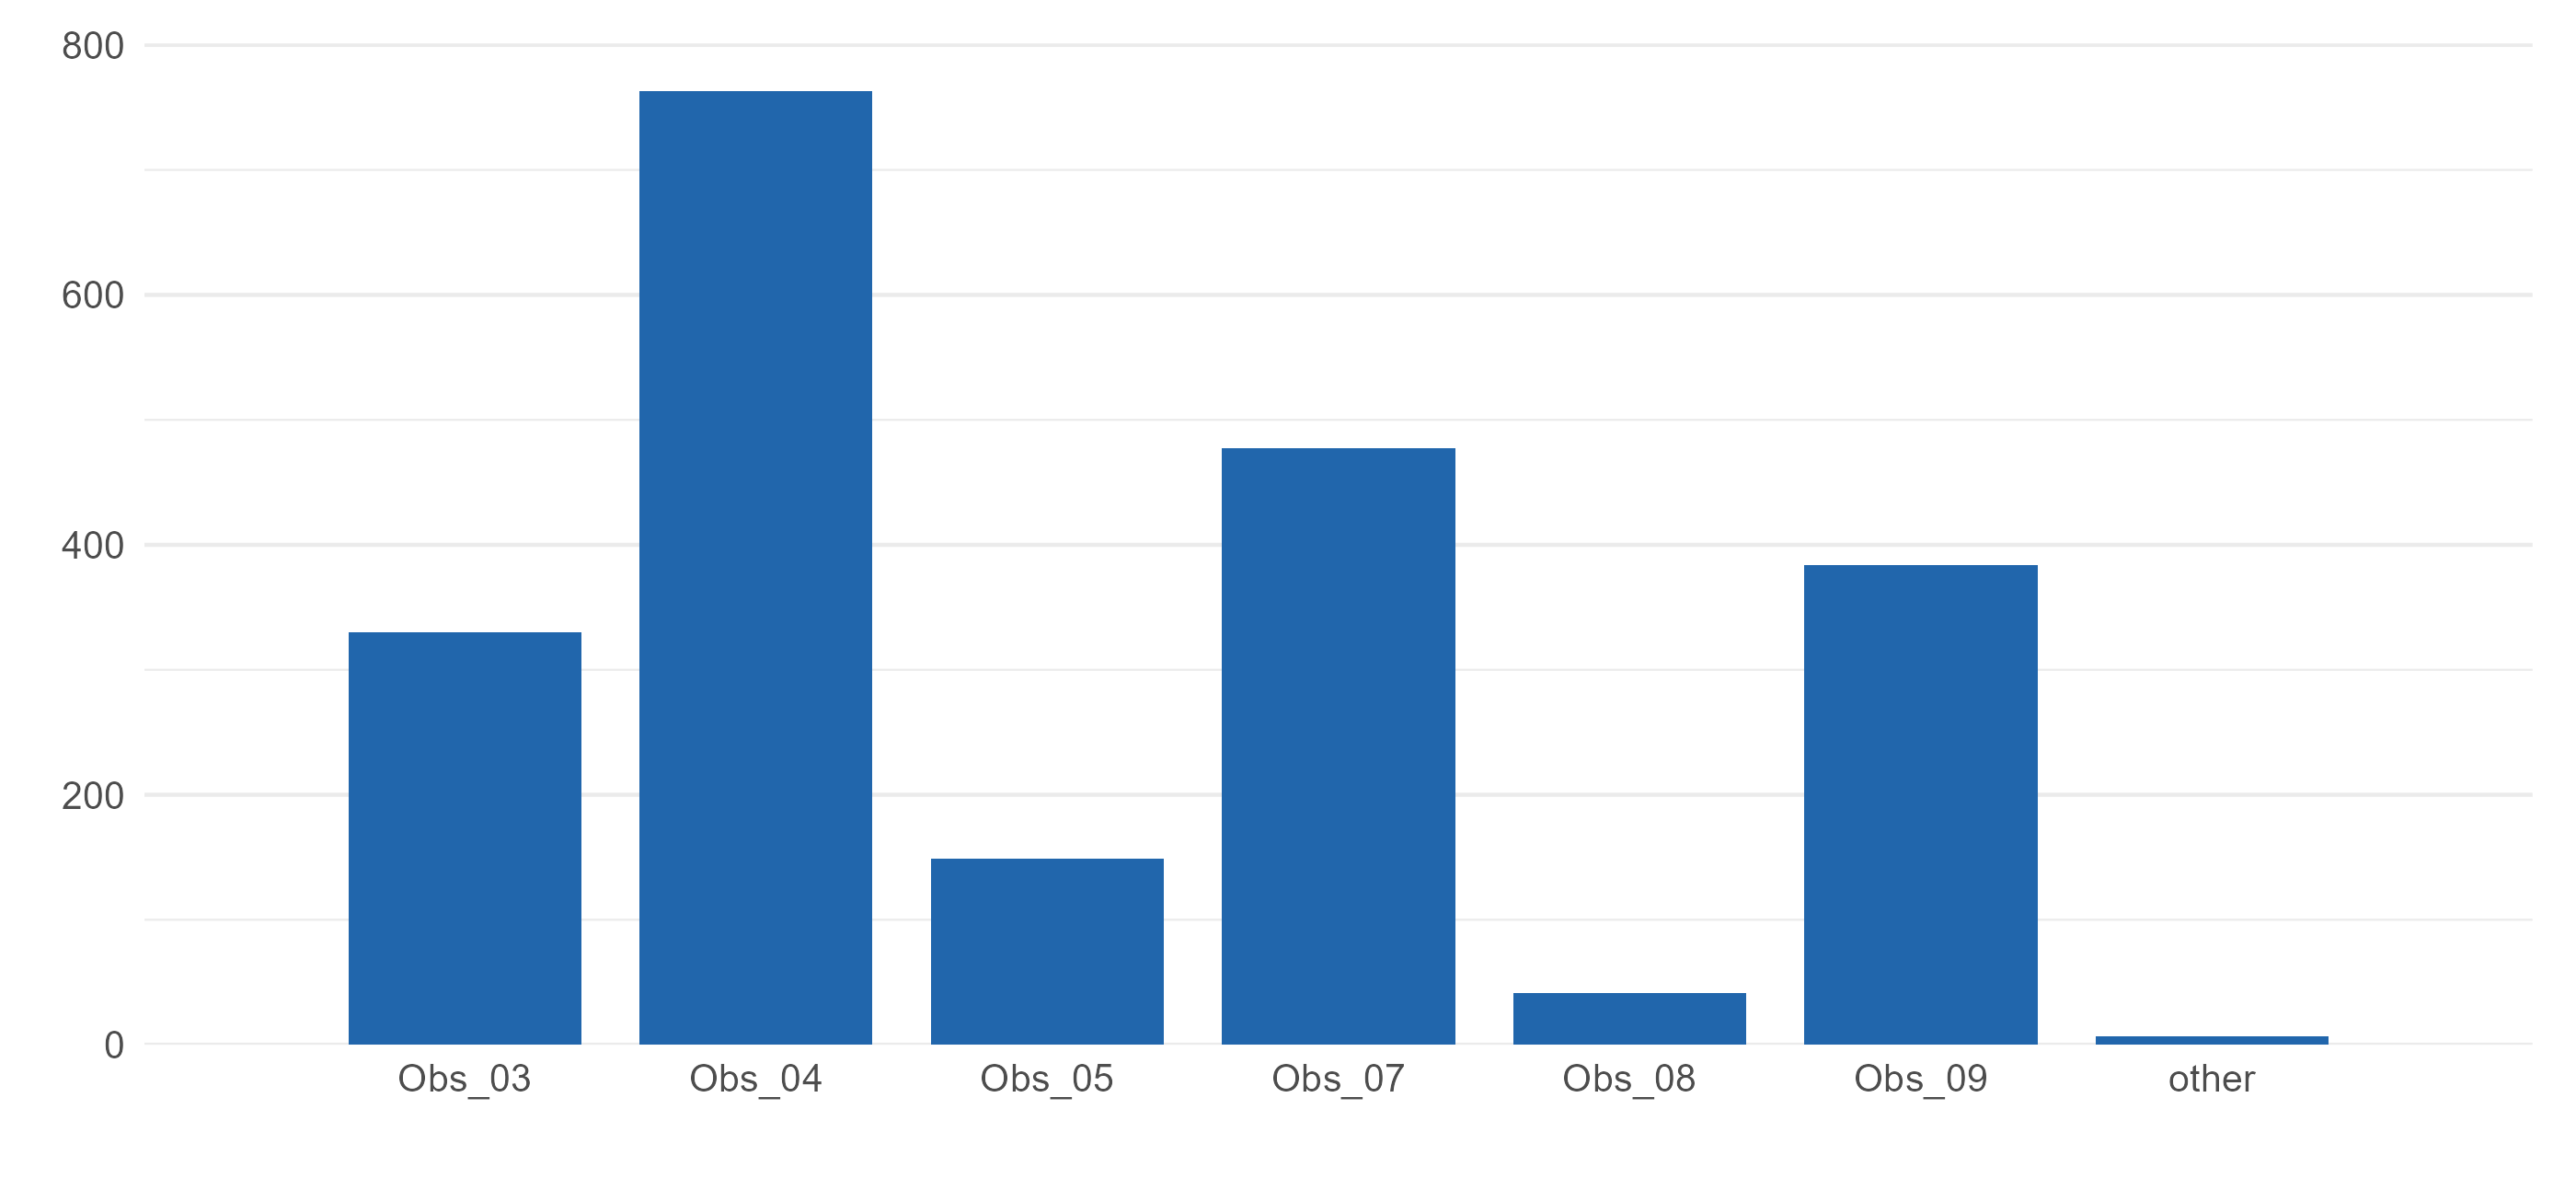
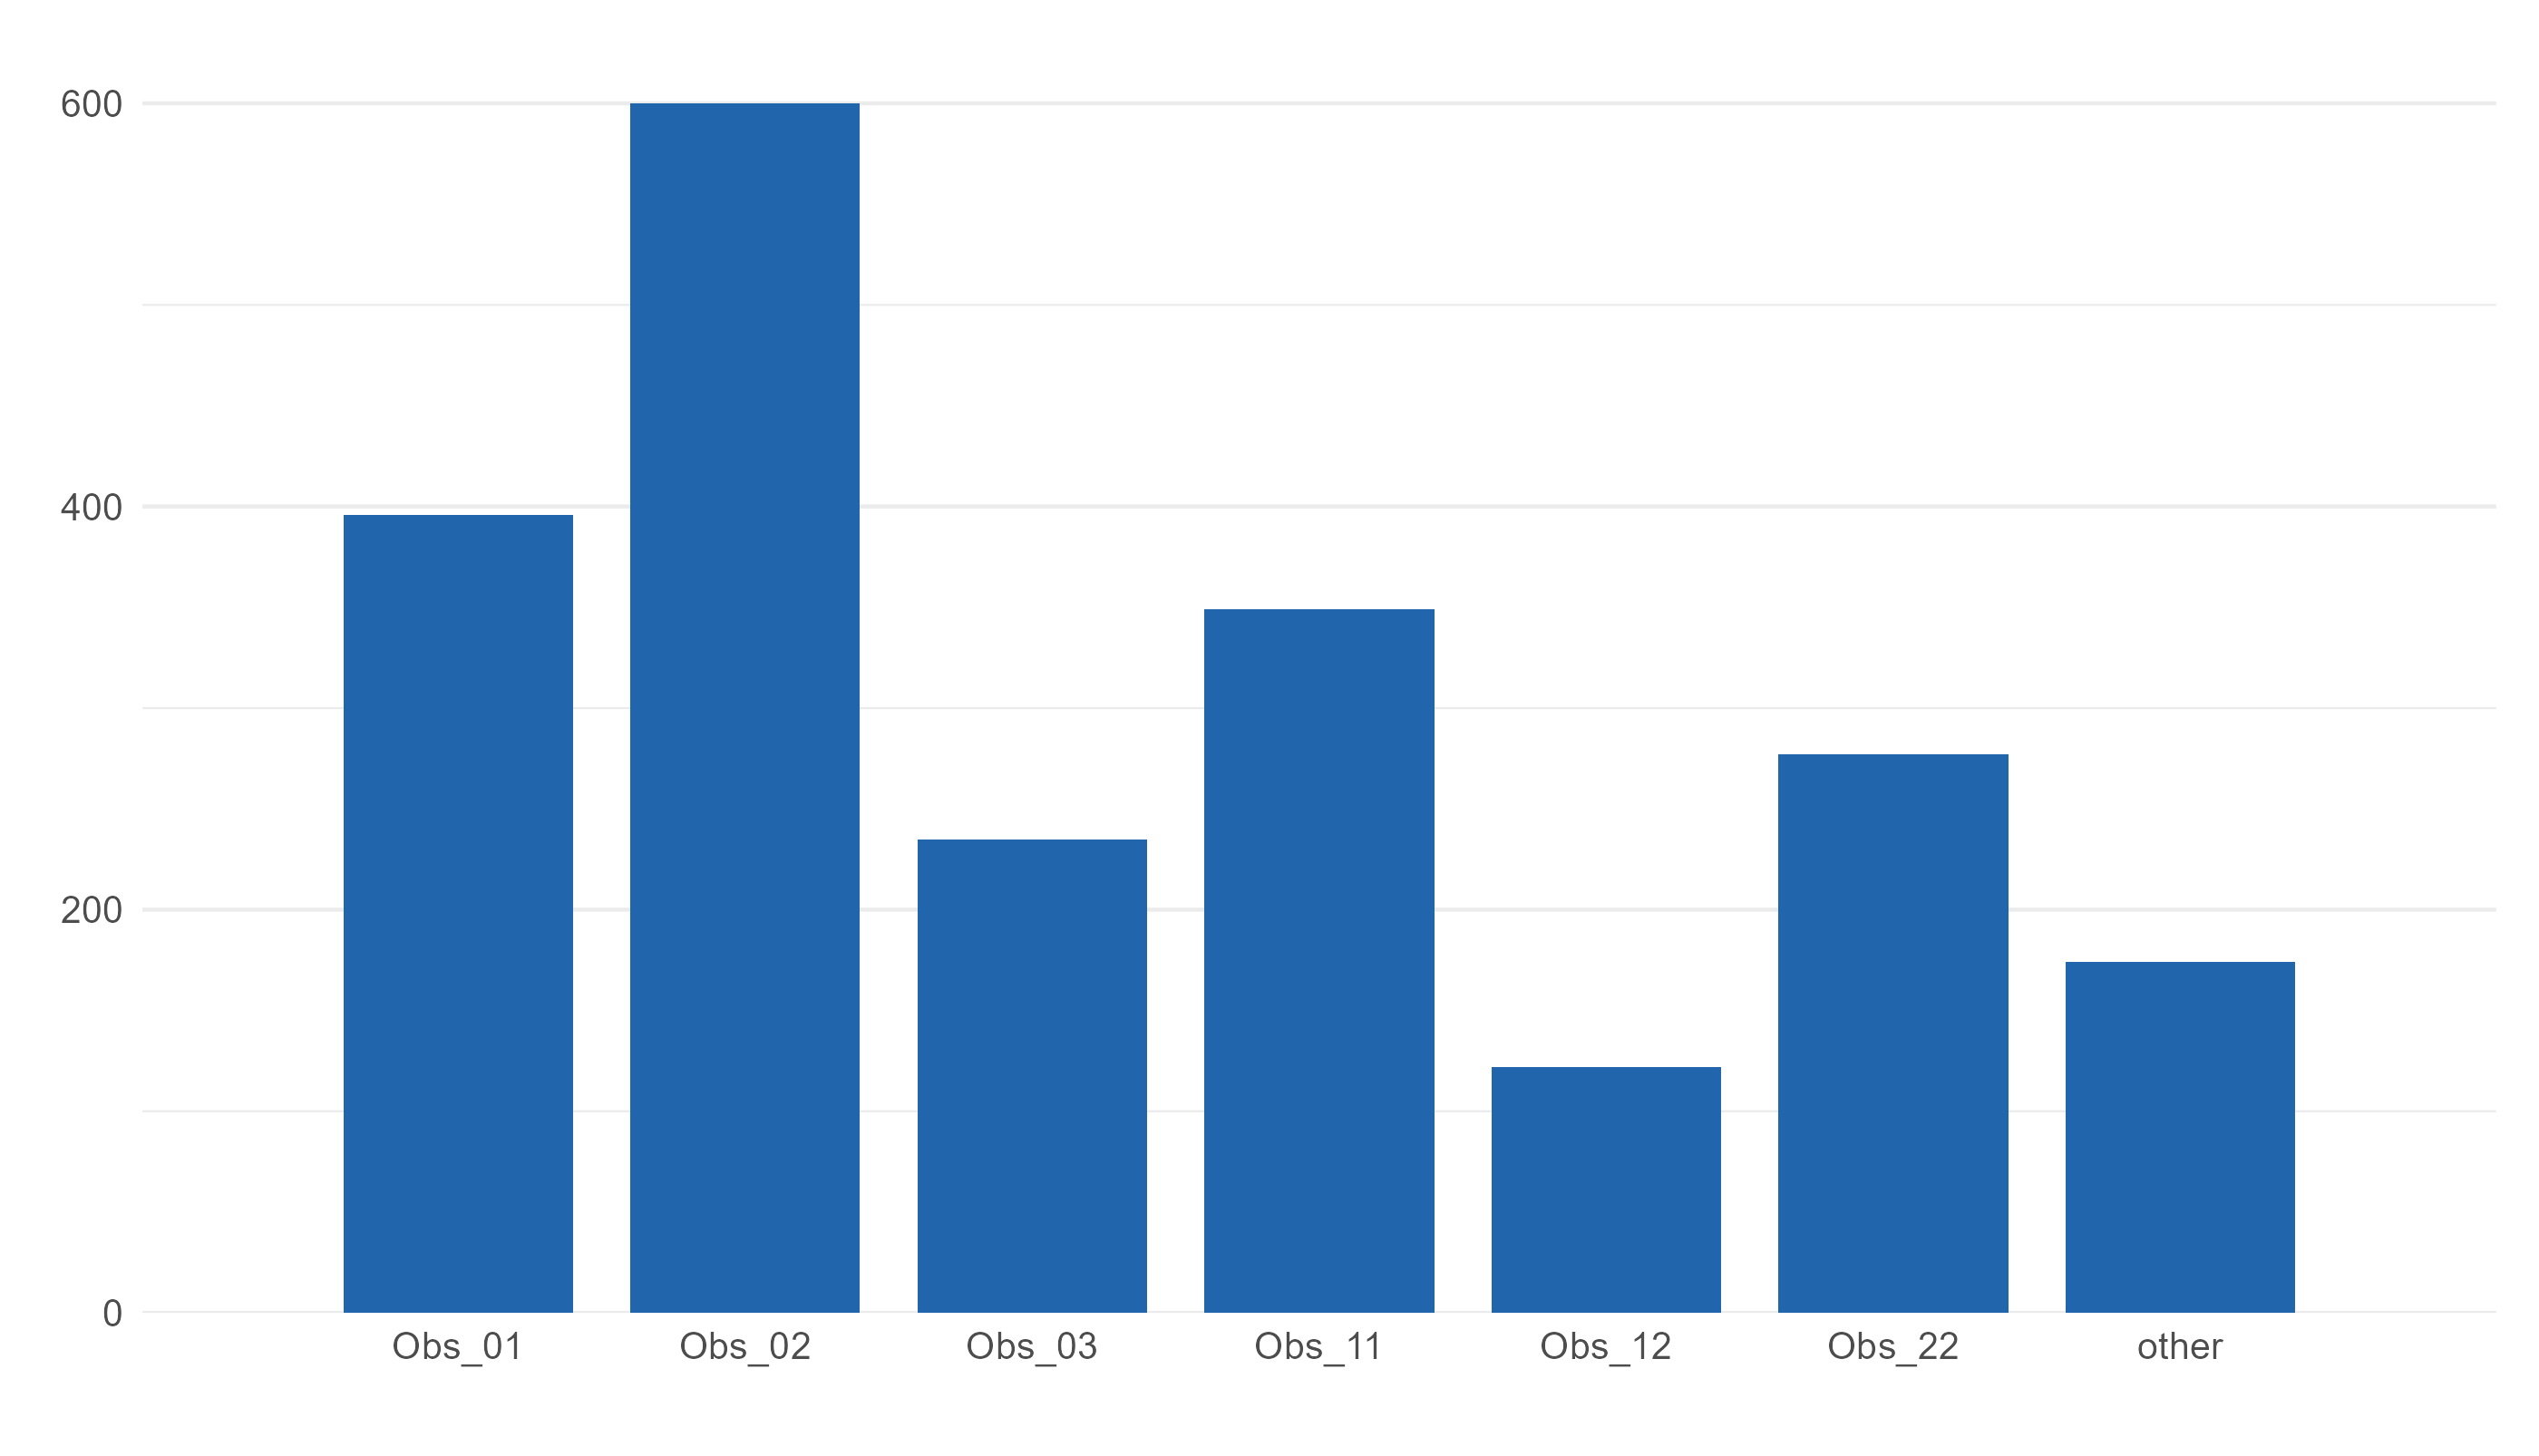
OBS_BP_0
obs_bp
Blood pressure examiner
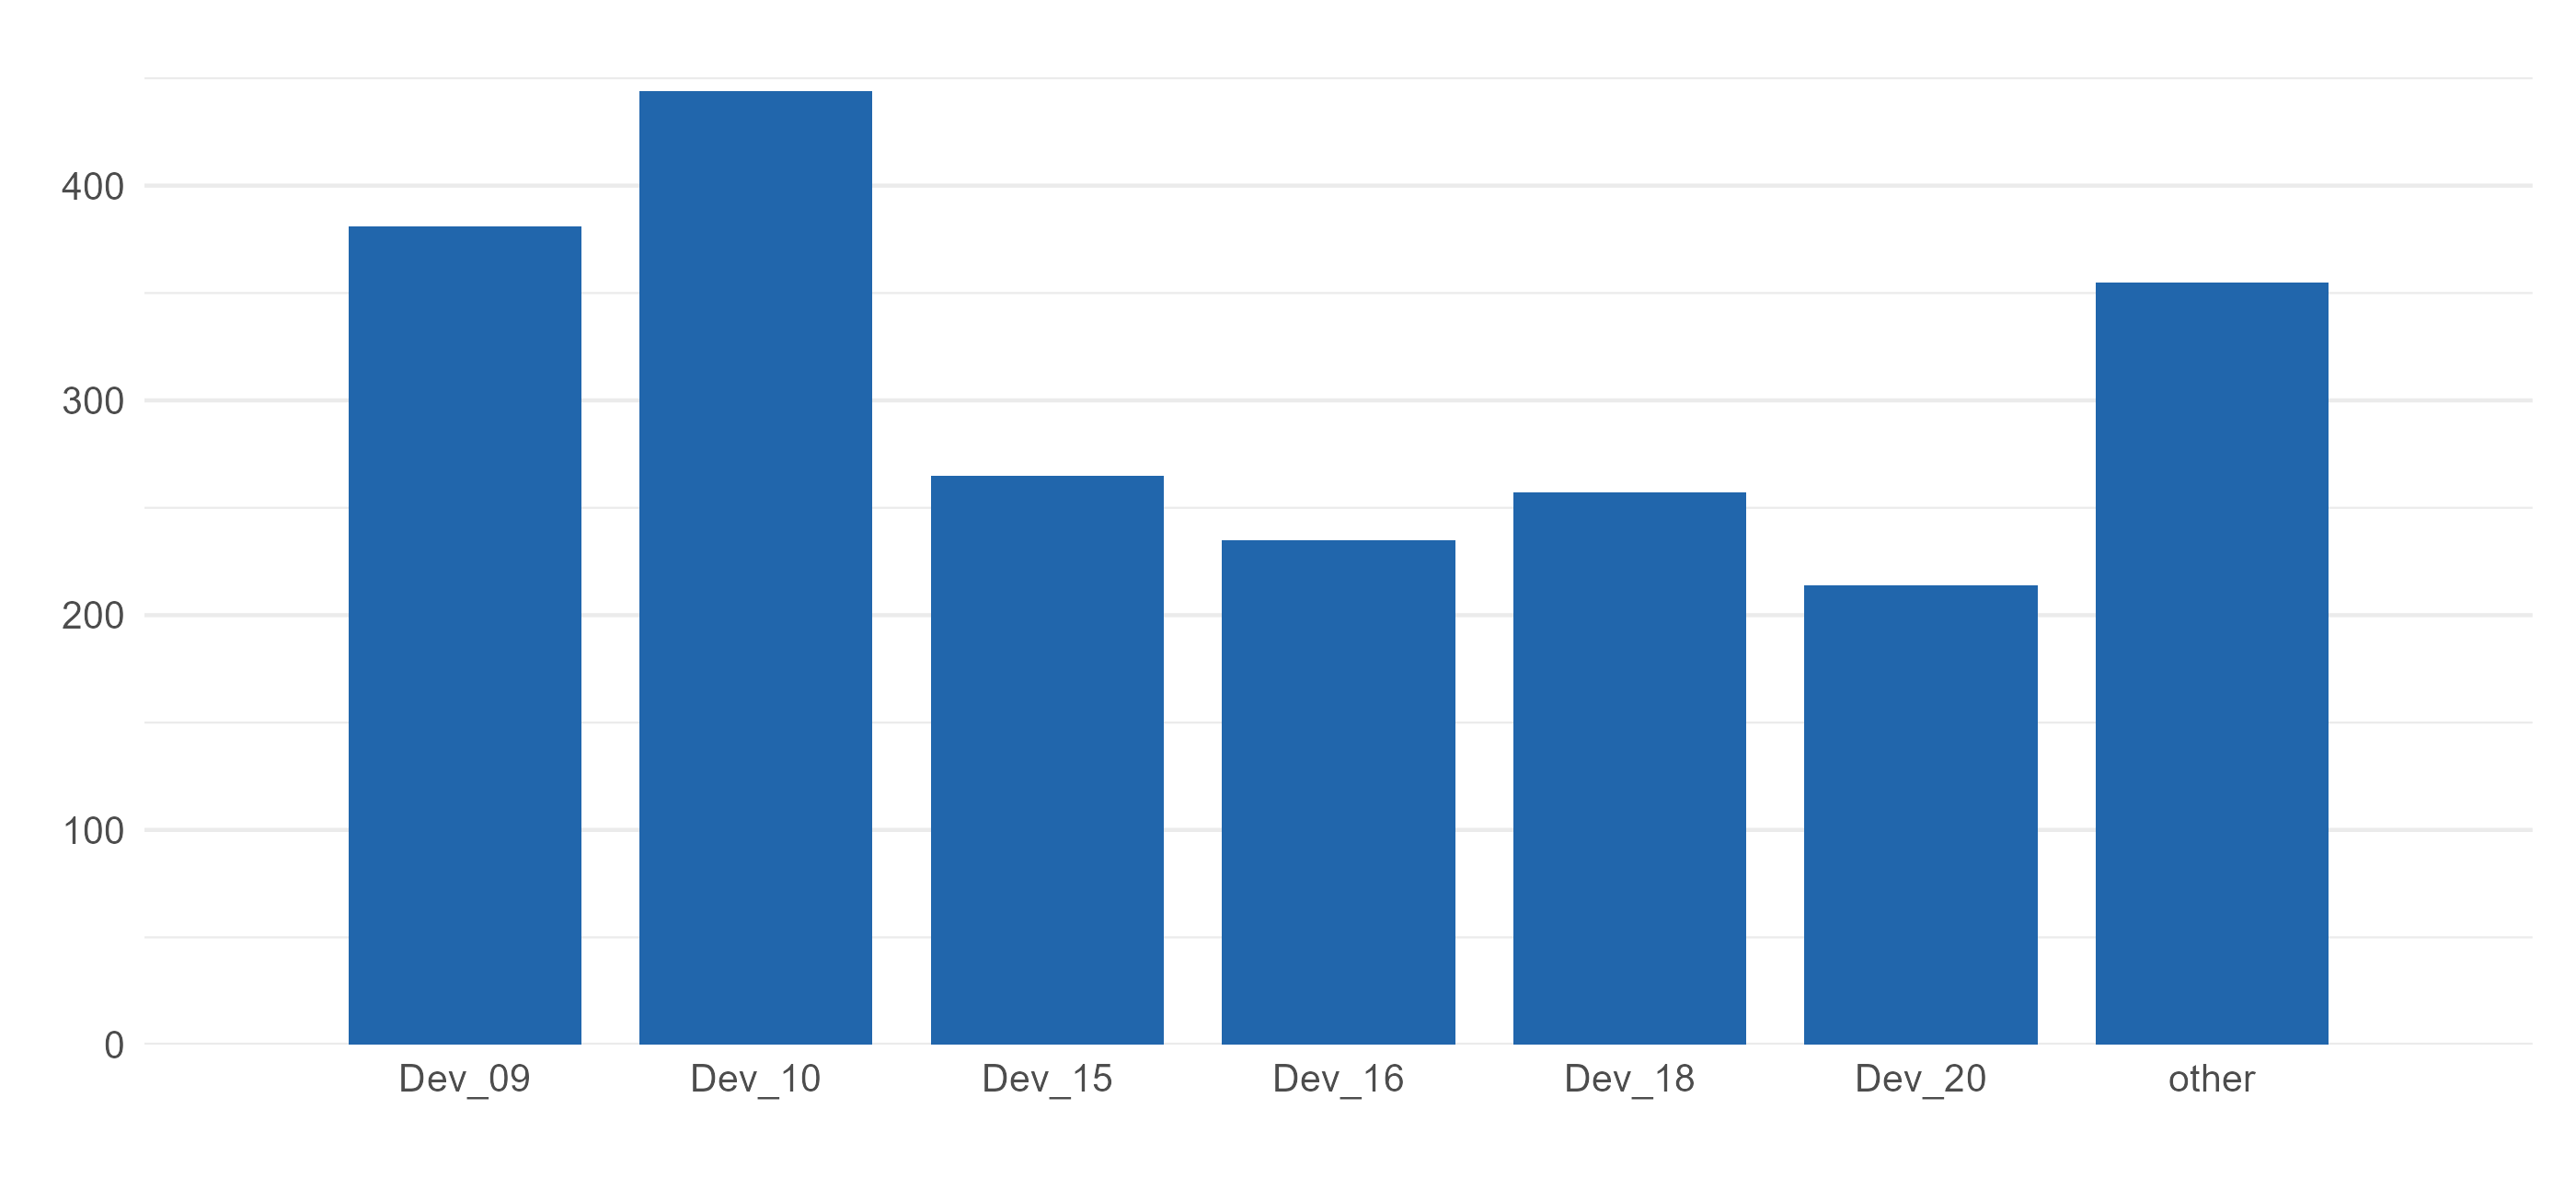
DEV_BP_0
dev_bp
Blood pressure device ID
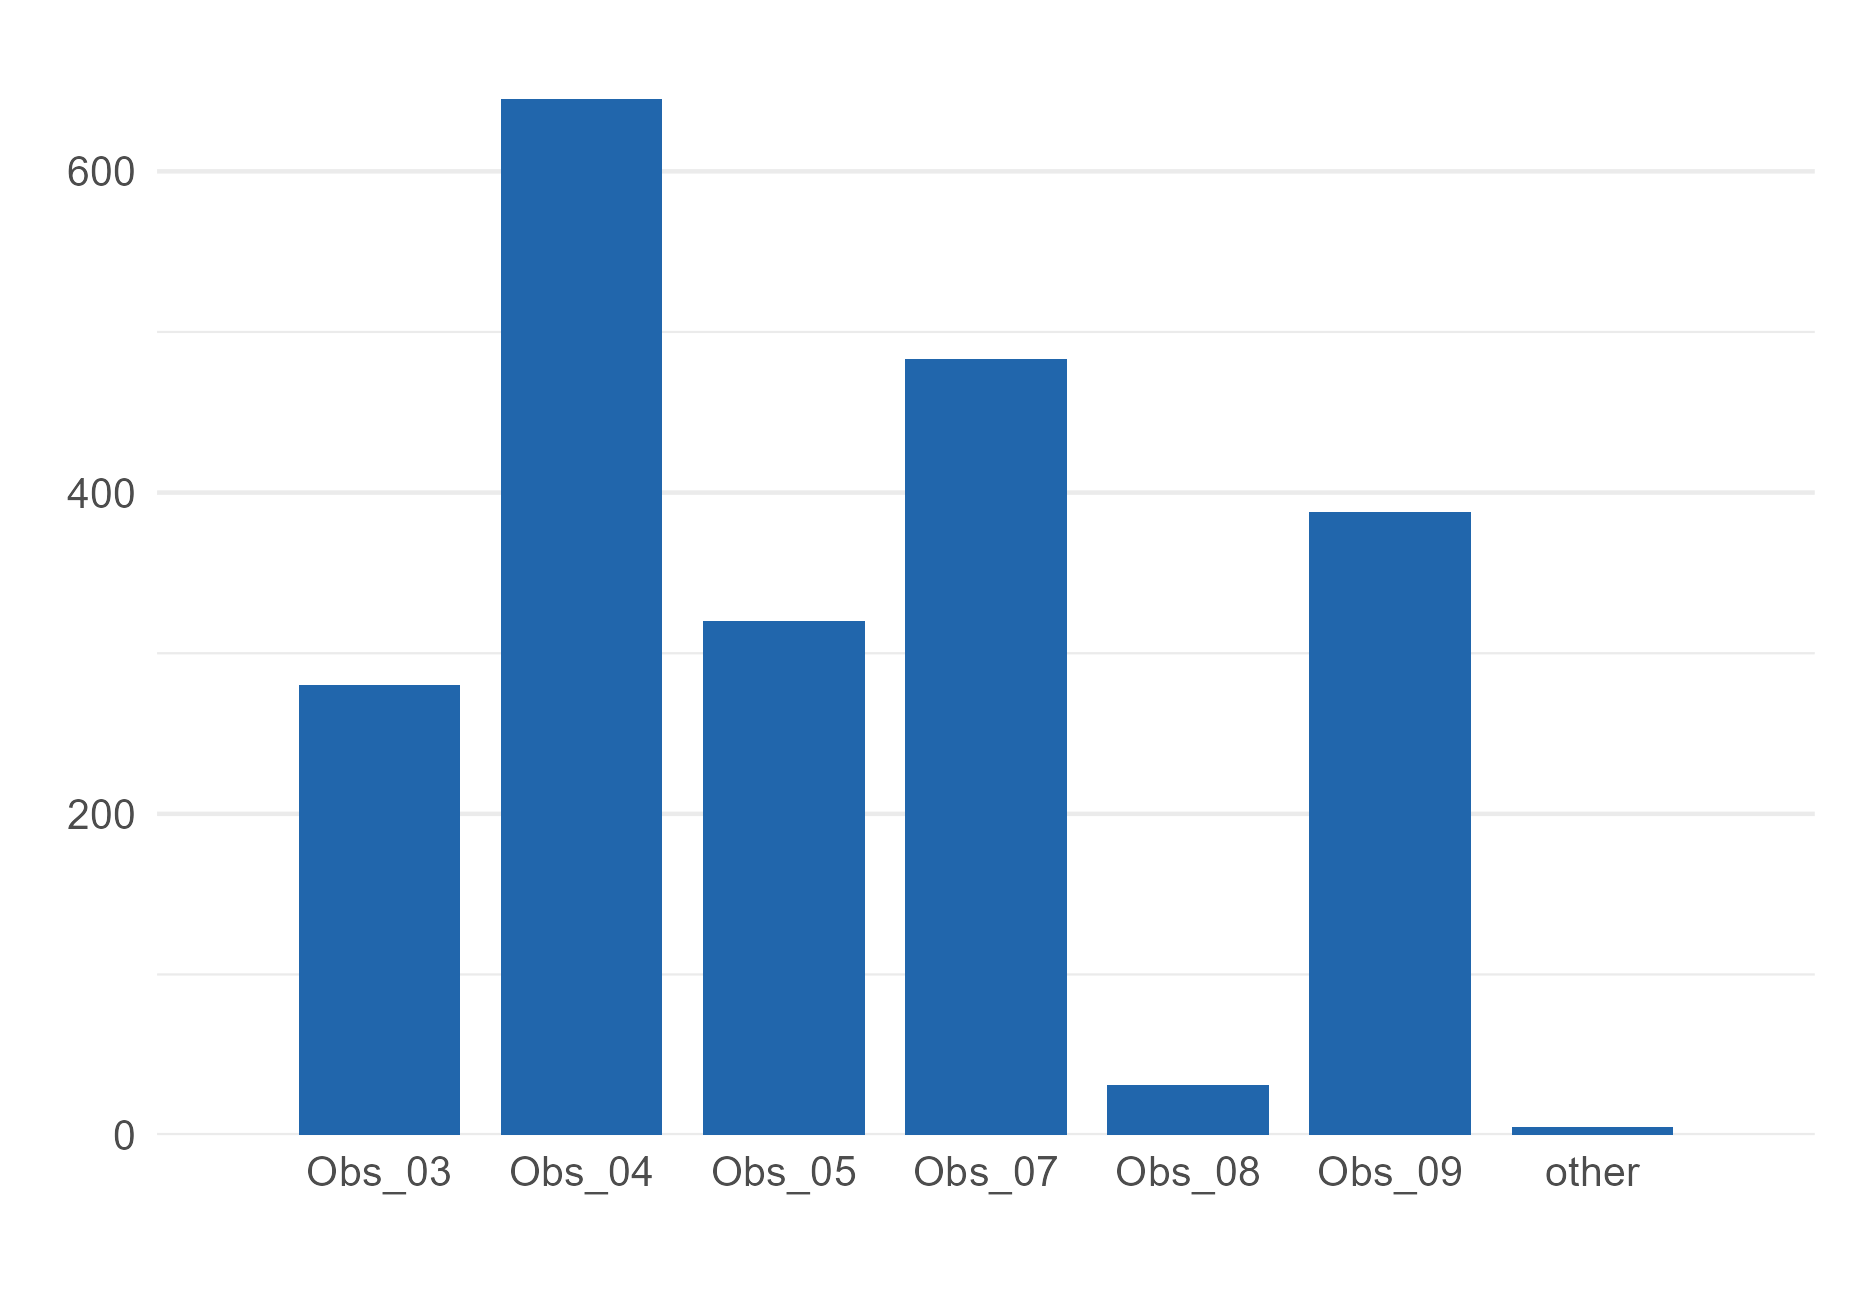
OBS_SOMA_0
obs_soma
Somatometry examiner
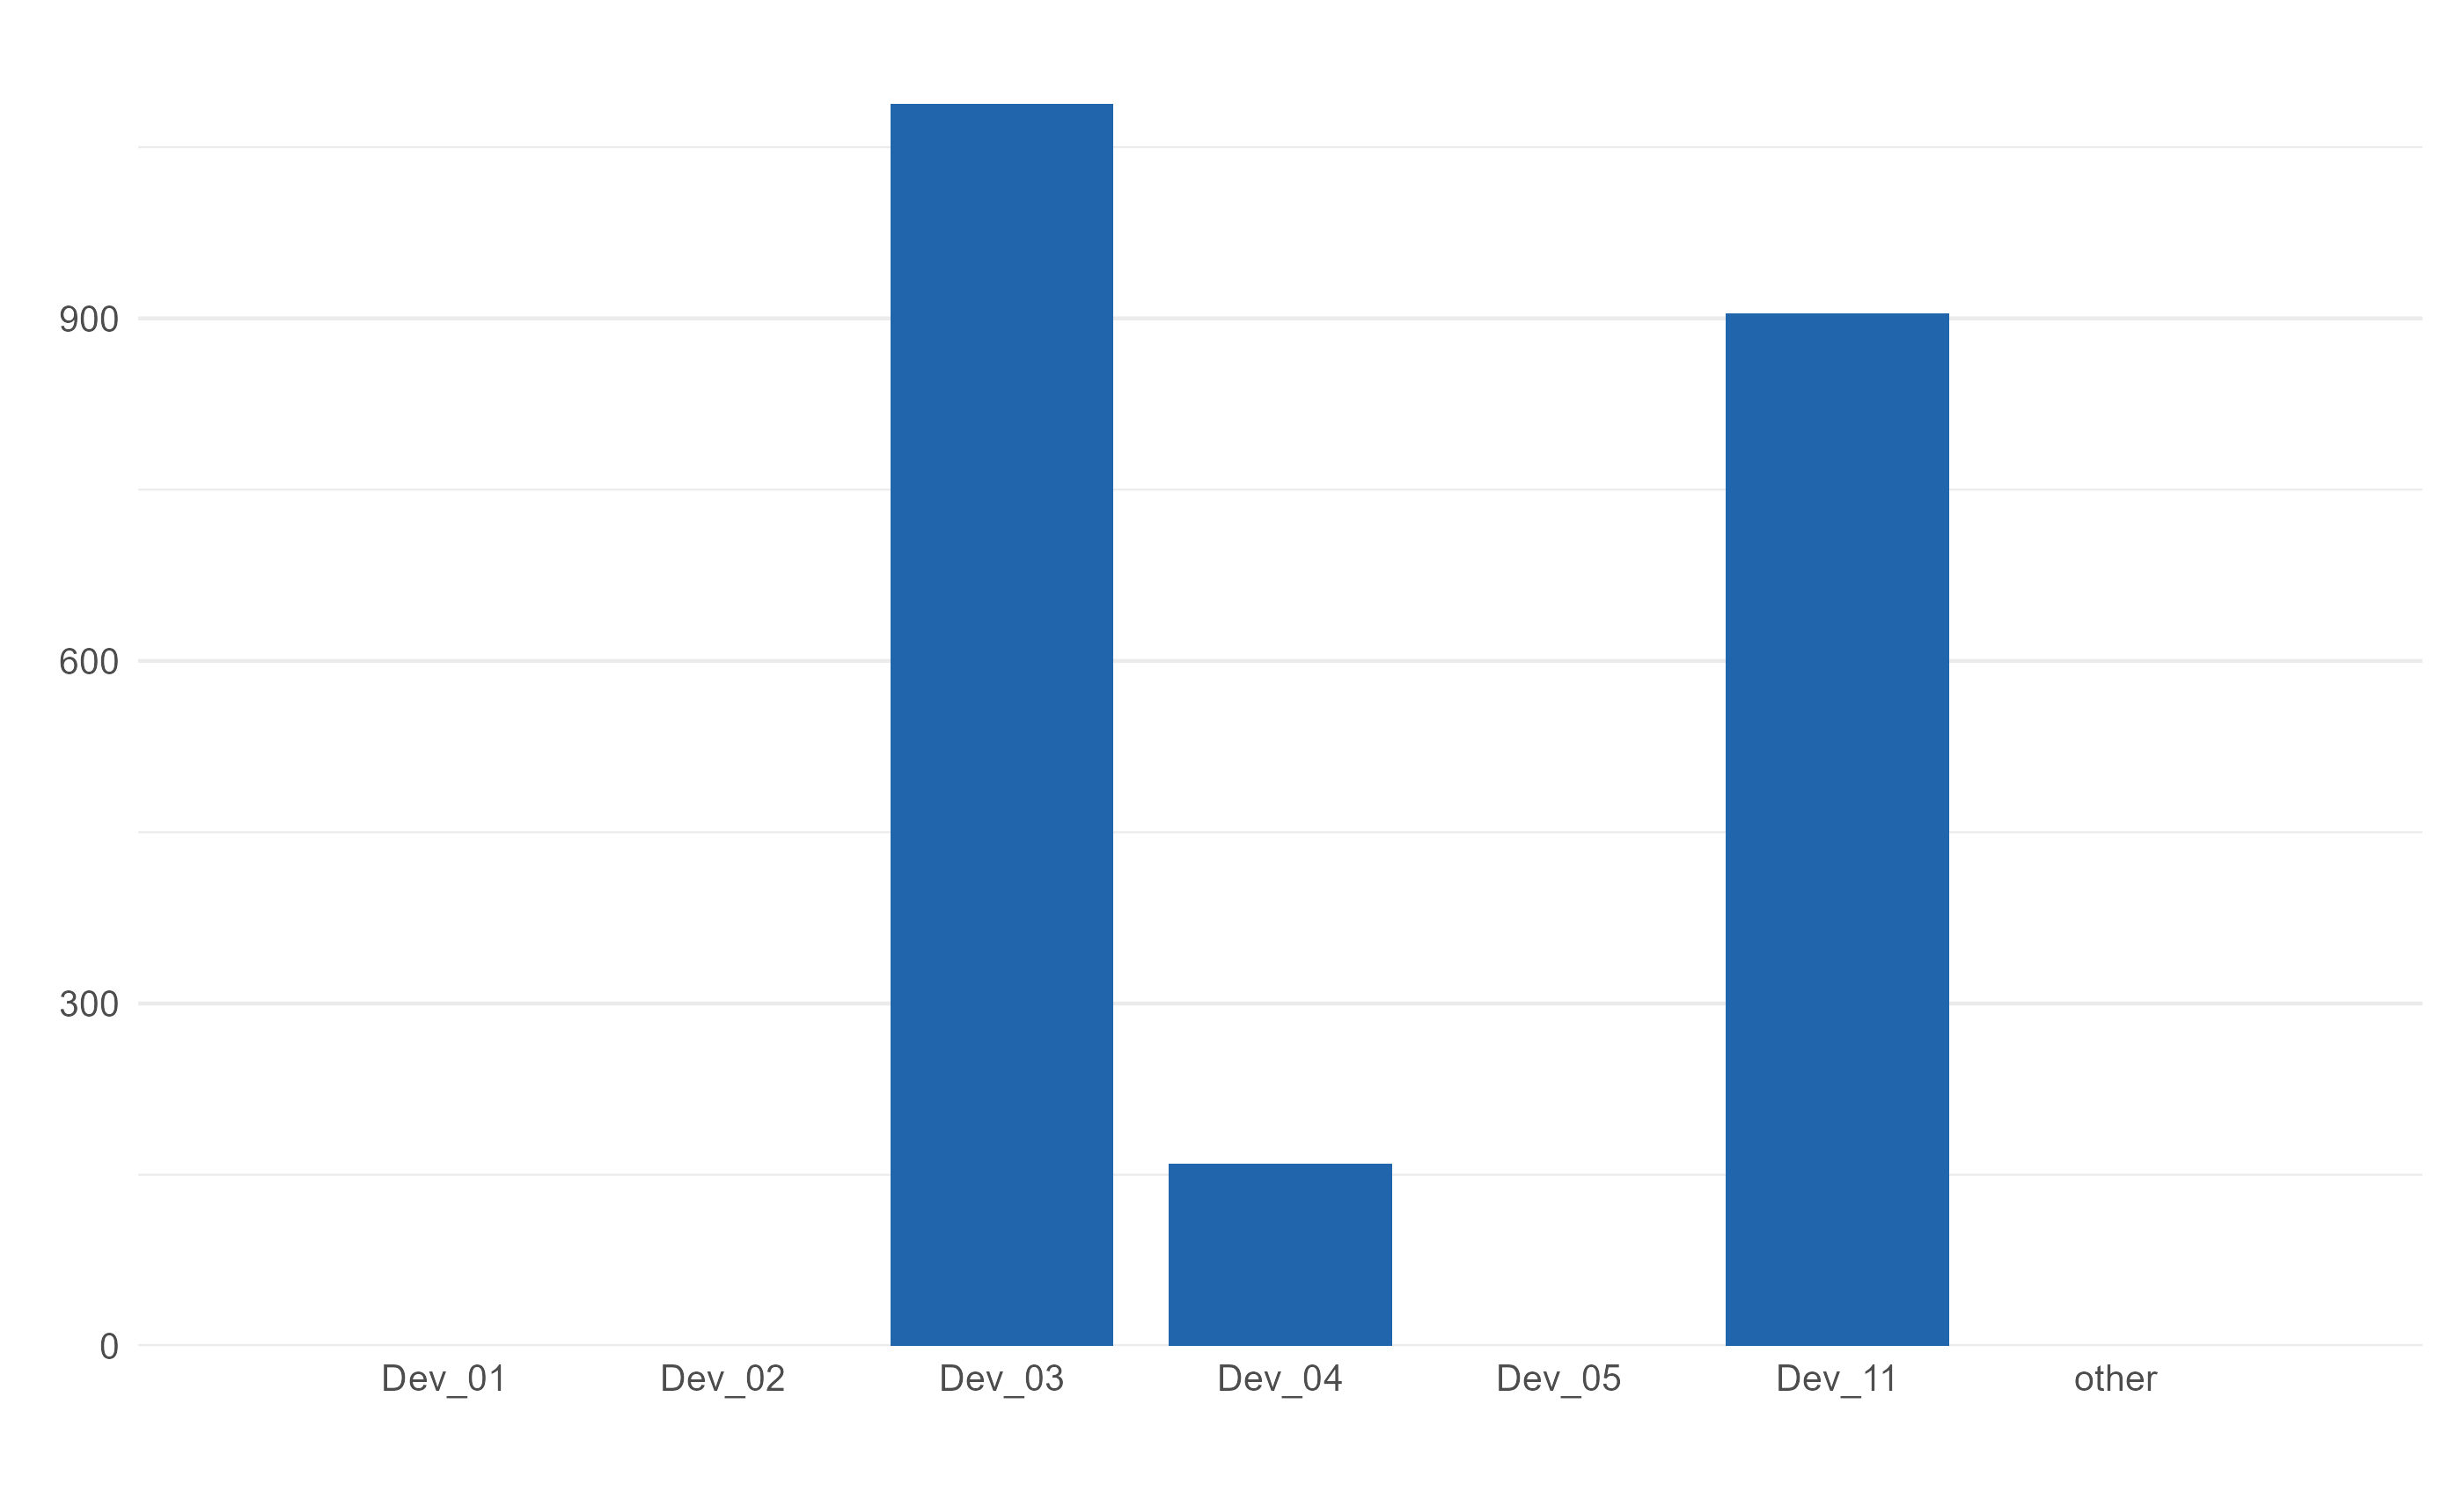
DEV_HEIGHT_0
dev_length
Body height scale ID
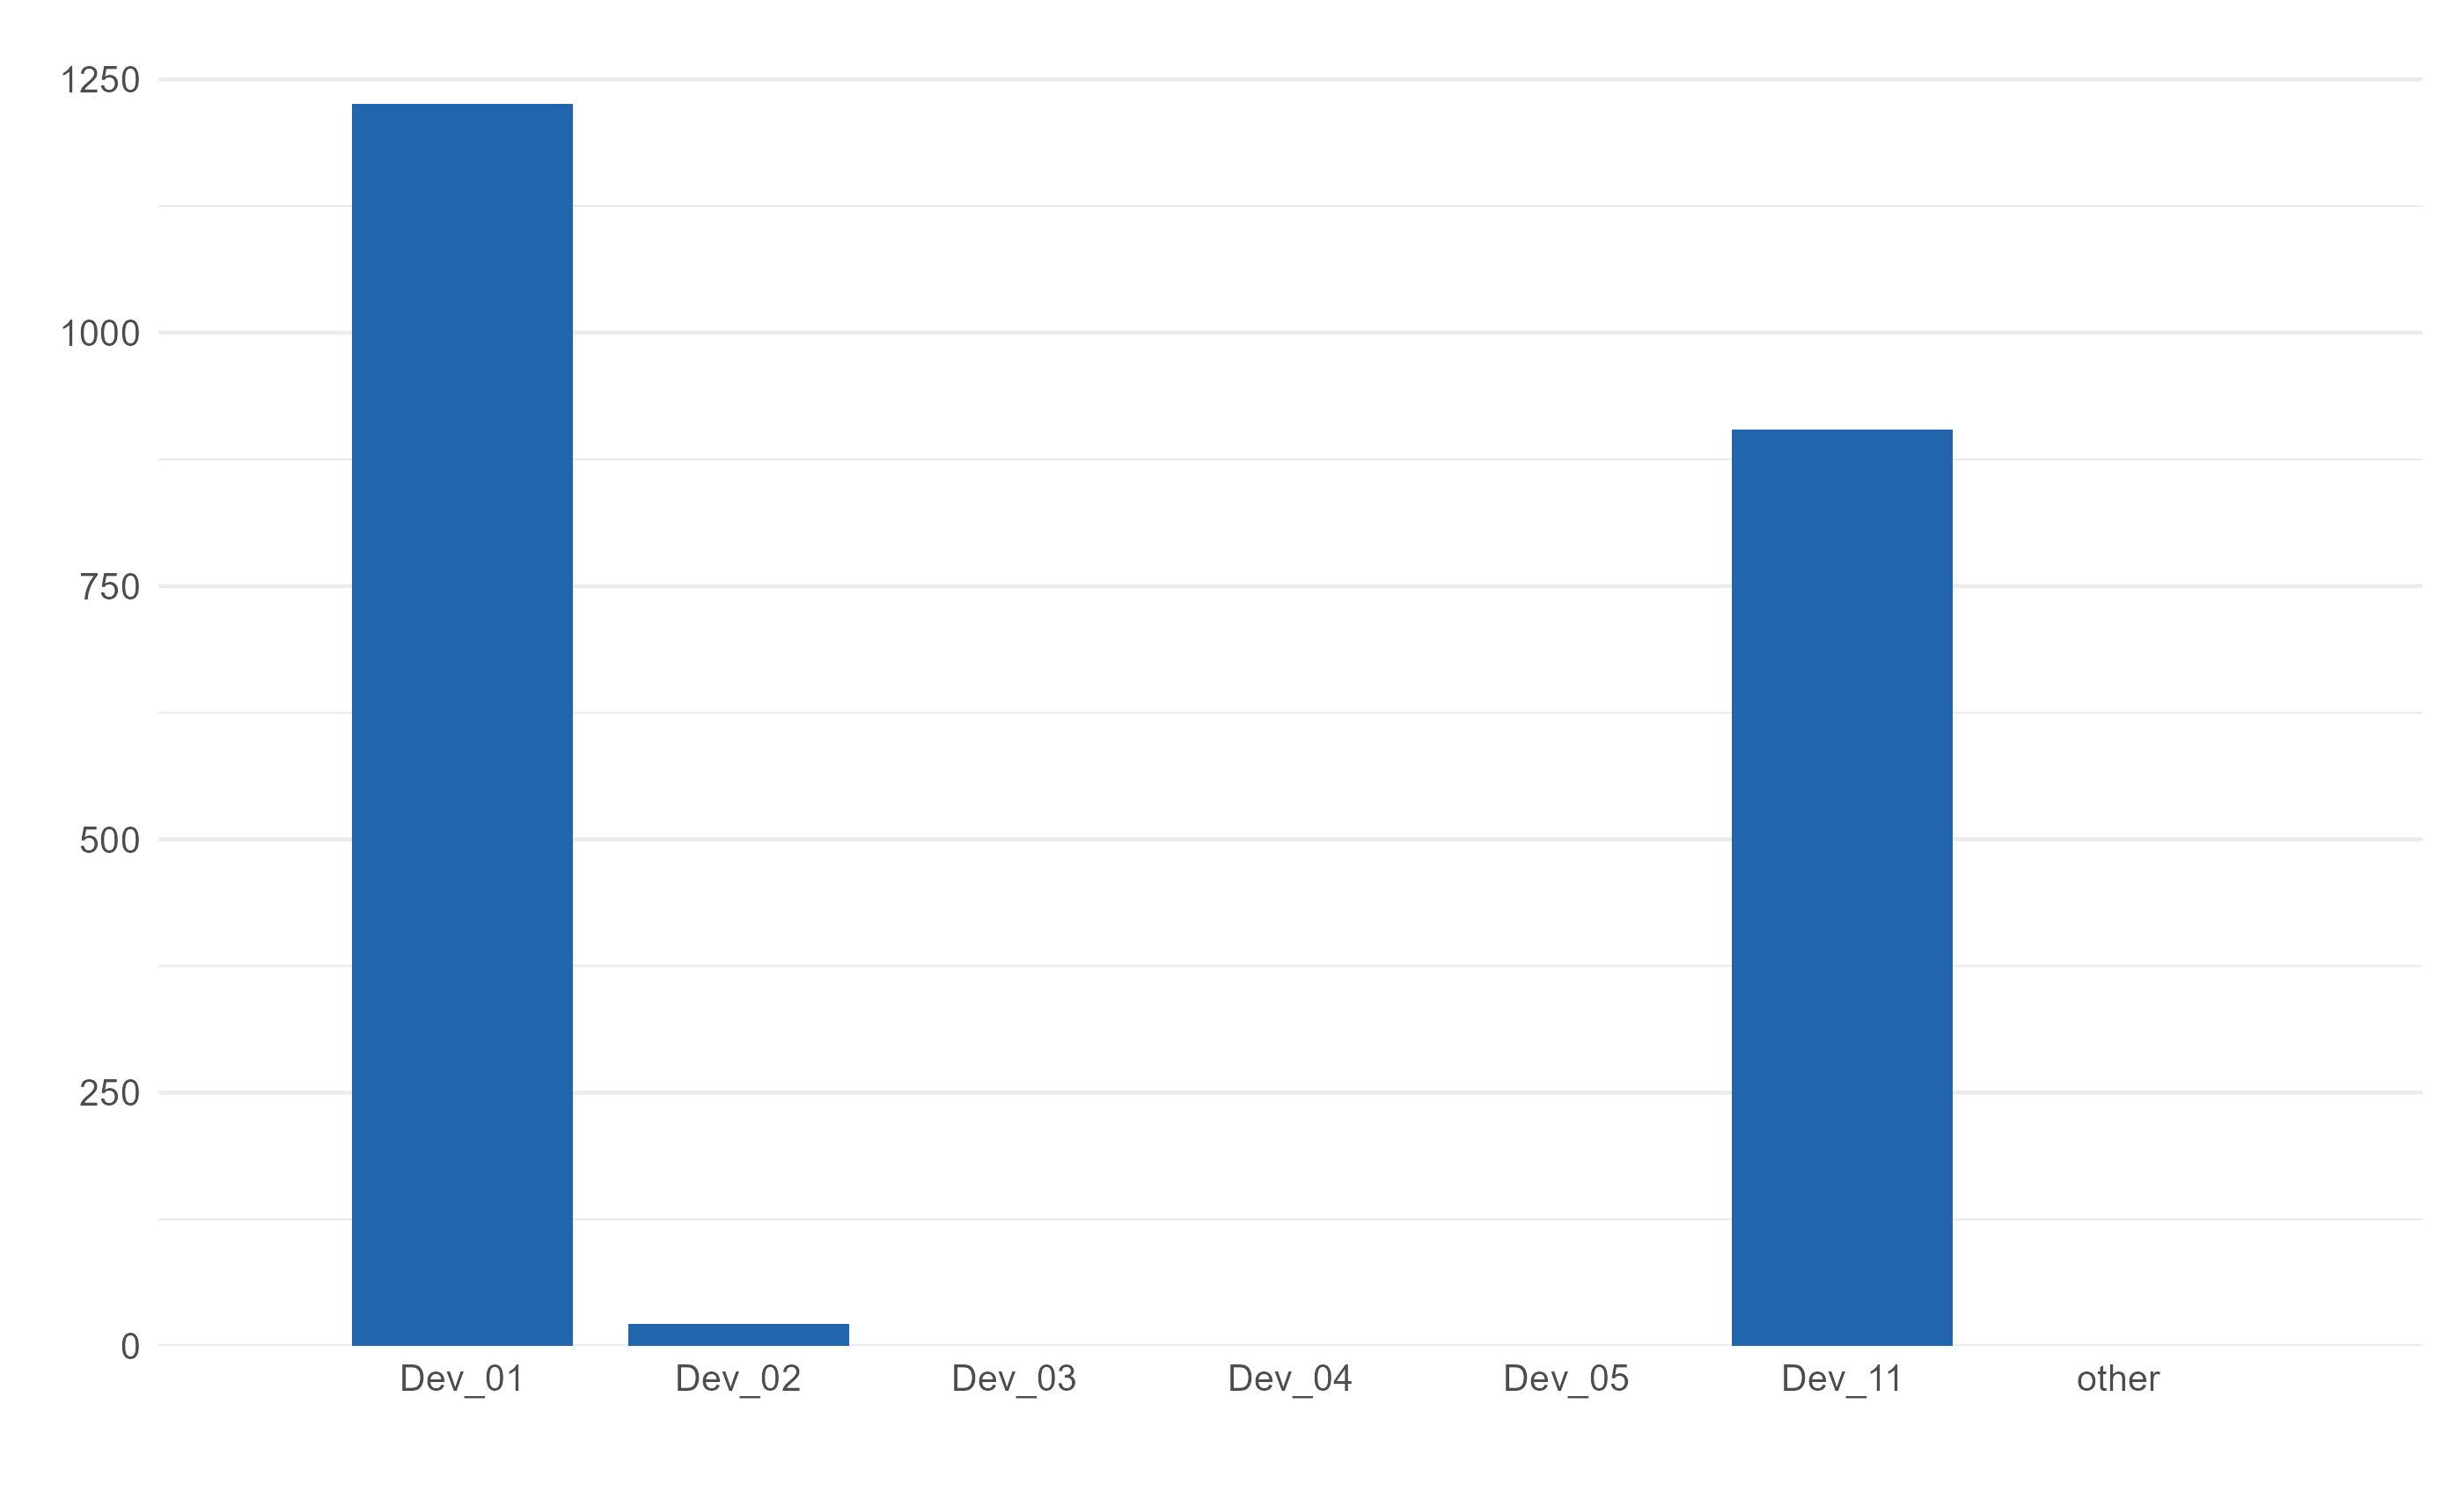
DEV_WEIGHT_0
dev_weight
Body weight scale ID
OBS_INT_0
obs_int
Interview examiner
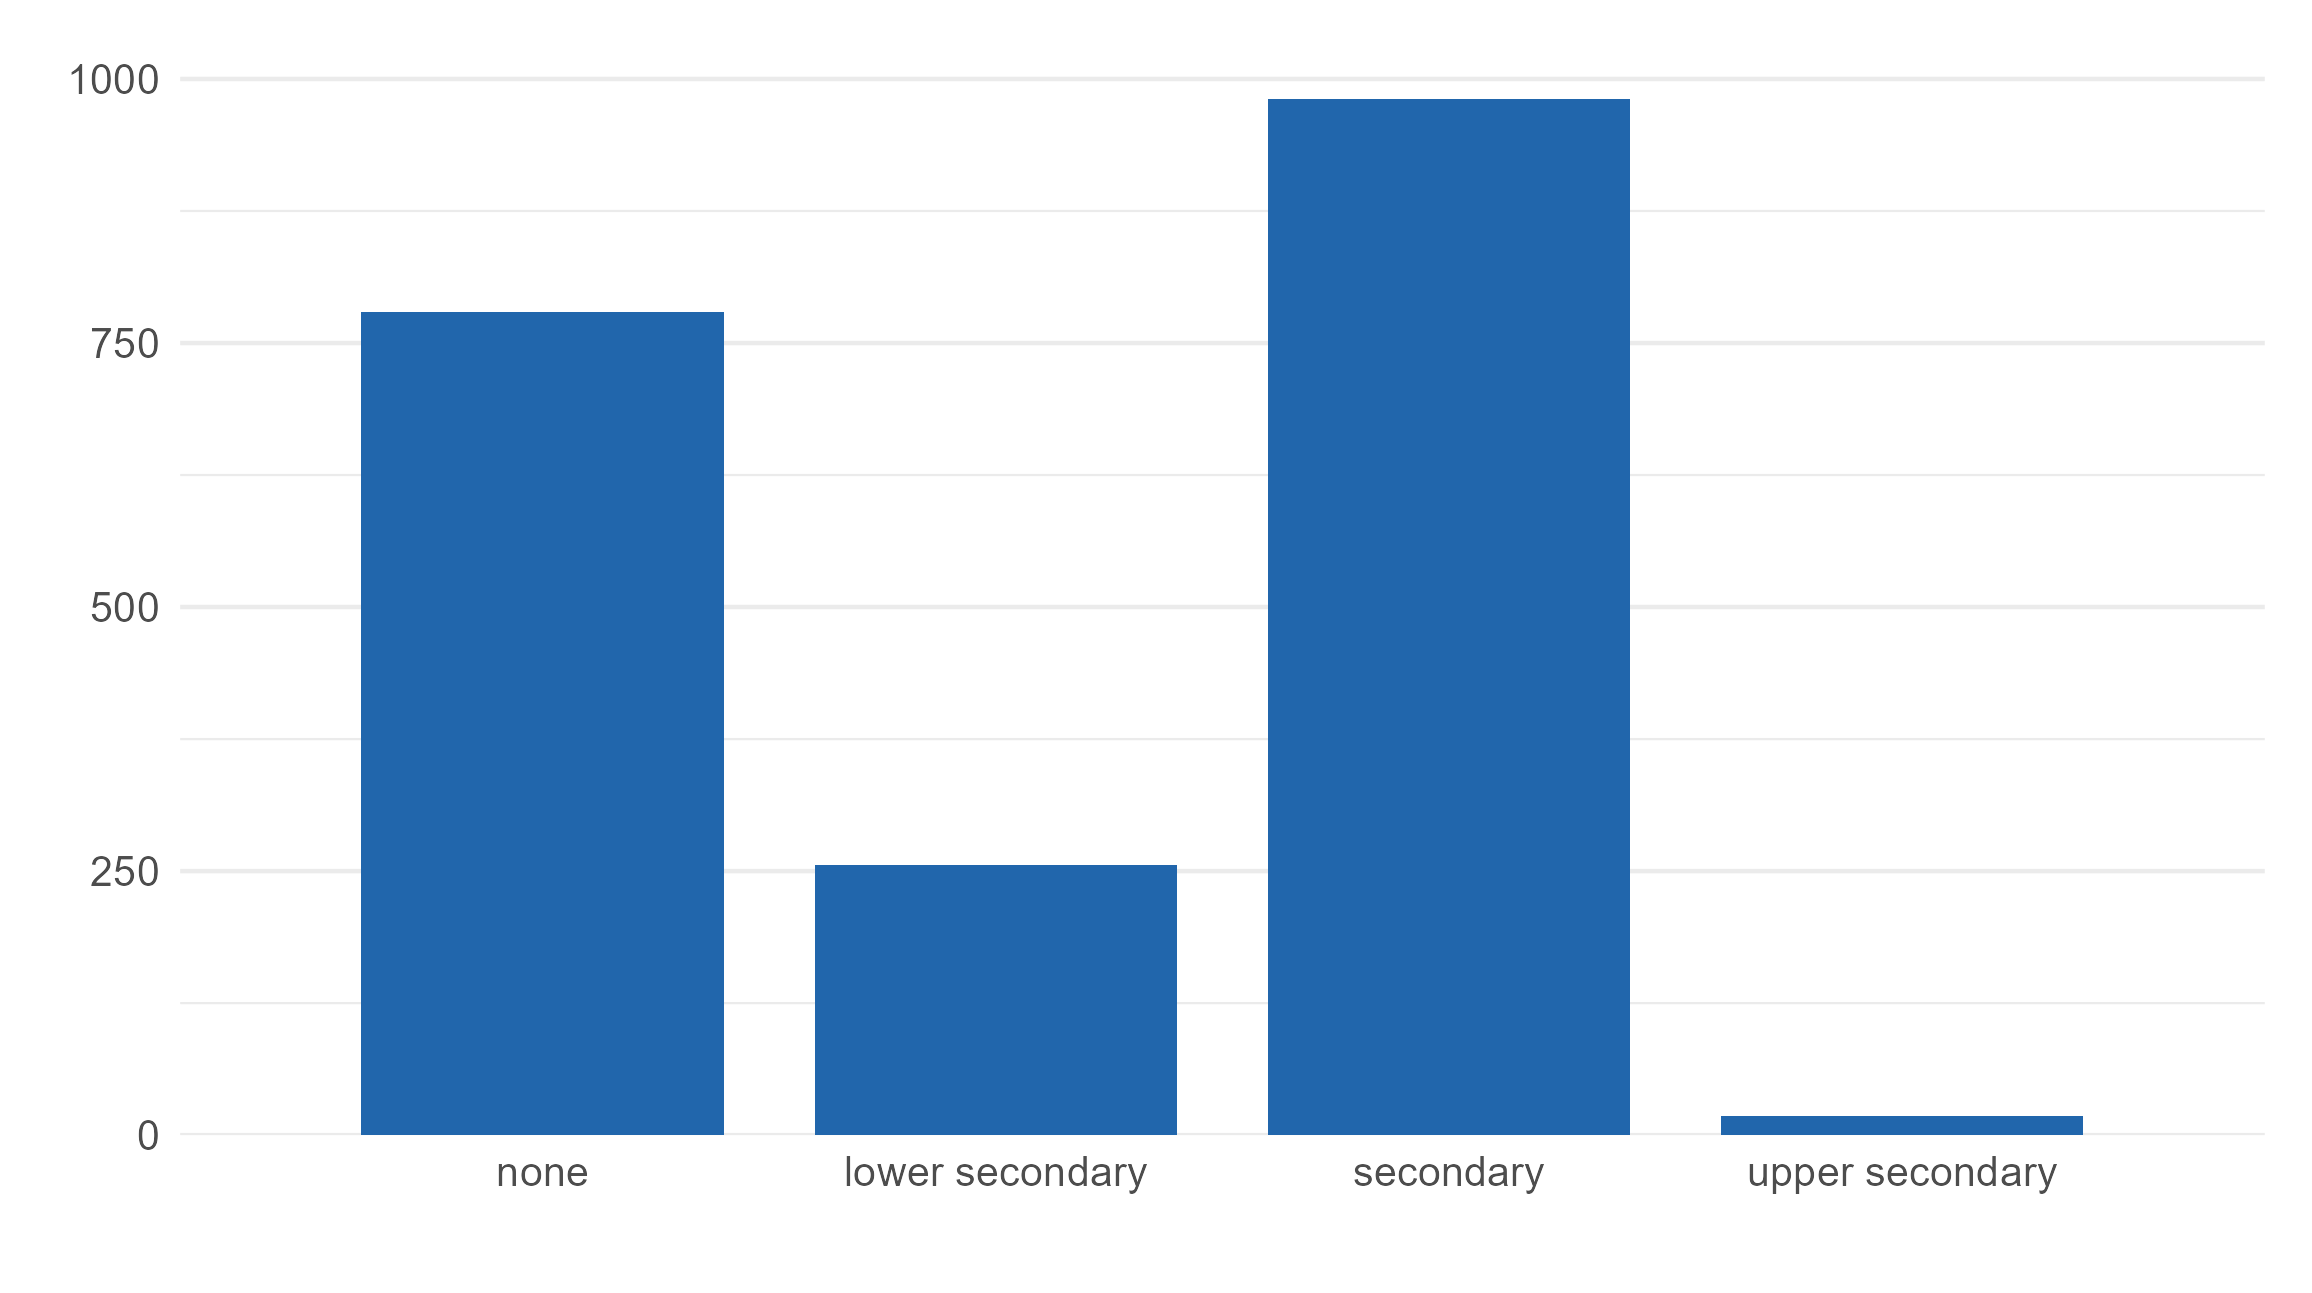
SCHOOL_GRAD_0
school
Highest educational level
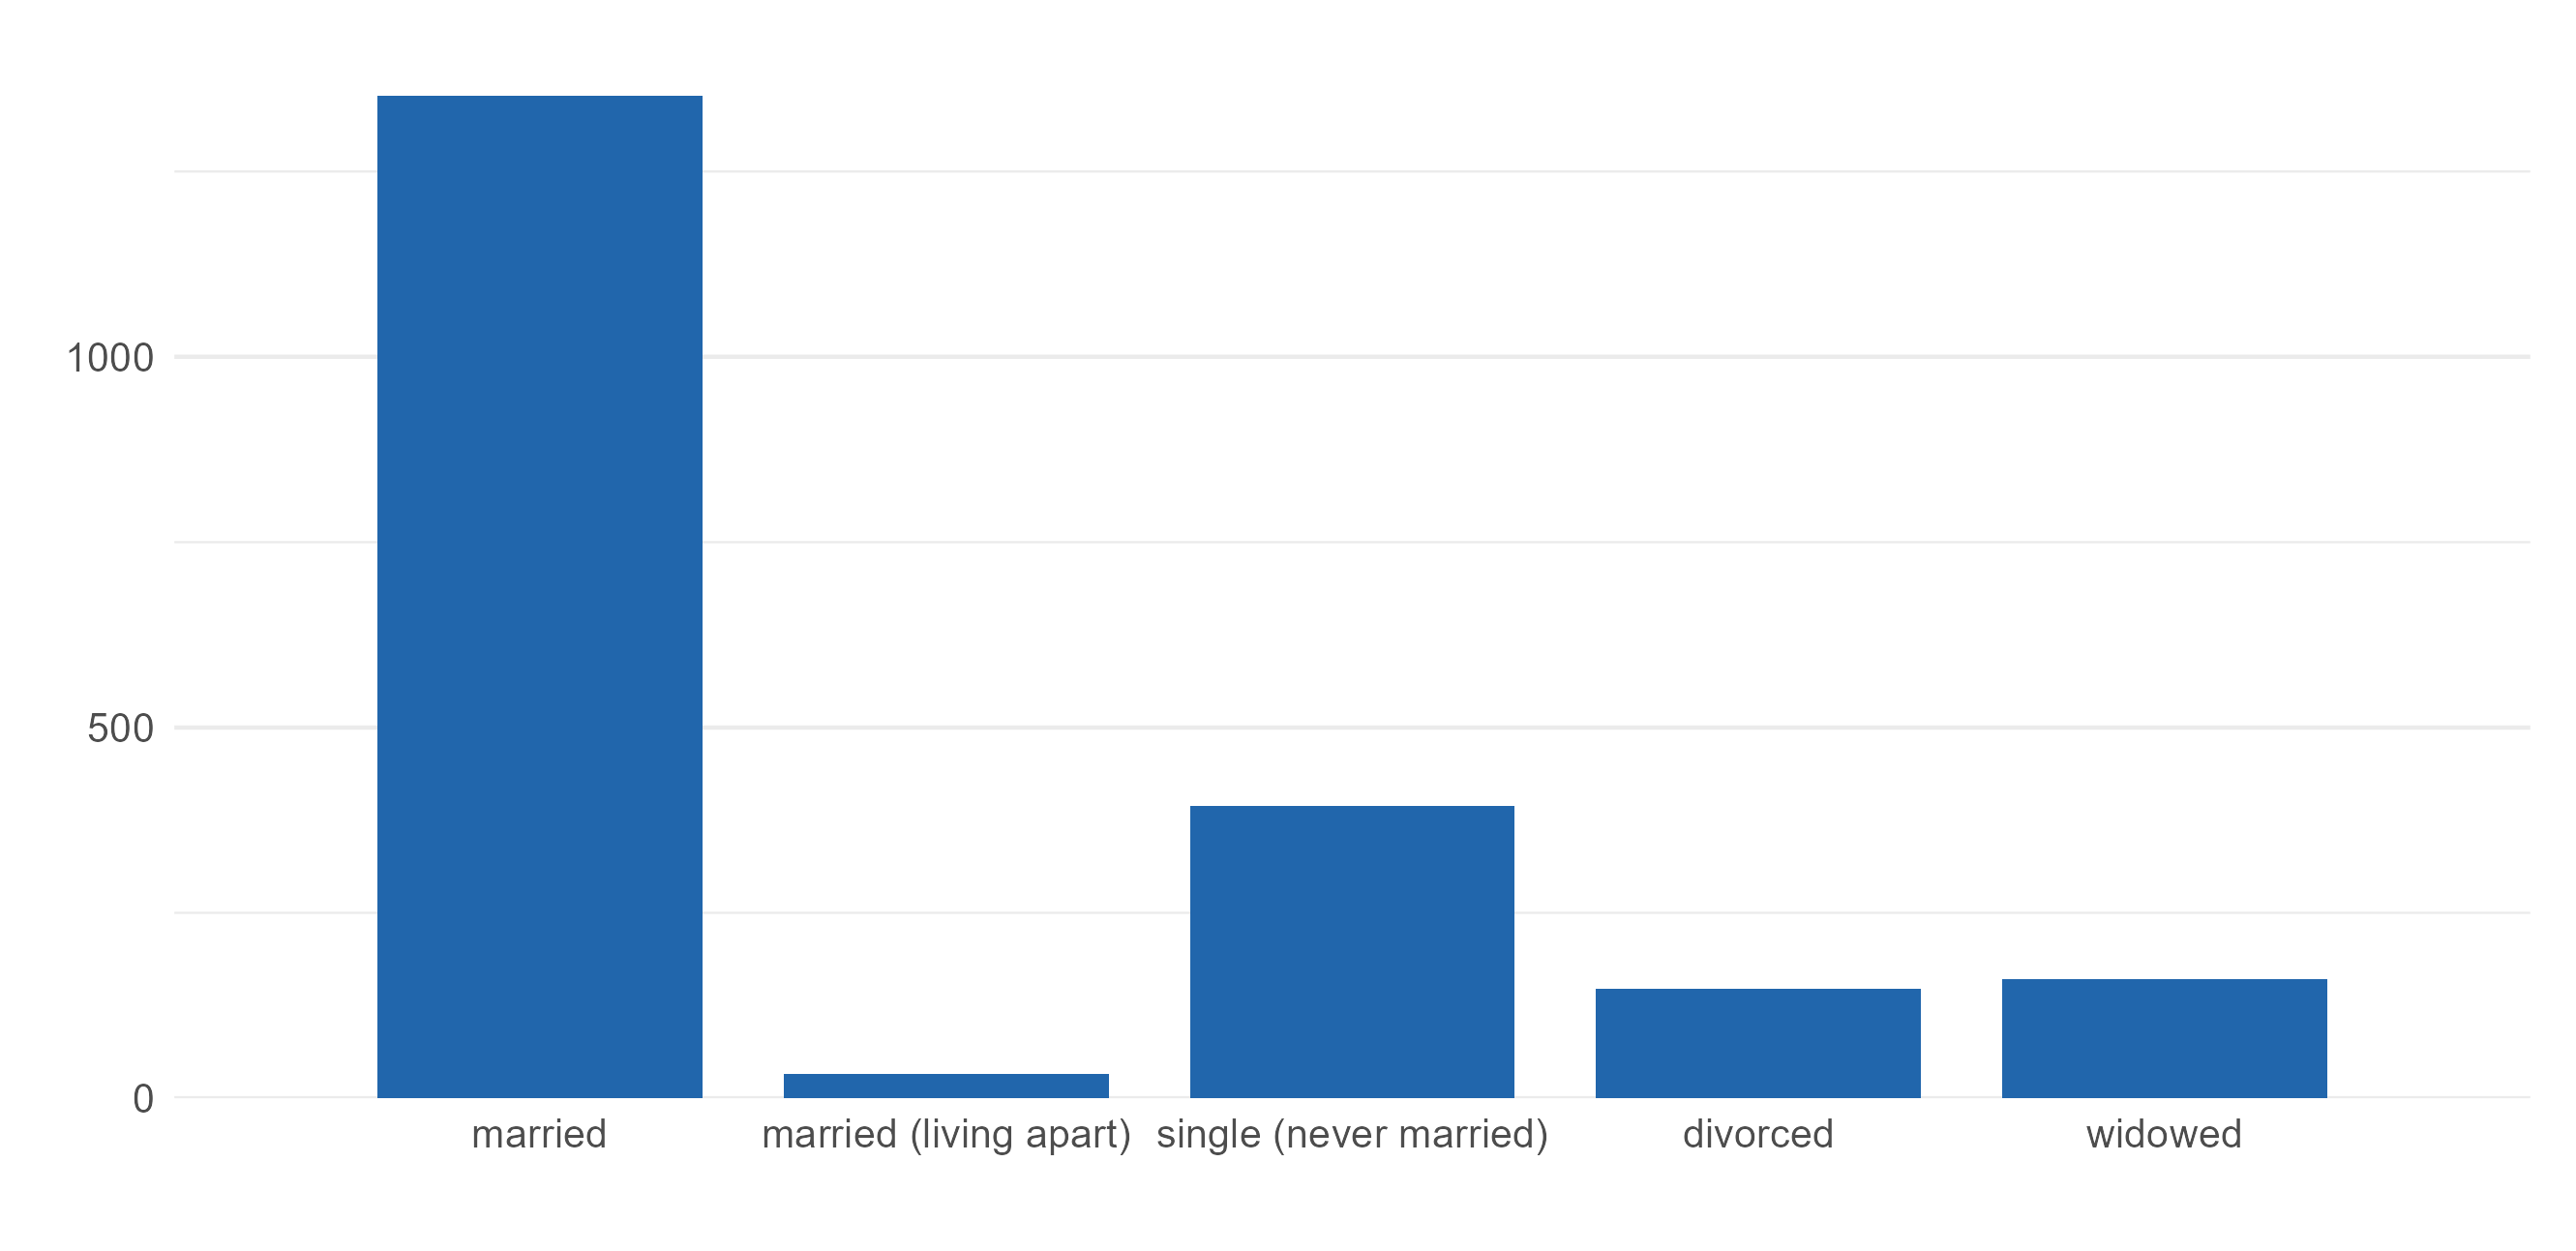
RELATION_STATUS_0
family
Marital status
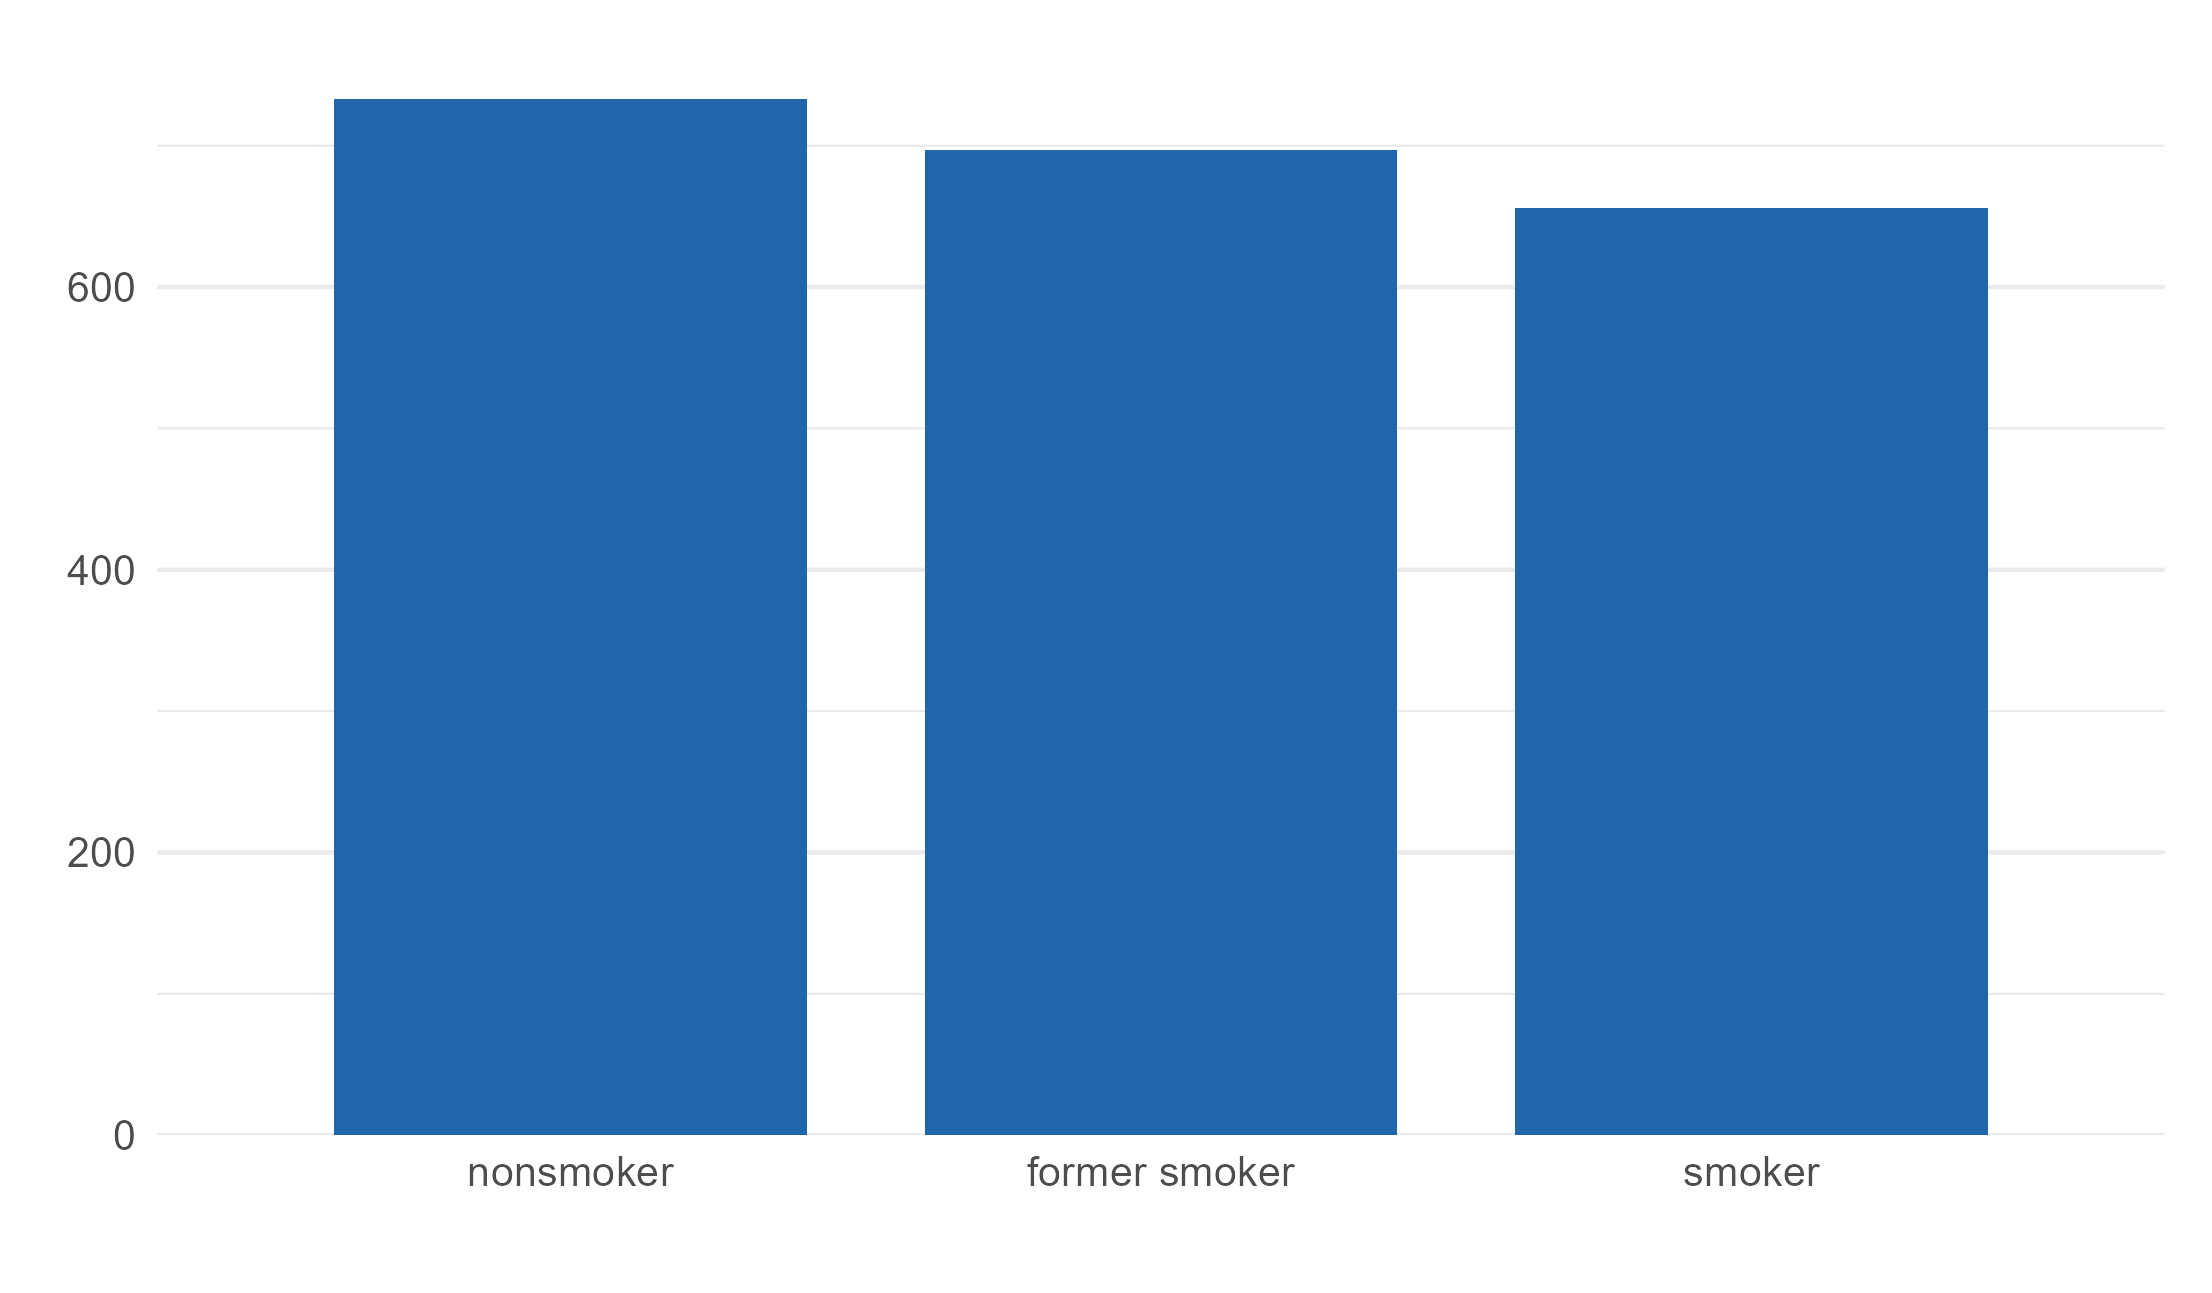
SMOKING_STATUS_0
smoking
Smoking status
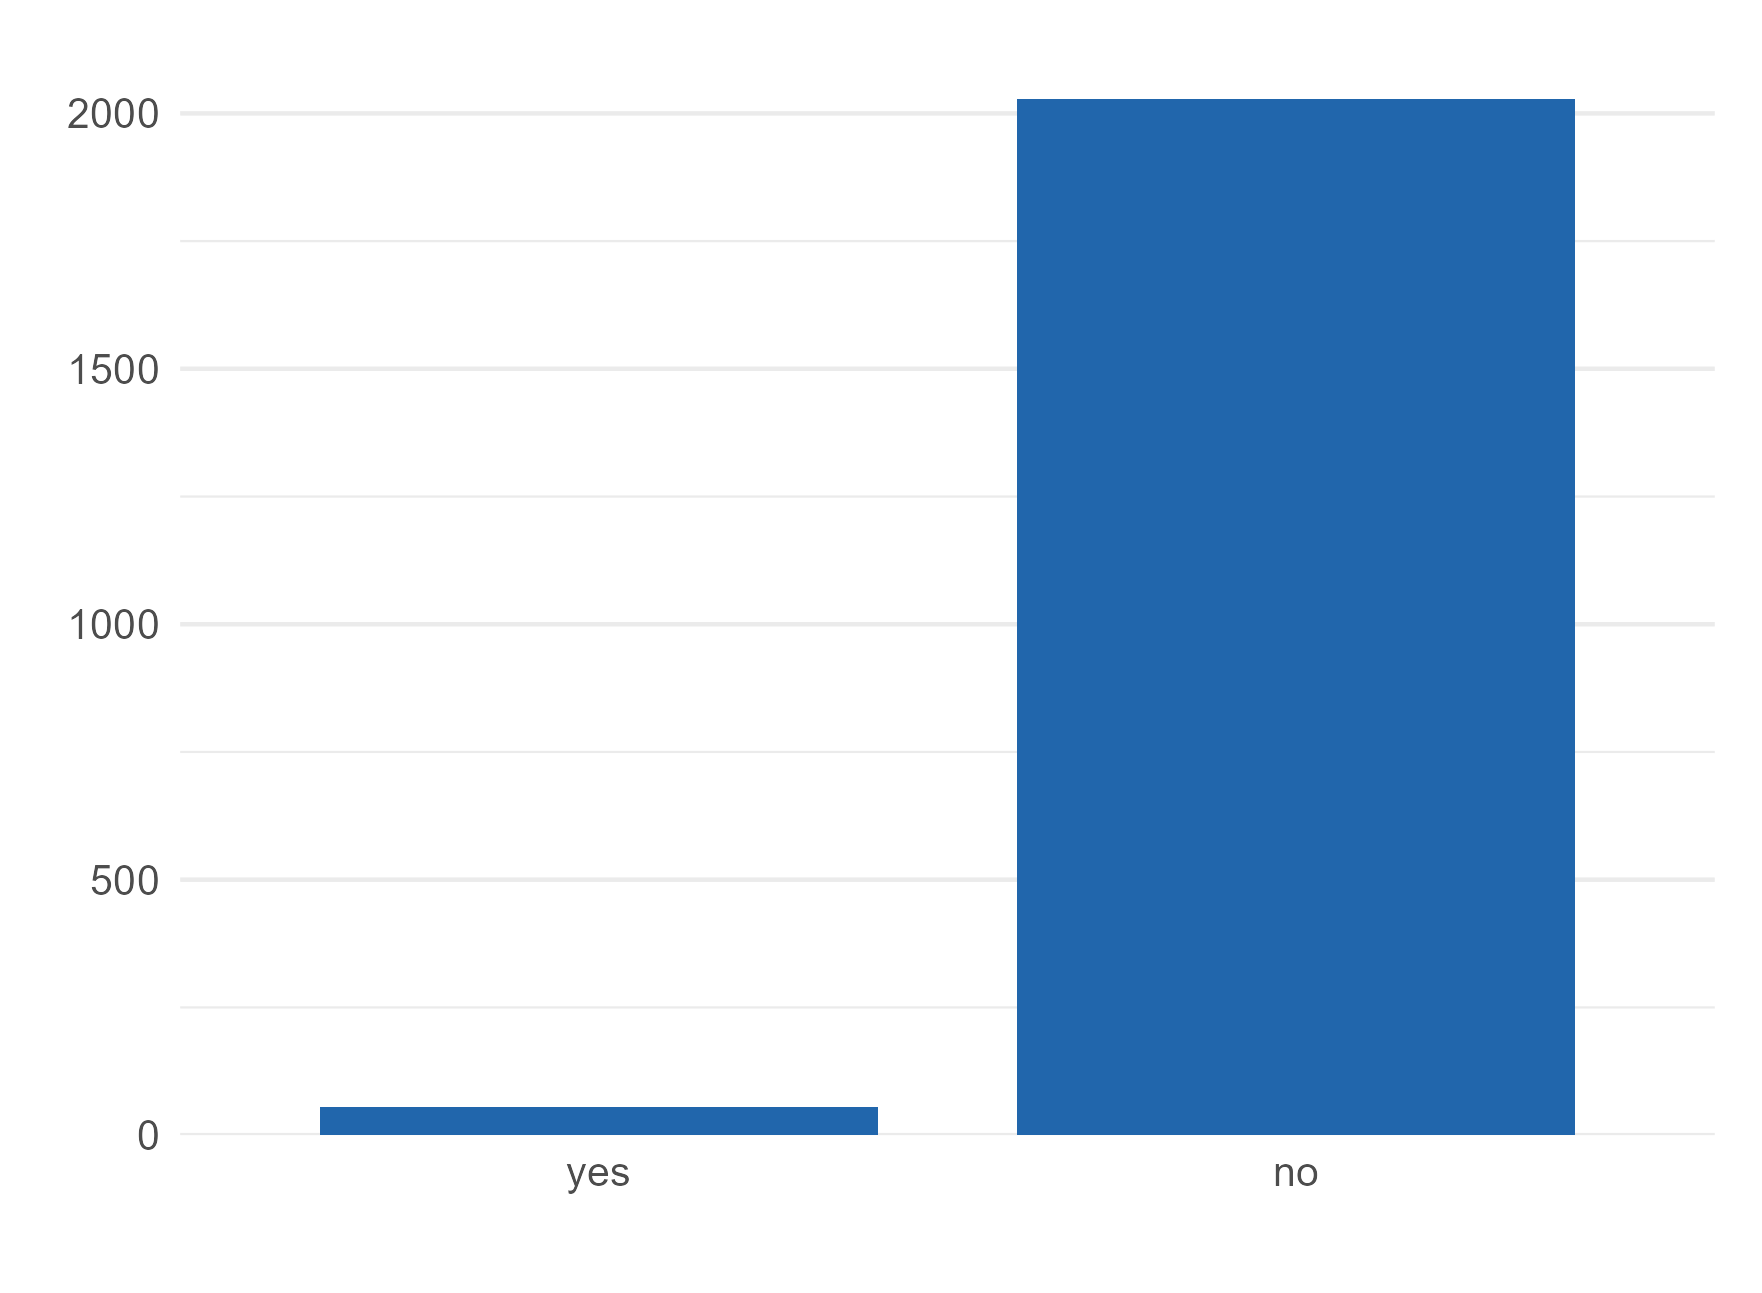
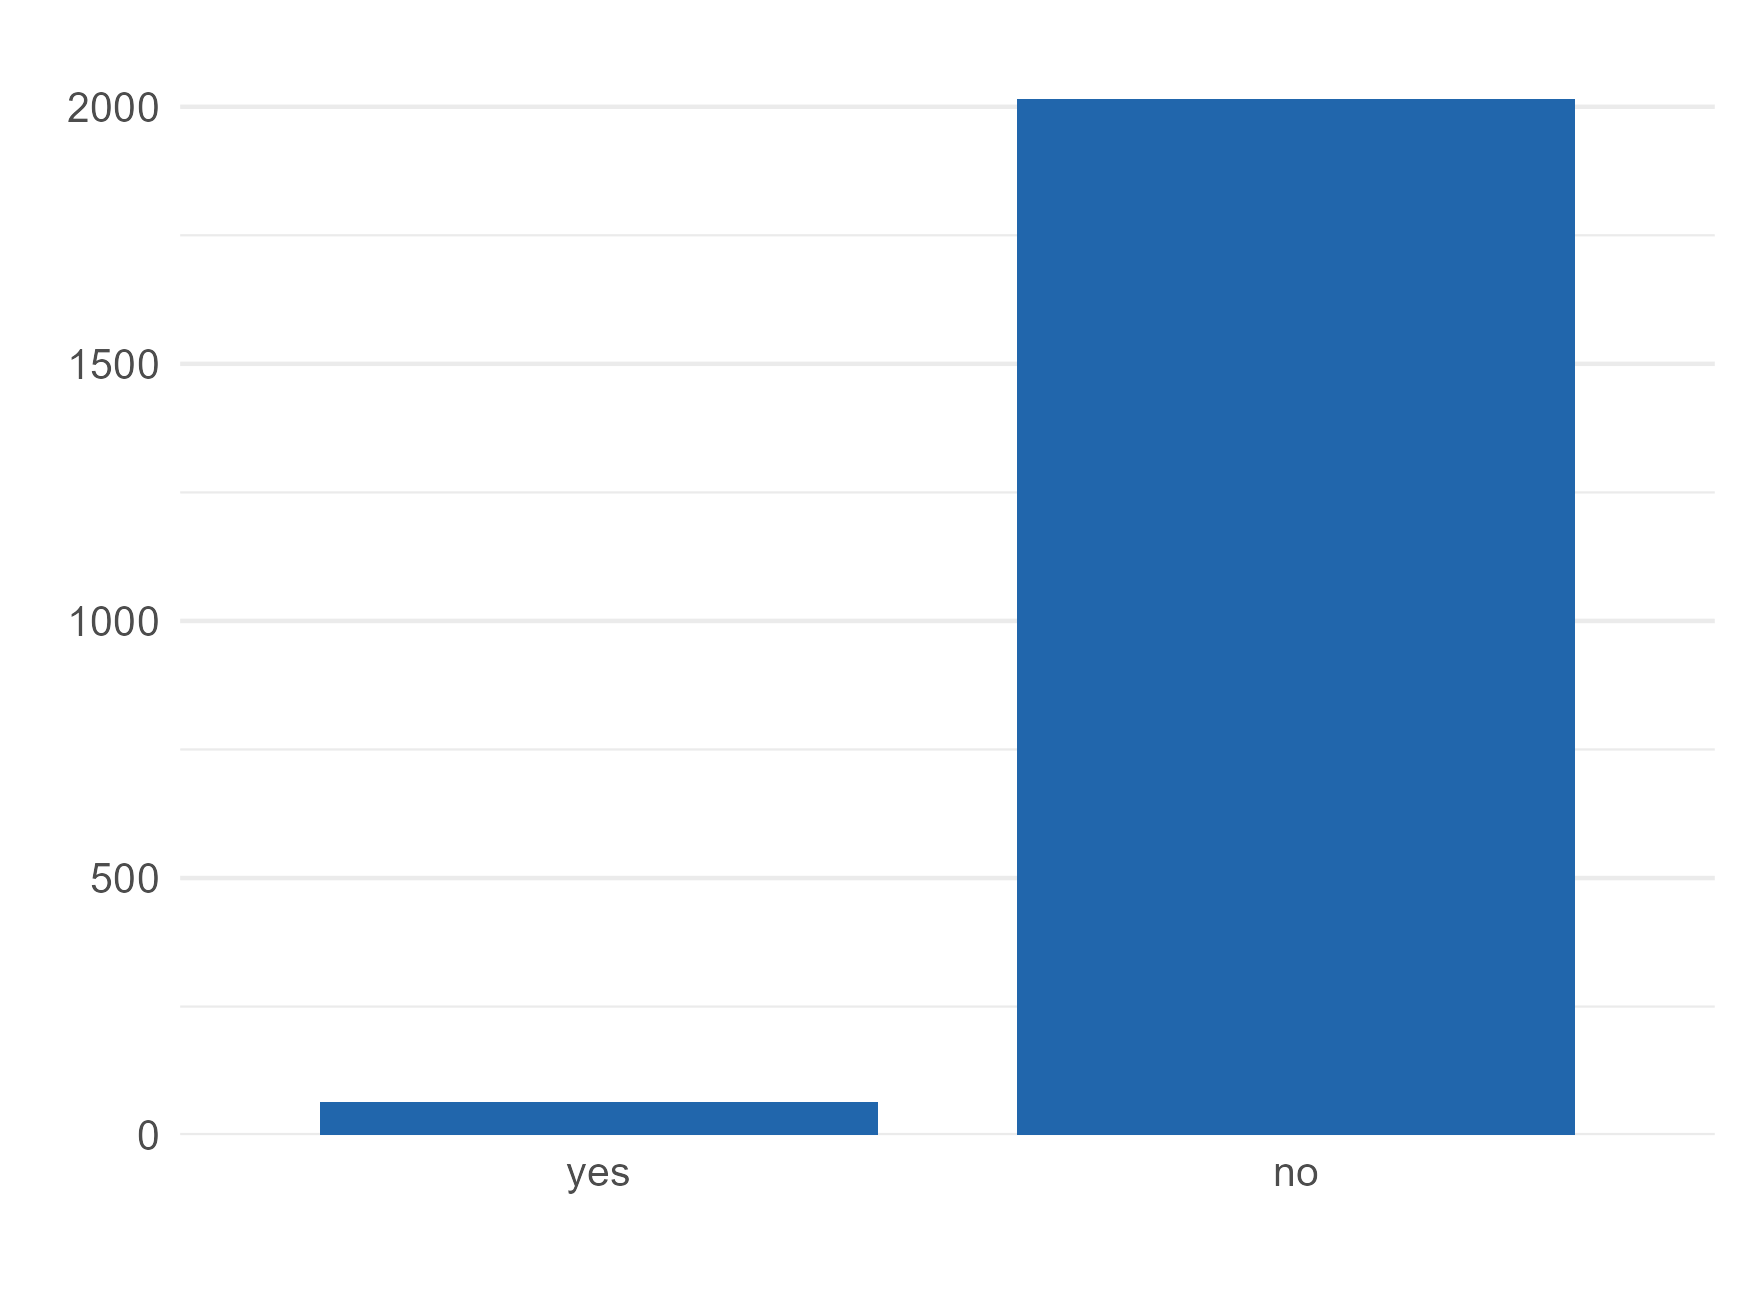
STROKE_YN_0
stroke
Ever had stroke
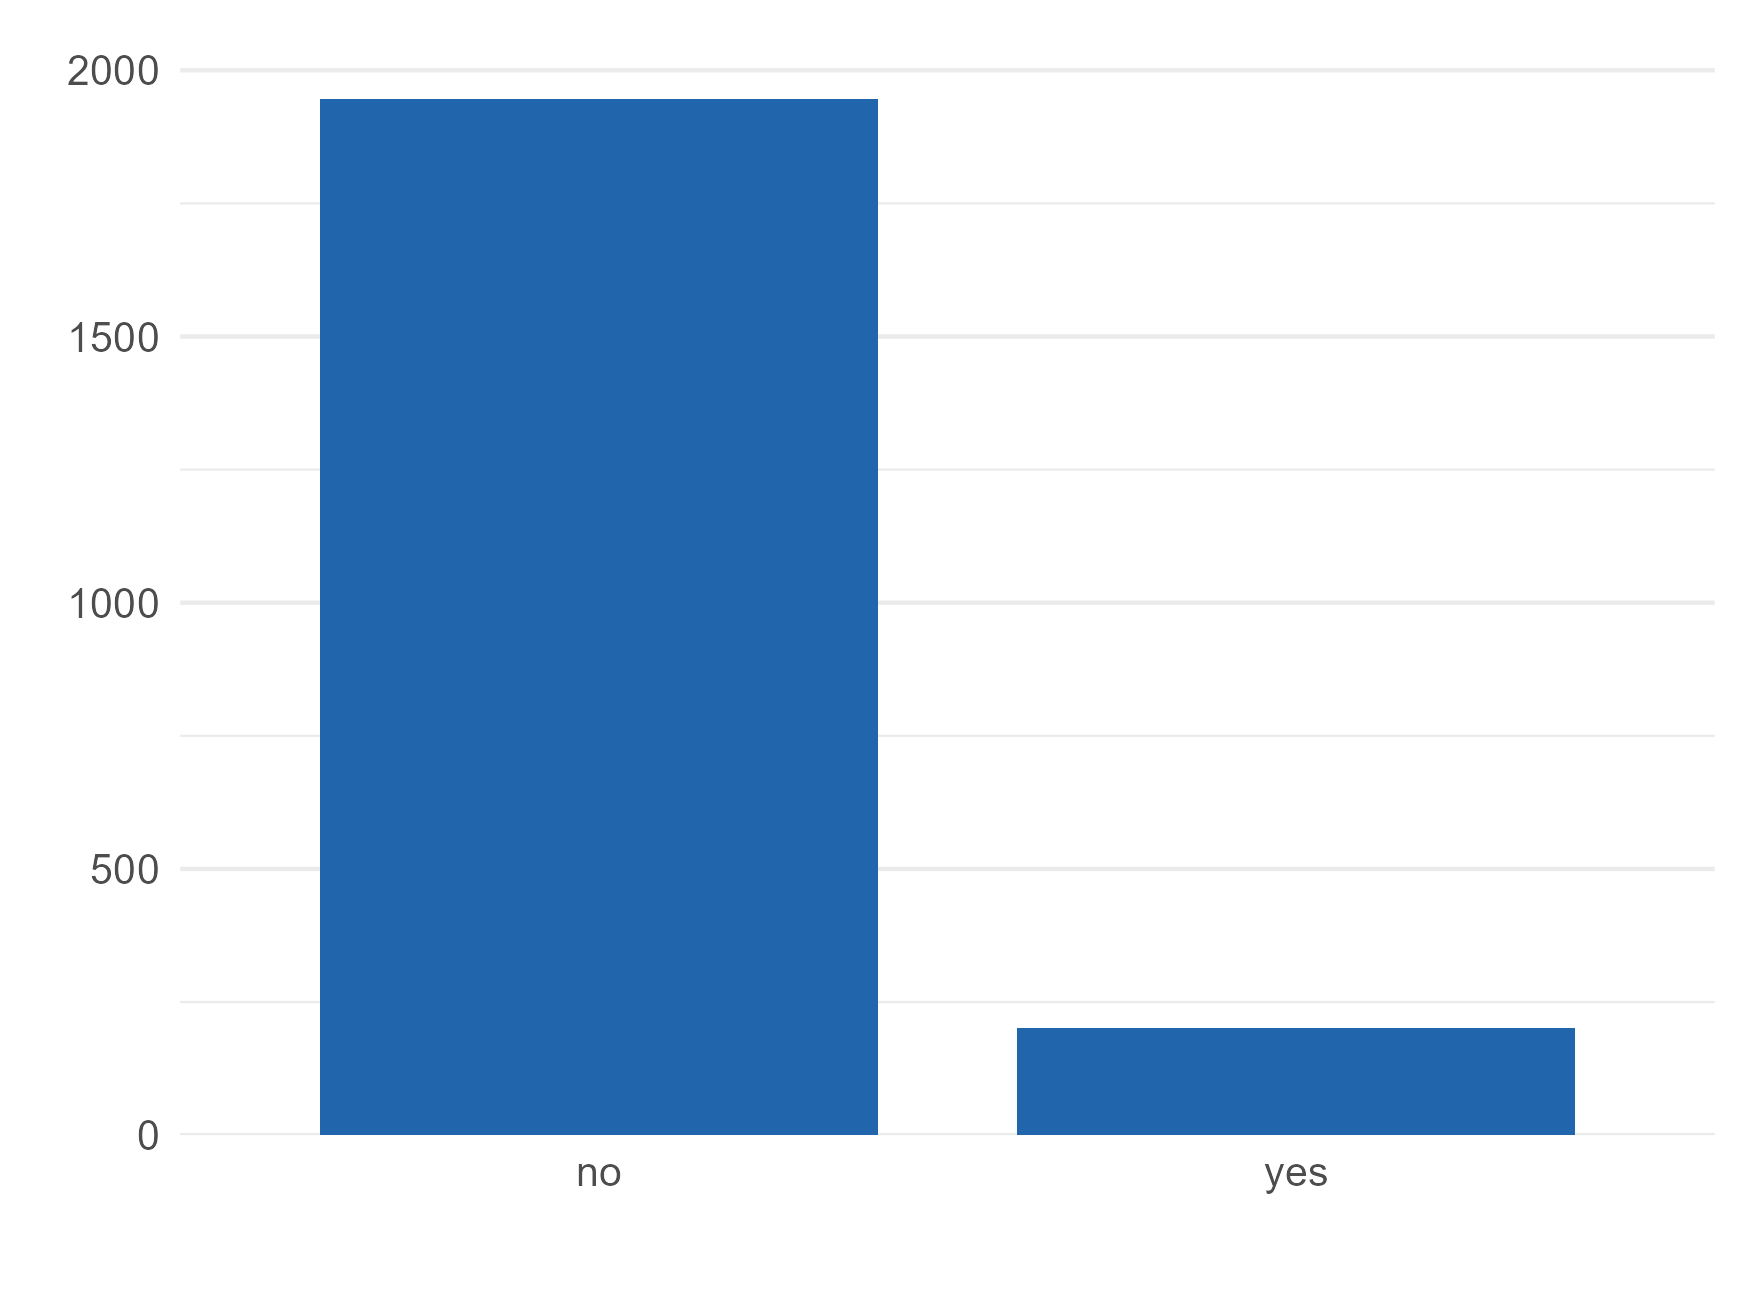
MYOCARD_YN_0
myocard
Ever had myocardial infarction
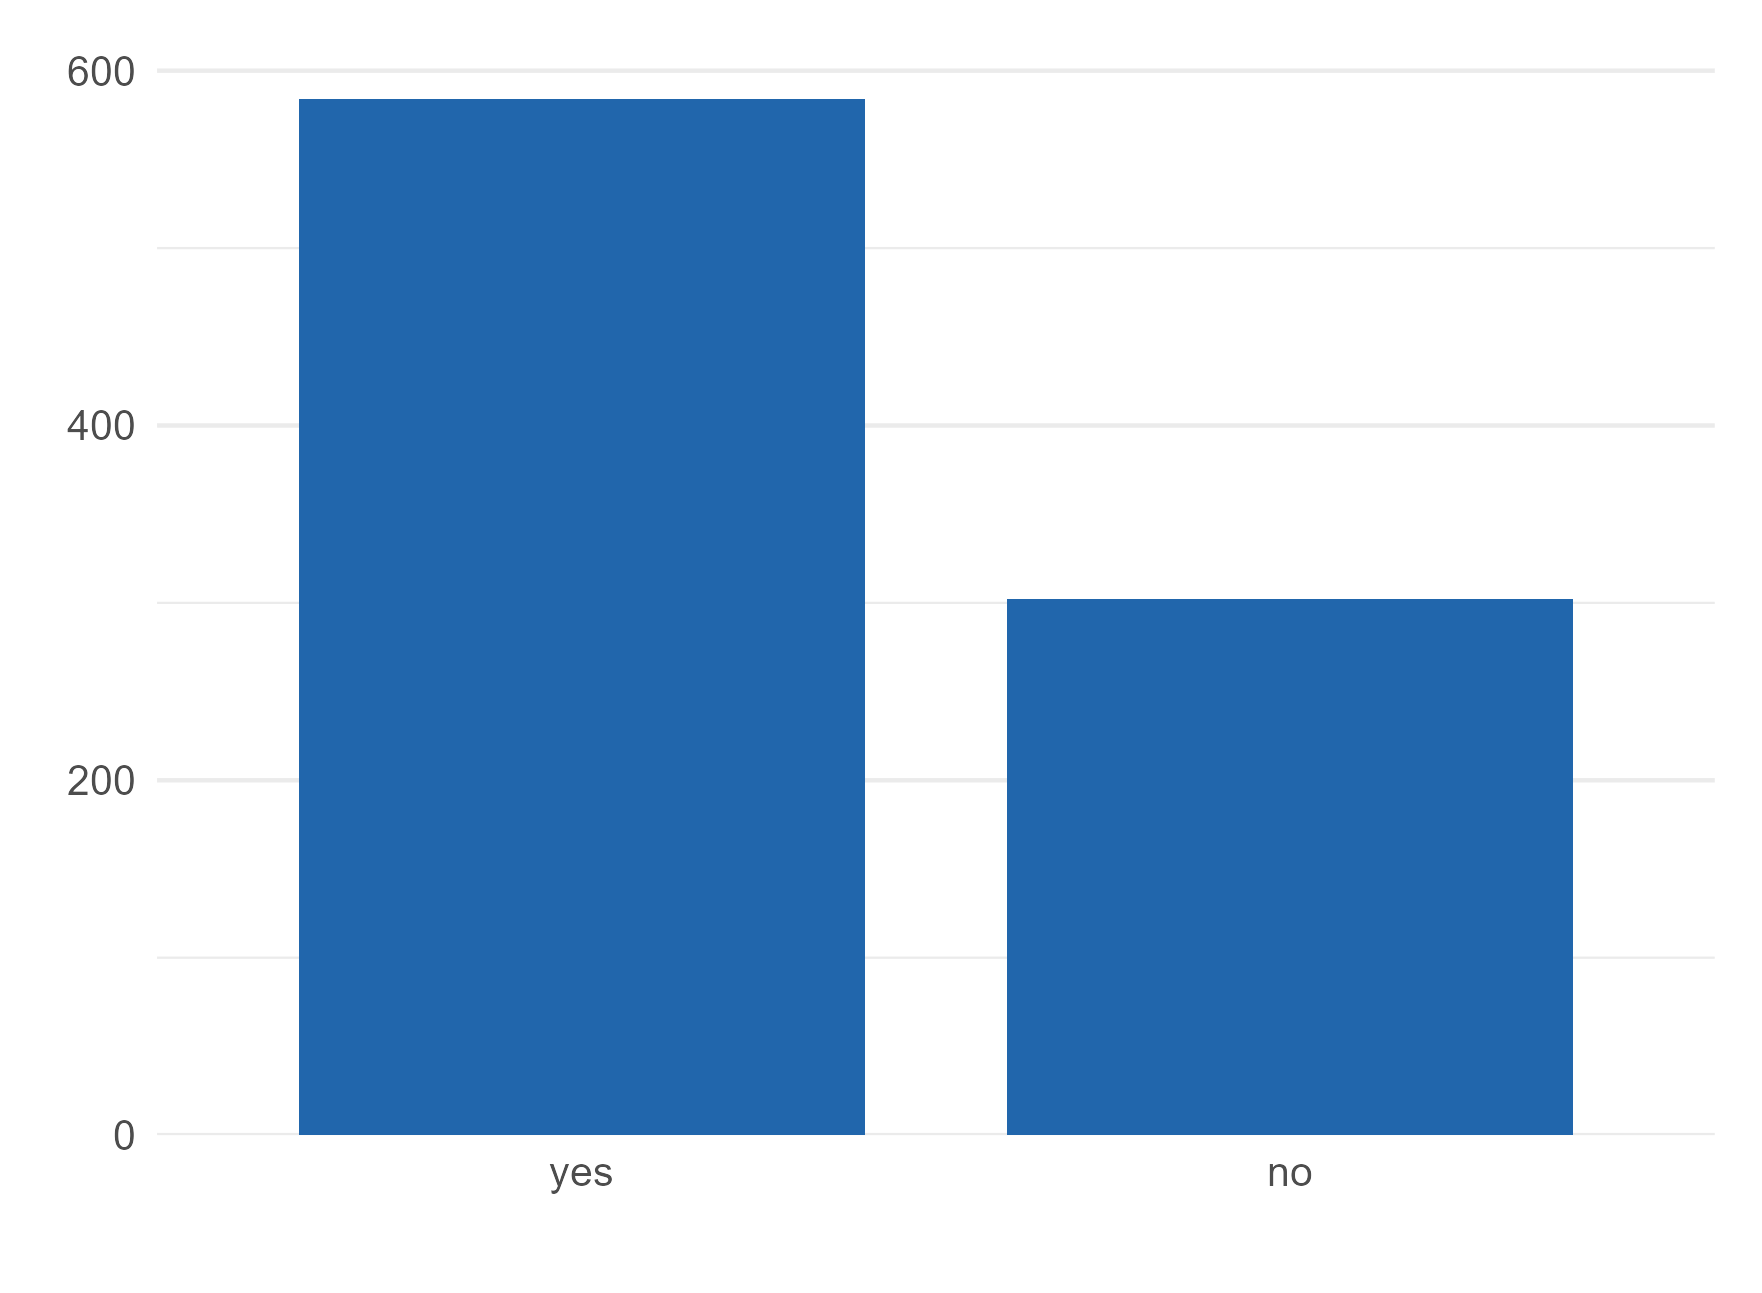
DIABETES_KNOWN_0
diab_known
Known diabetes
CONTRACEPTIVA_EVER_0
contraception
Ever taken birth control pills
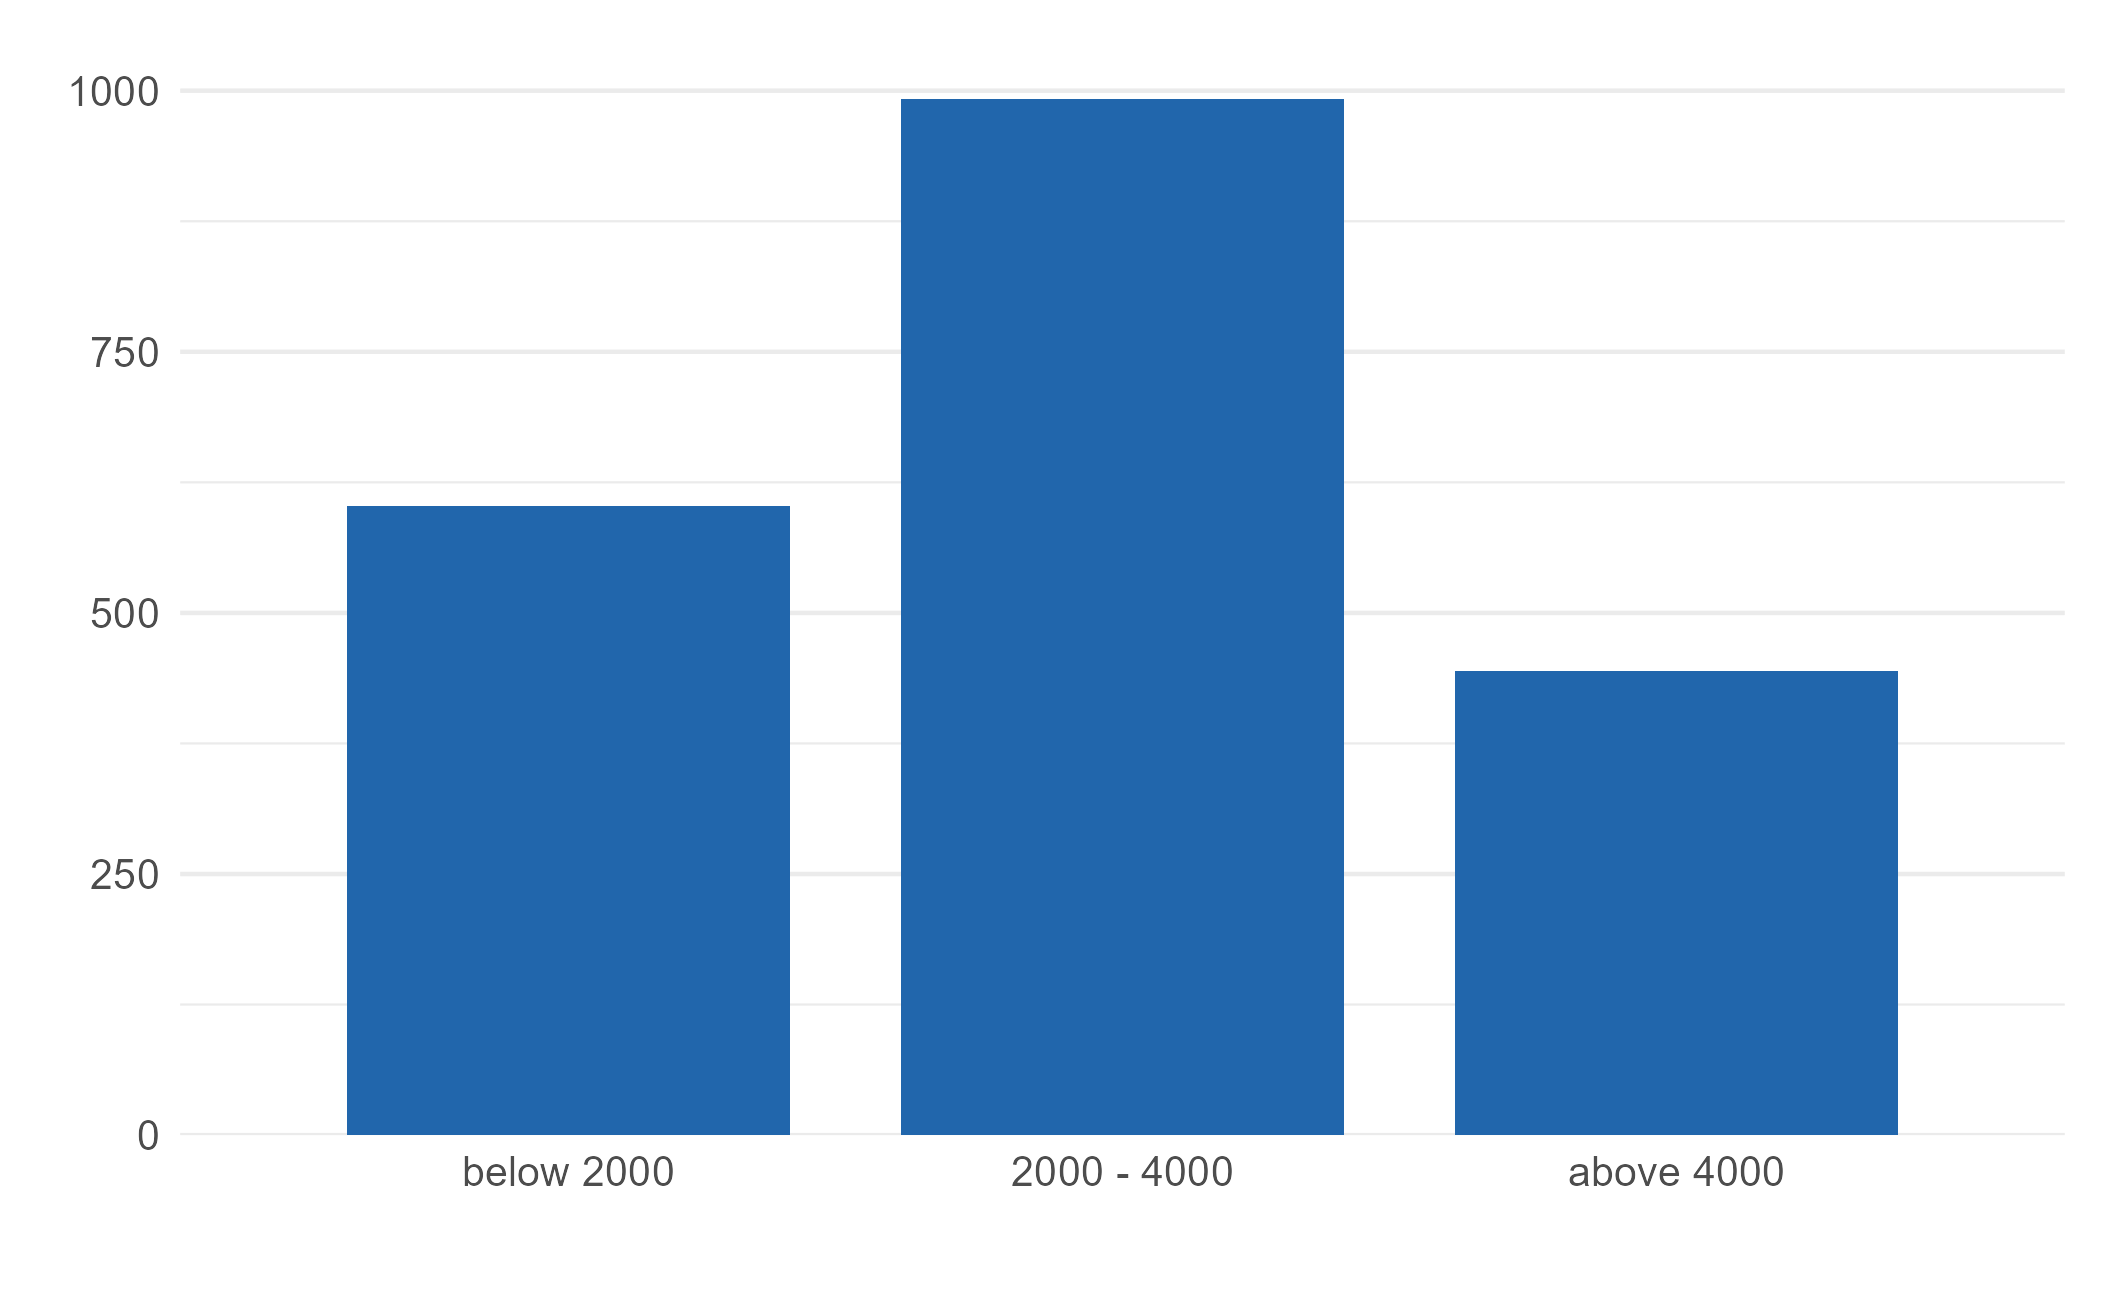
HOUSE_INCOME_MONTH_0
income
Monthly household income