Systolic blood pressure 1
sbp1 SBP_0.1
Descriptive statistics (Continuous)
Provides descriptive statistics for a subset or all continuous variables in the study data
Data type mismatch
Check if the declared data types in the metadata match the observed data types in the study data.
Missing values (Item-level)
Presence and amount of missing data for each variable, separated by class of missingness (i.e., system missingness (NA), used missing codes and jump codes). The higher the number or percentage of missing values, the lower the data quality.
Note:
1. “ADDED: SysMiss” or “Sysmiss N” refers to NA’s (i.e., system-indicated missing values);
2. The percentage of all the columns in the table (except Measurements N (%)) are calculated over the Observation N. The percentage of Measurement N is calculated by dividing the value (Measurement N) by the difference between the number of observations and the number of jumps (Observation N - Jumps N).
‘ADDED: SysMiss’ for “SBP_0.1” is 2
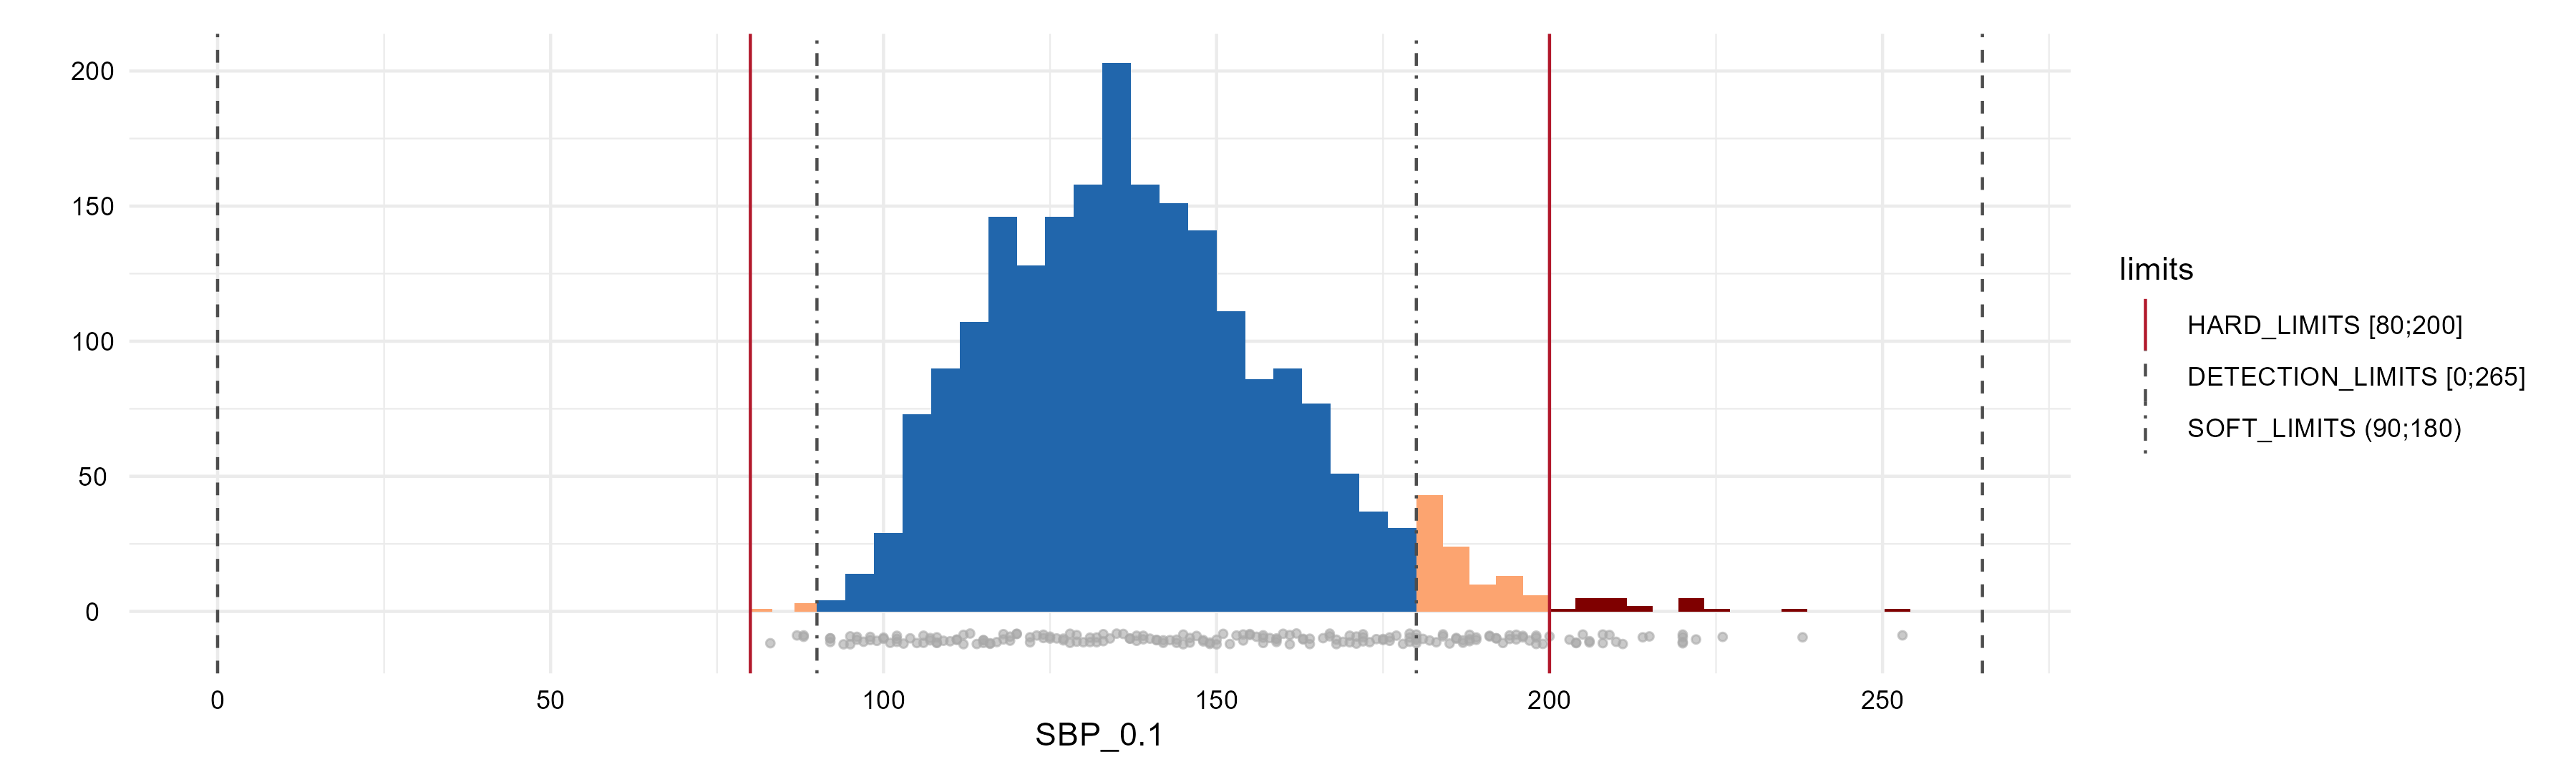
Range violations
Check applied to numerical or time-date variables. If a range of values is provided in the metadata, the presence of values outside the interval is checked. These can be: inadmissible values (hard limits), improbable but plausible values (soft limits), or values outside measurement ranges (detection limits). The higher the number or percentage of values outside the limits, the lower the data quality.
Attention: values outside hard limits are removed from the following quality checks.
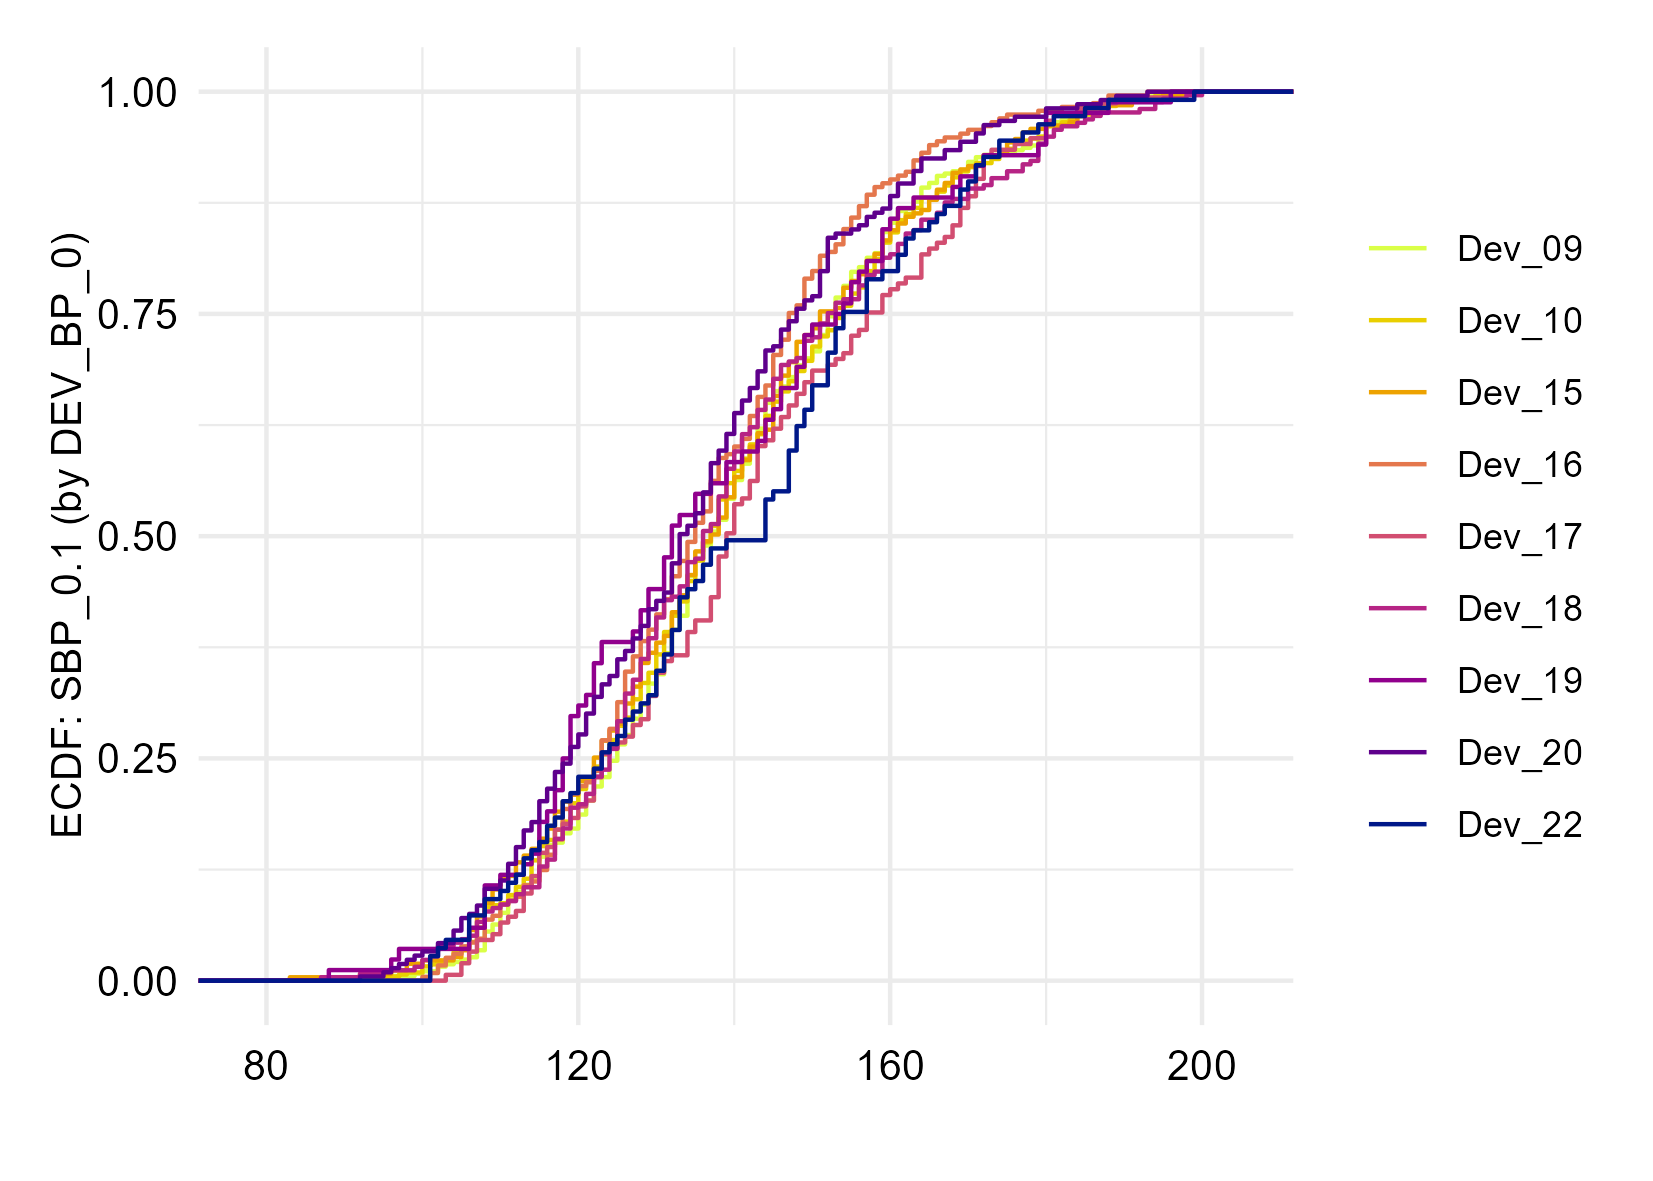
Cumulative distribution device
stratified ECDF Plots help find observer differences
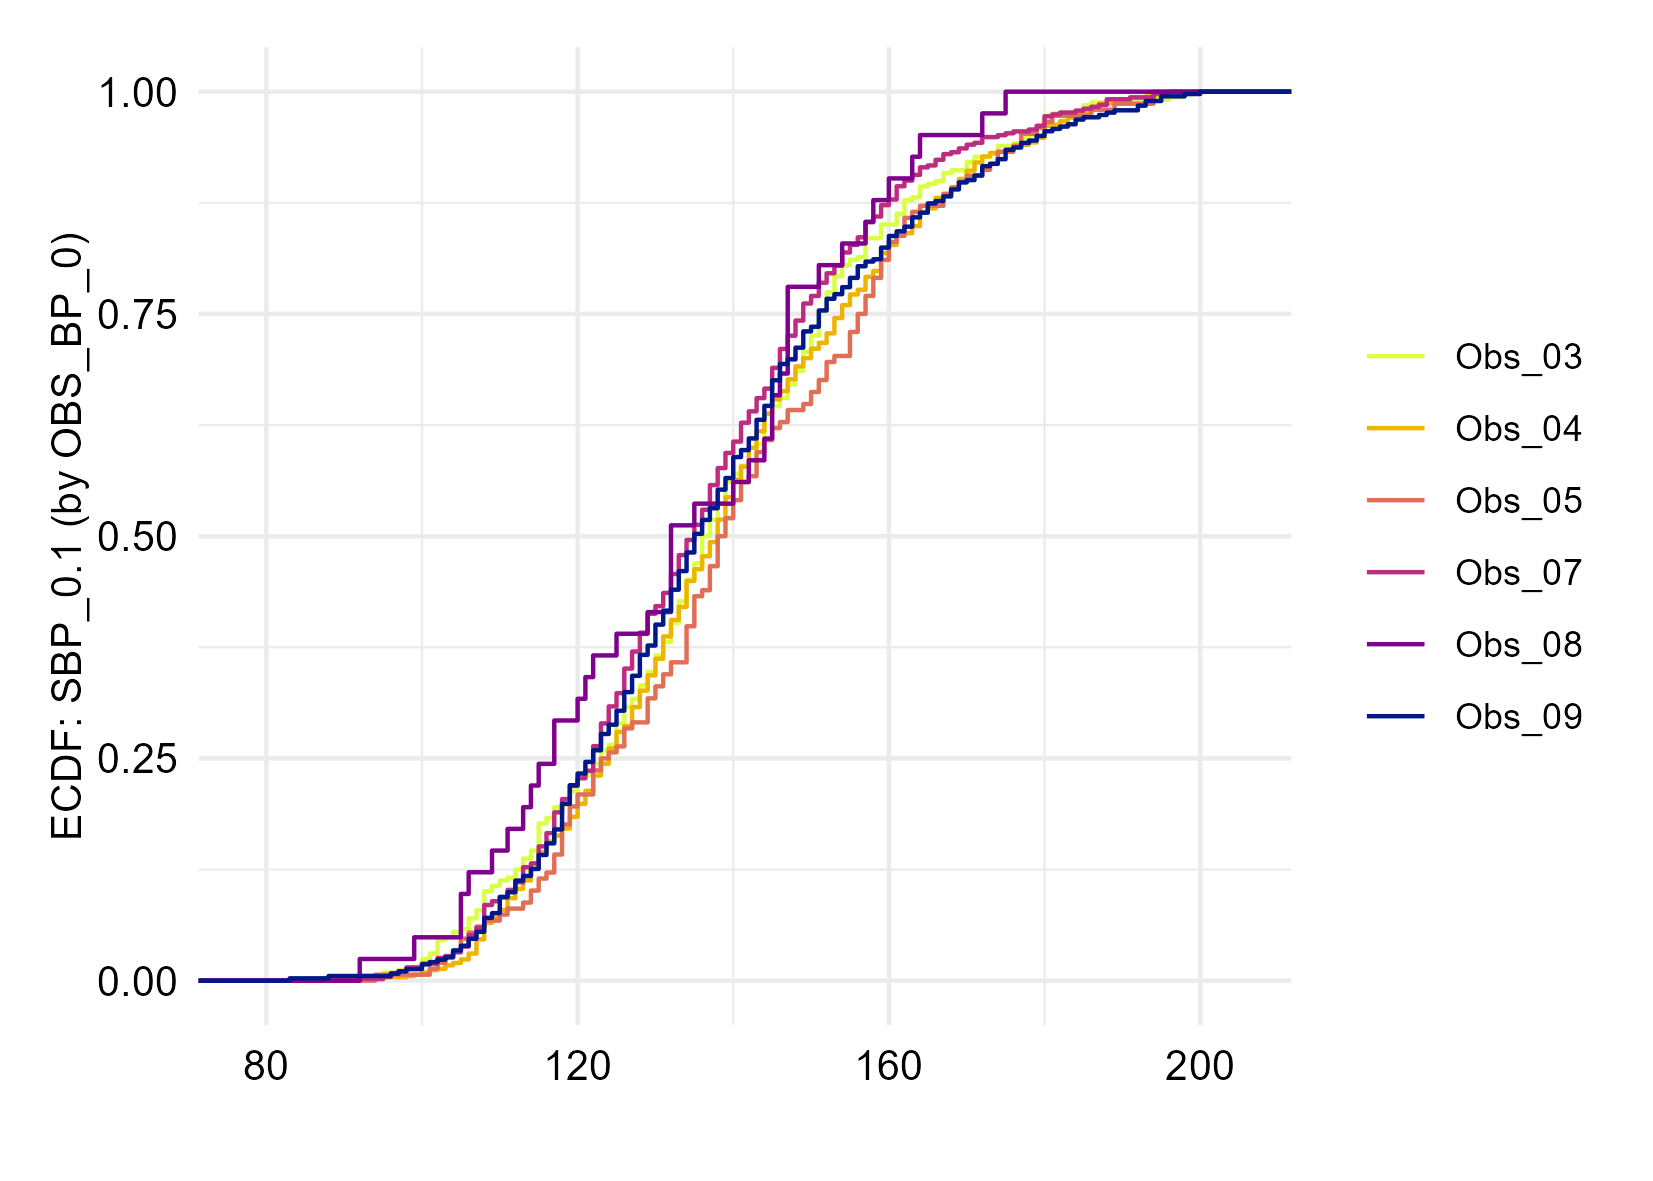
Cumulative distribution observer
stratified ECDF Plots help find observer differences
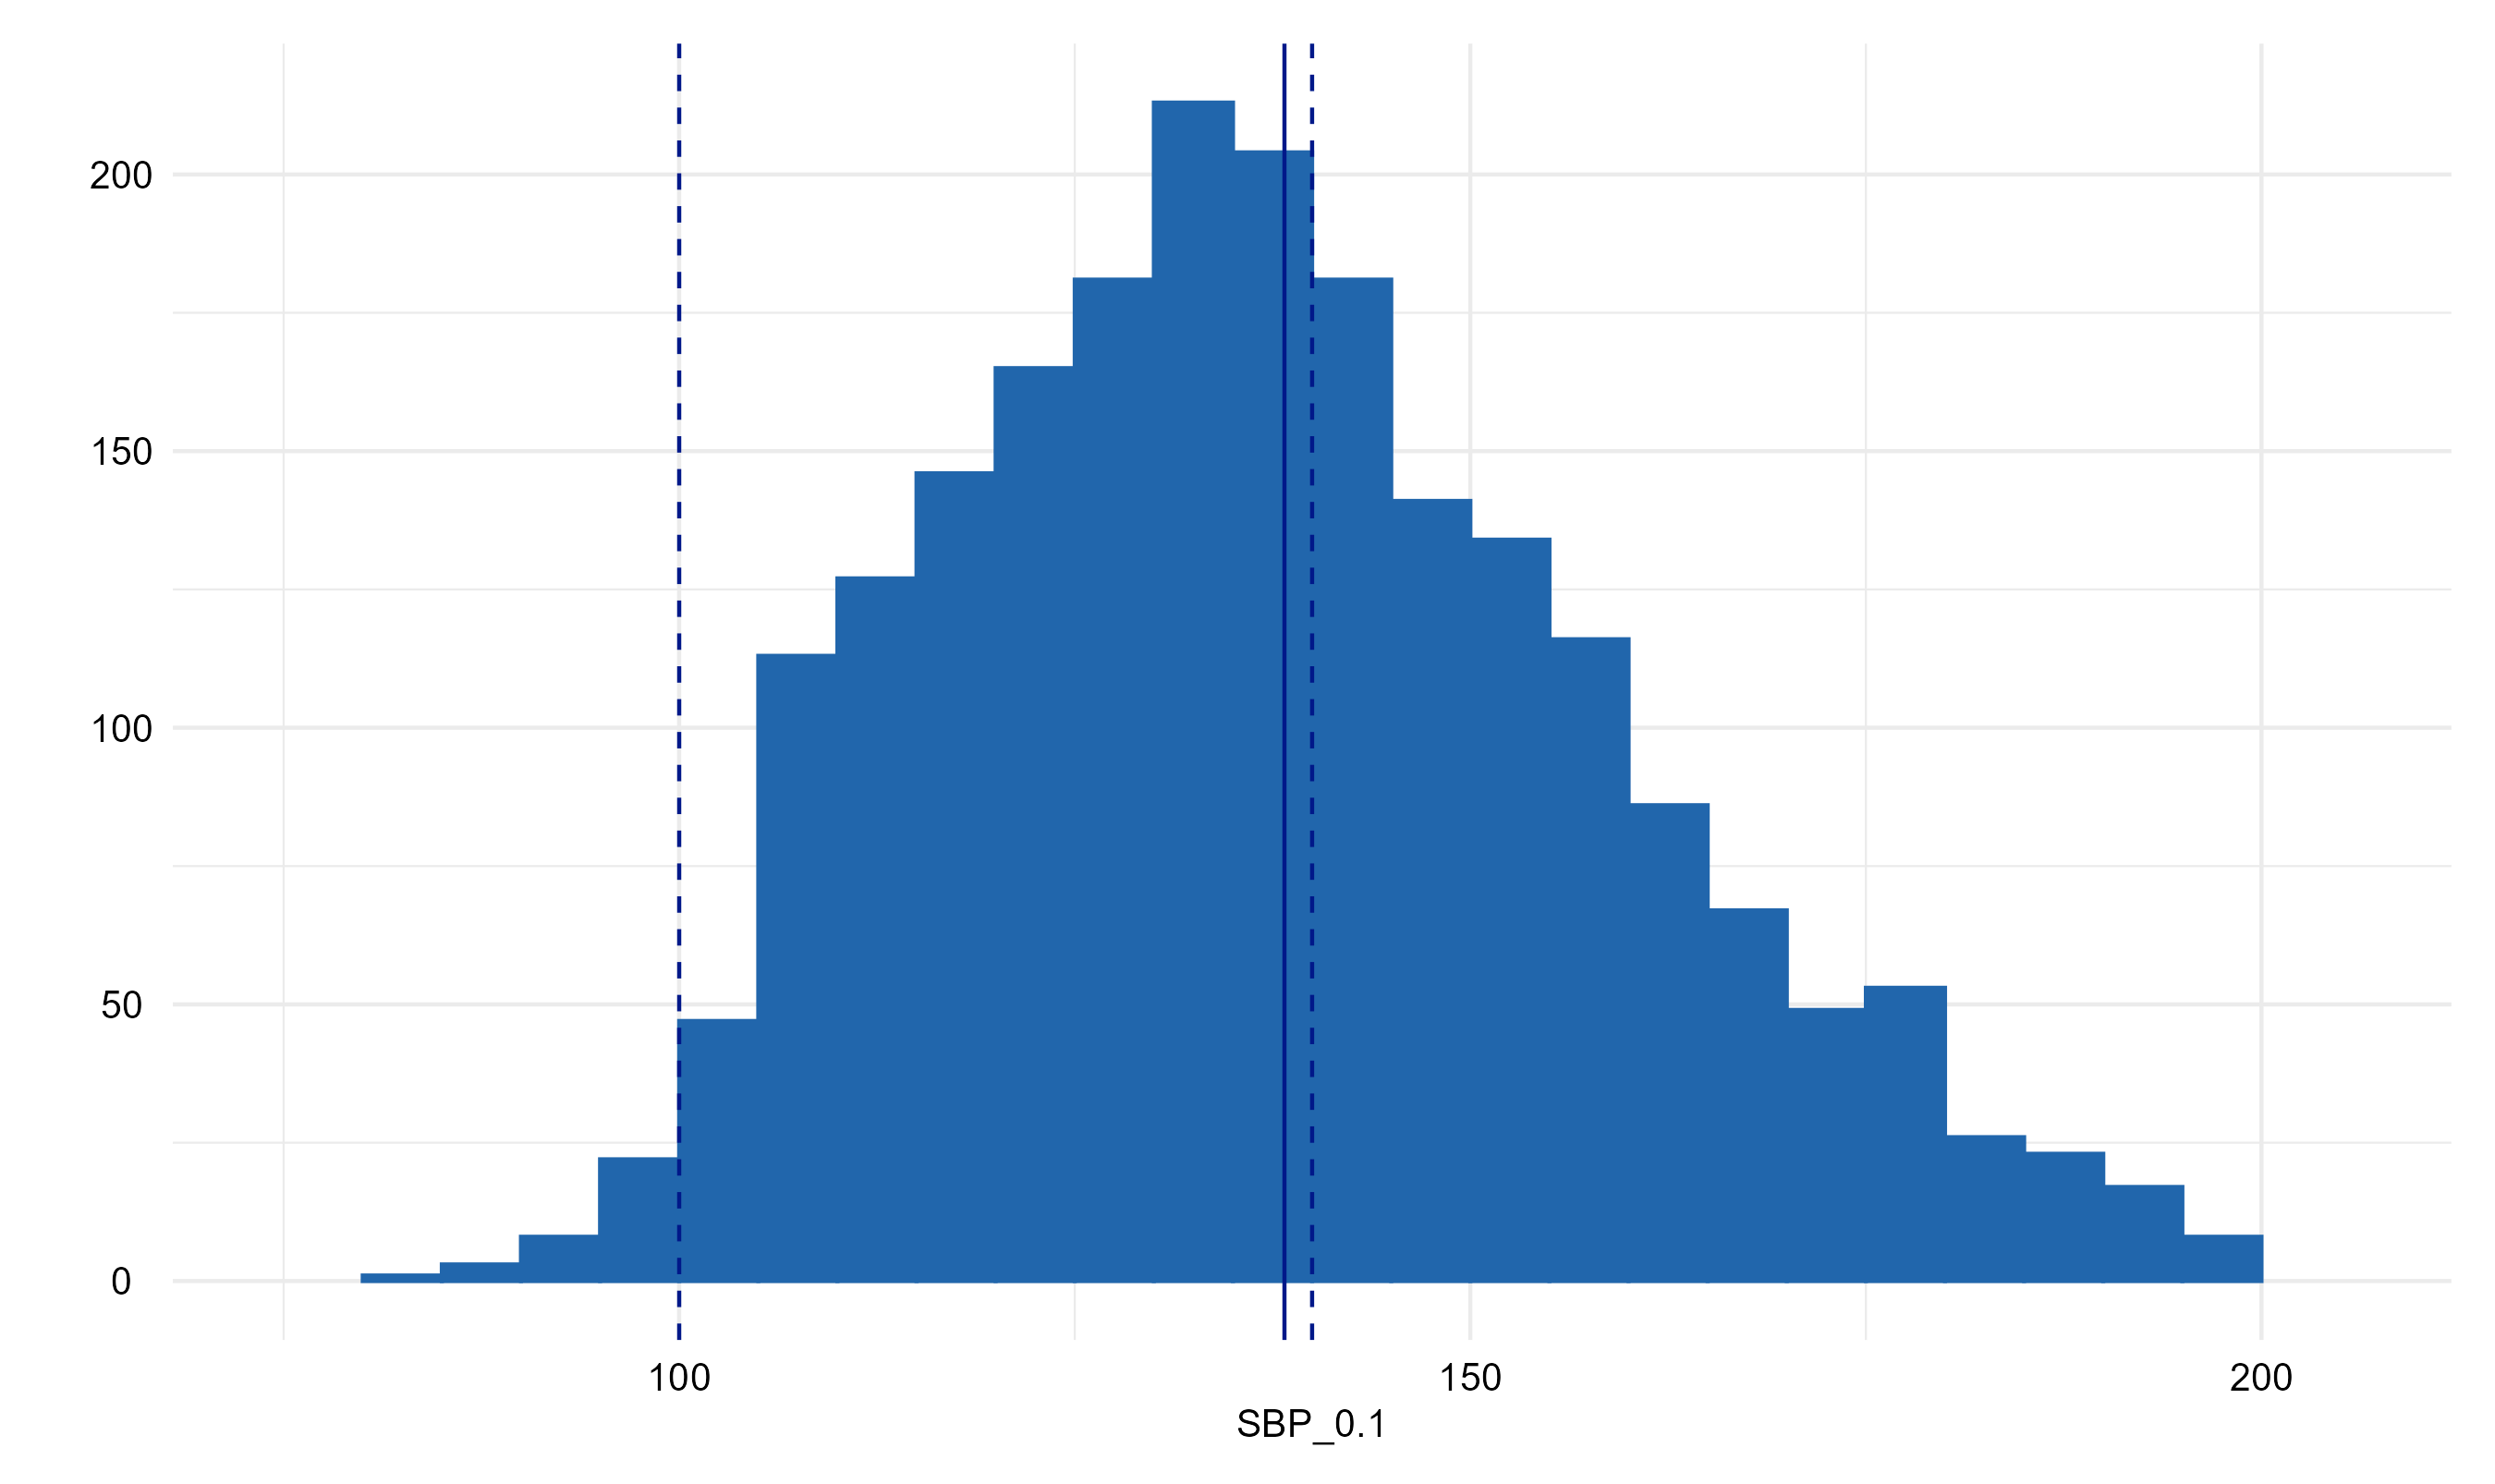
Unexpected mean/median
Checks if the mean/median of a variable is within an expected range provided in the metadata. This data quality check is performed if the metadata contains information about what to check (LOCATION METRIC = mean or median) and about the range (LOCATION_RANGE = the interval of values in which the mean/median should be, e.g., [90; 120]).
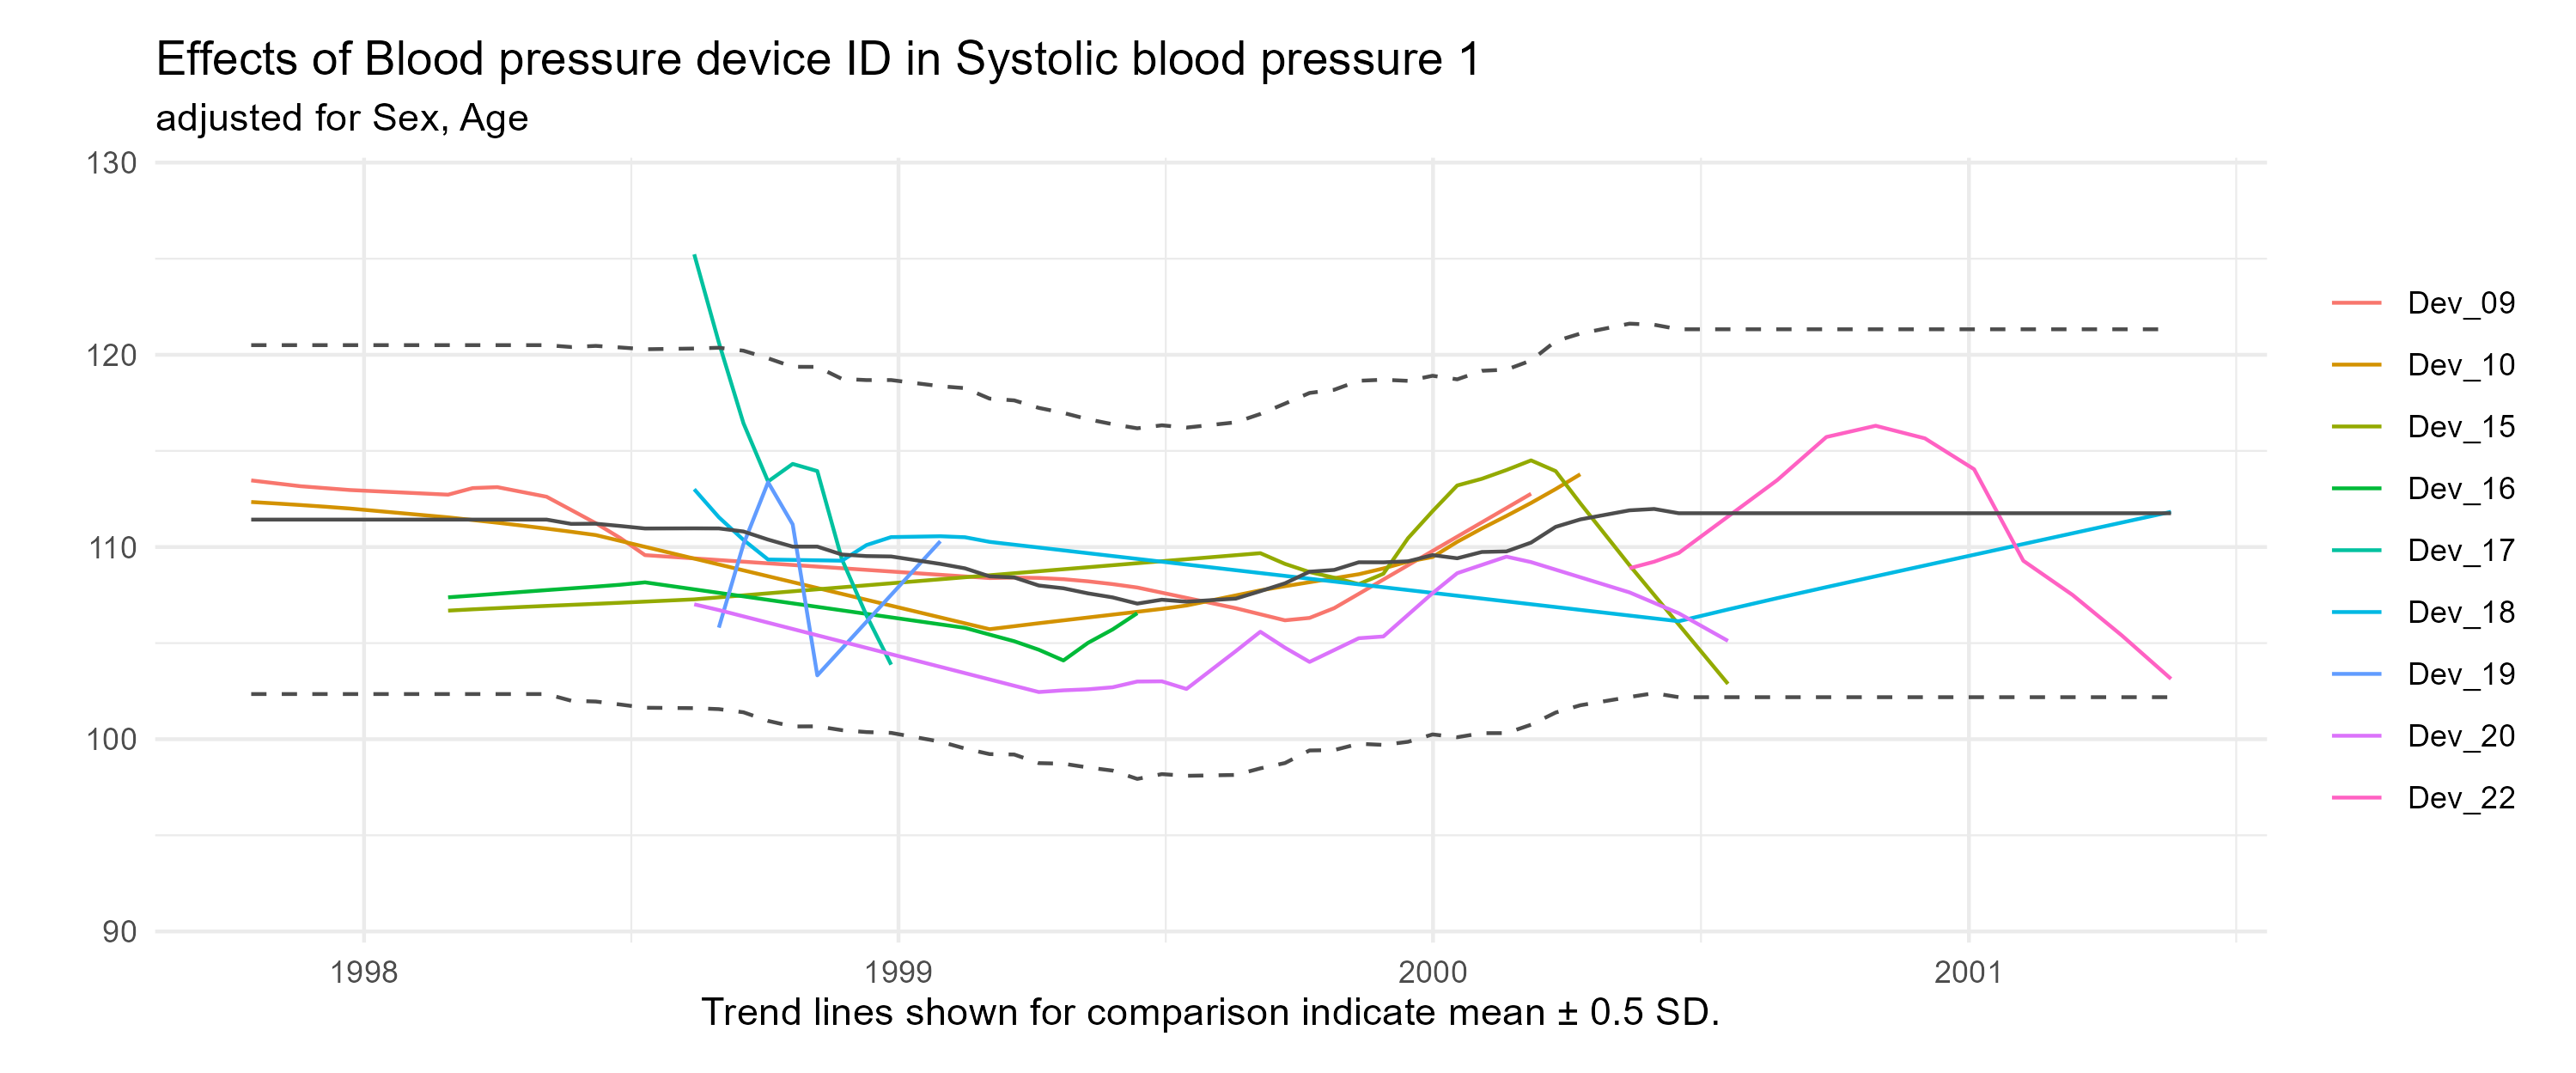
Time trend device
Lowess regression models are used to display time trends and potential effects of instruments used or examiners on the measurements. Background knowledge is needed to interpret the graph. Typically the further the graphs for different devices or examiners are apart from each other, the bigger the instruments or examiners effect.
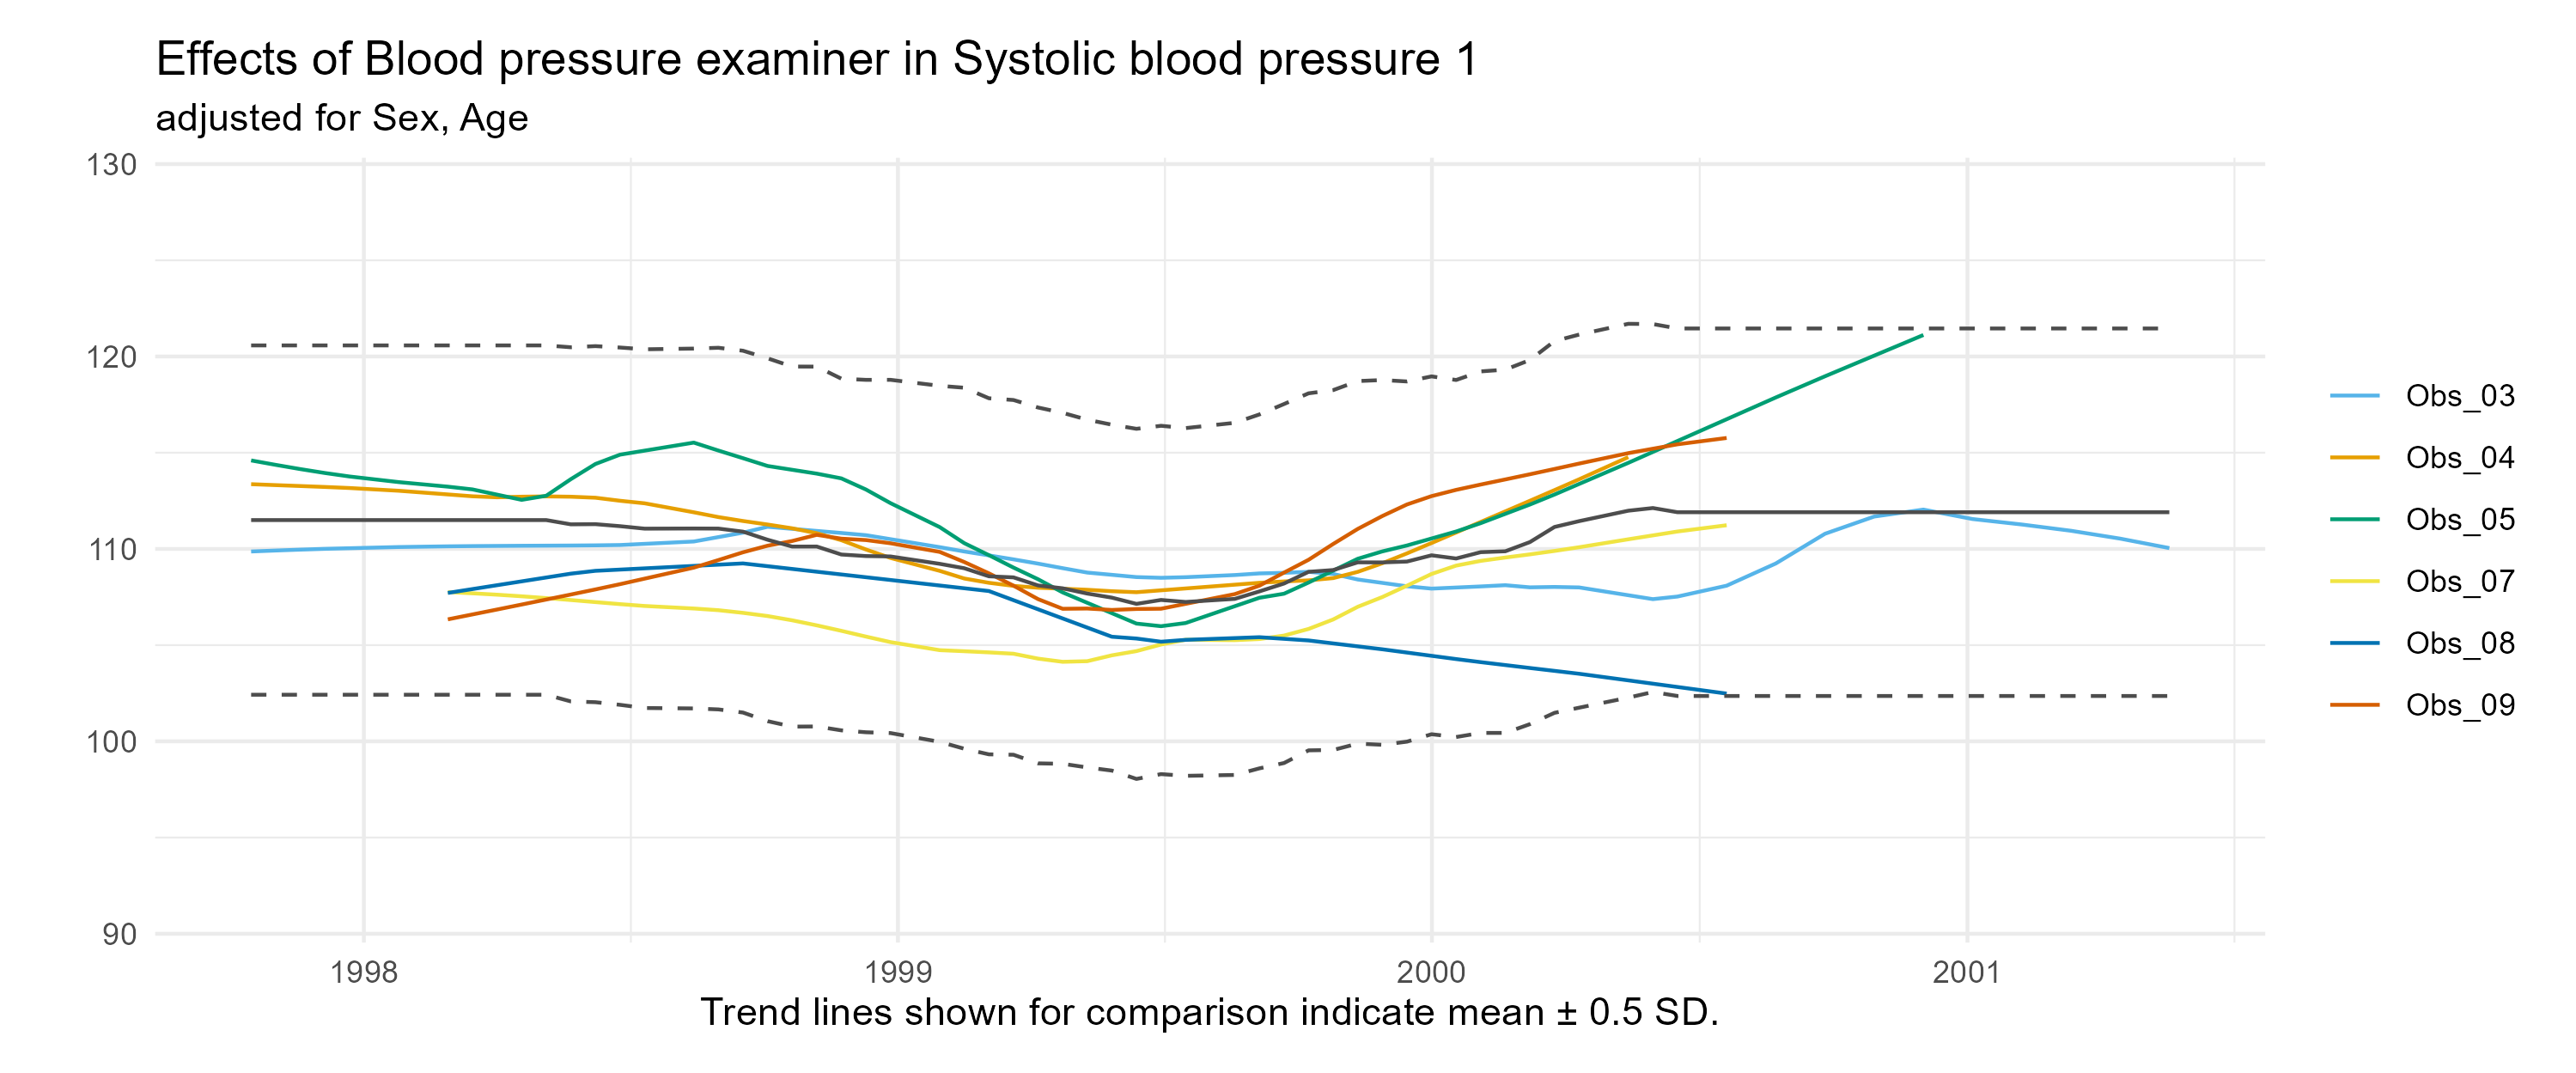
Time trend observer
Lowess regression models are used to display time trends and potential effects of instruments used or examiners on the measurements. Background knowledge is needed to interpret the graph. Typically the further the graphs for different devices or examiners are apart from each other, the bigger the instruments or examiners effect.
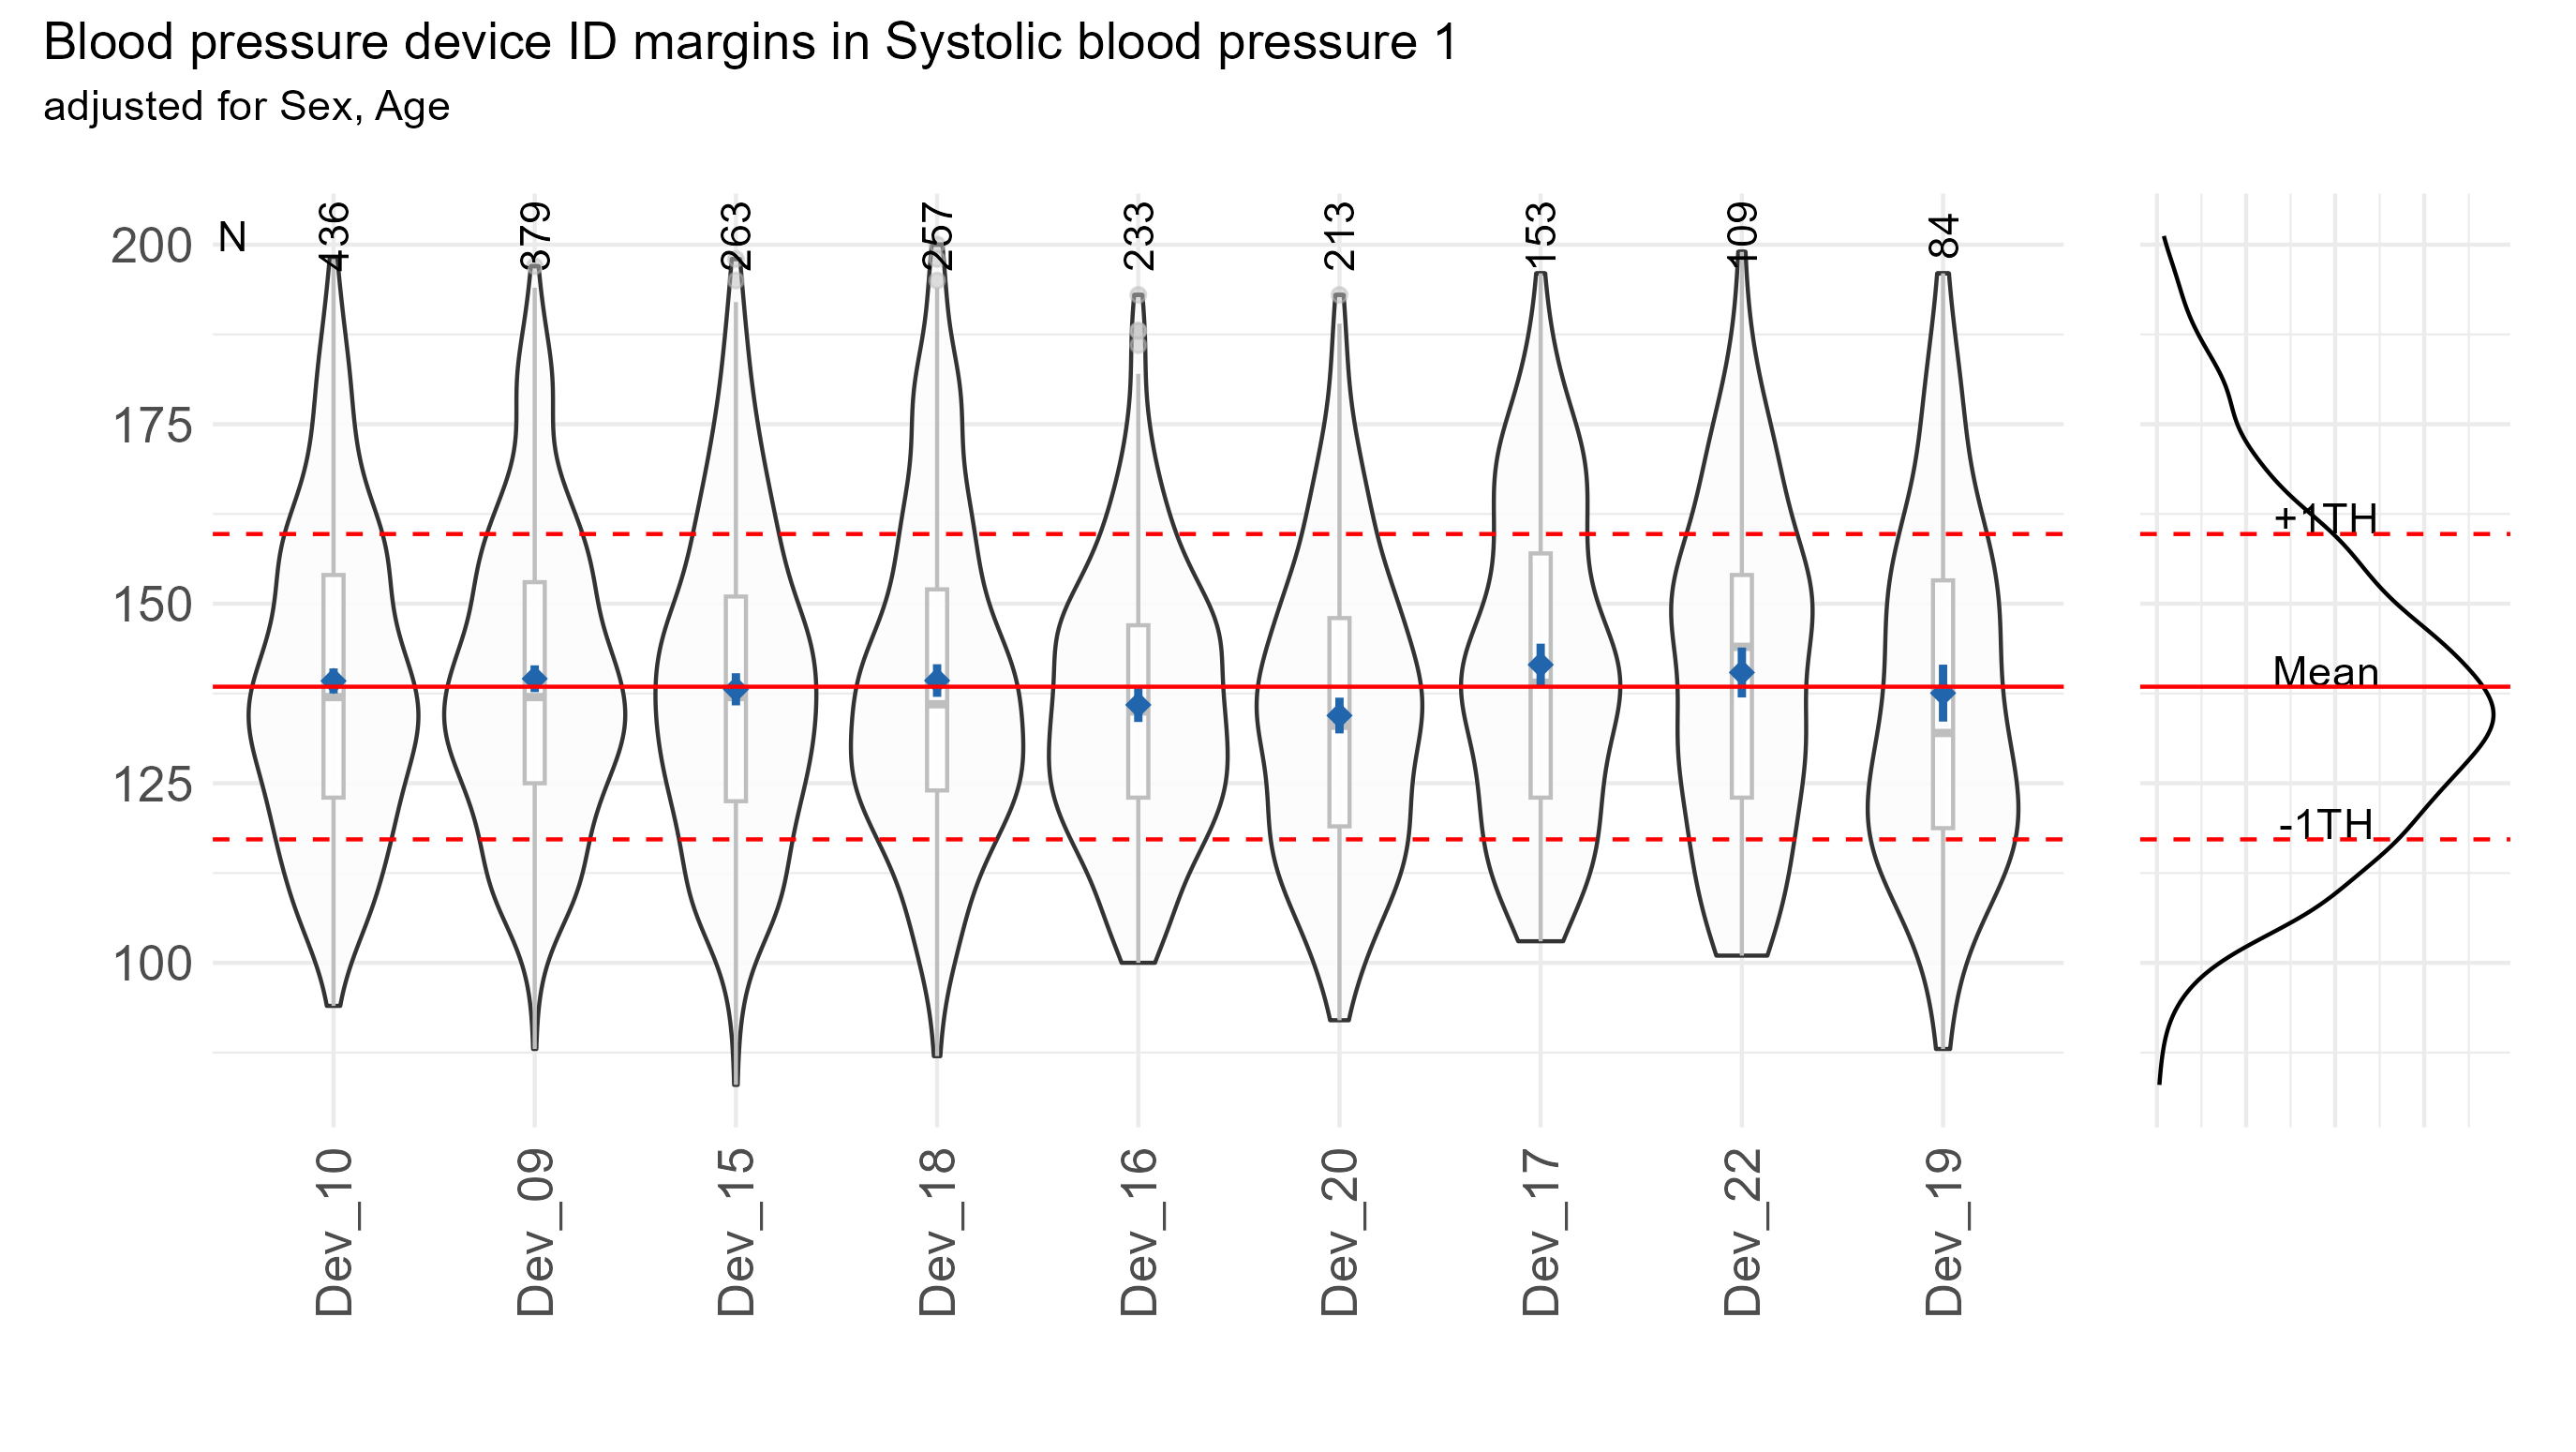
Distribution across device
Marginal distribution per device or observer and overall distribution are reported to check for the presence of an effect of the instrument or observer on the measurements obtained. Background knowledge is needed to interpret the graphs.
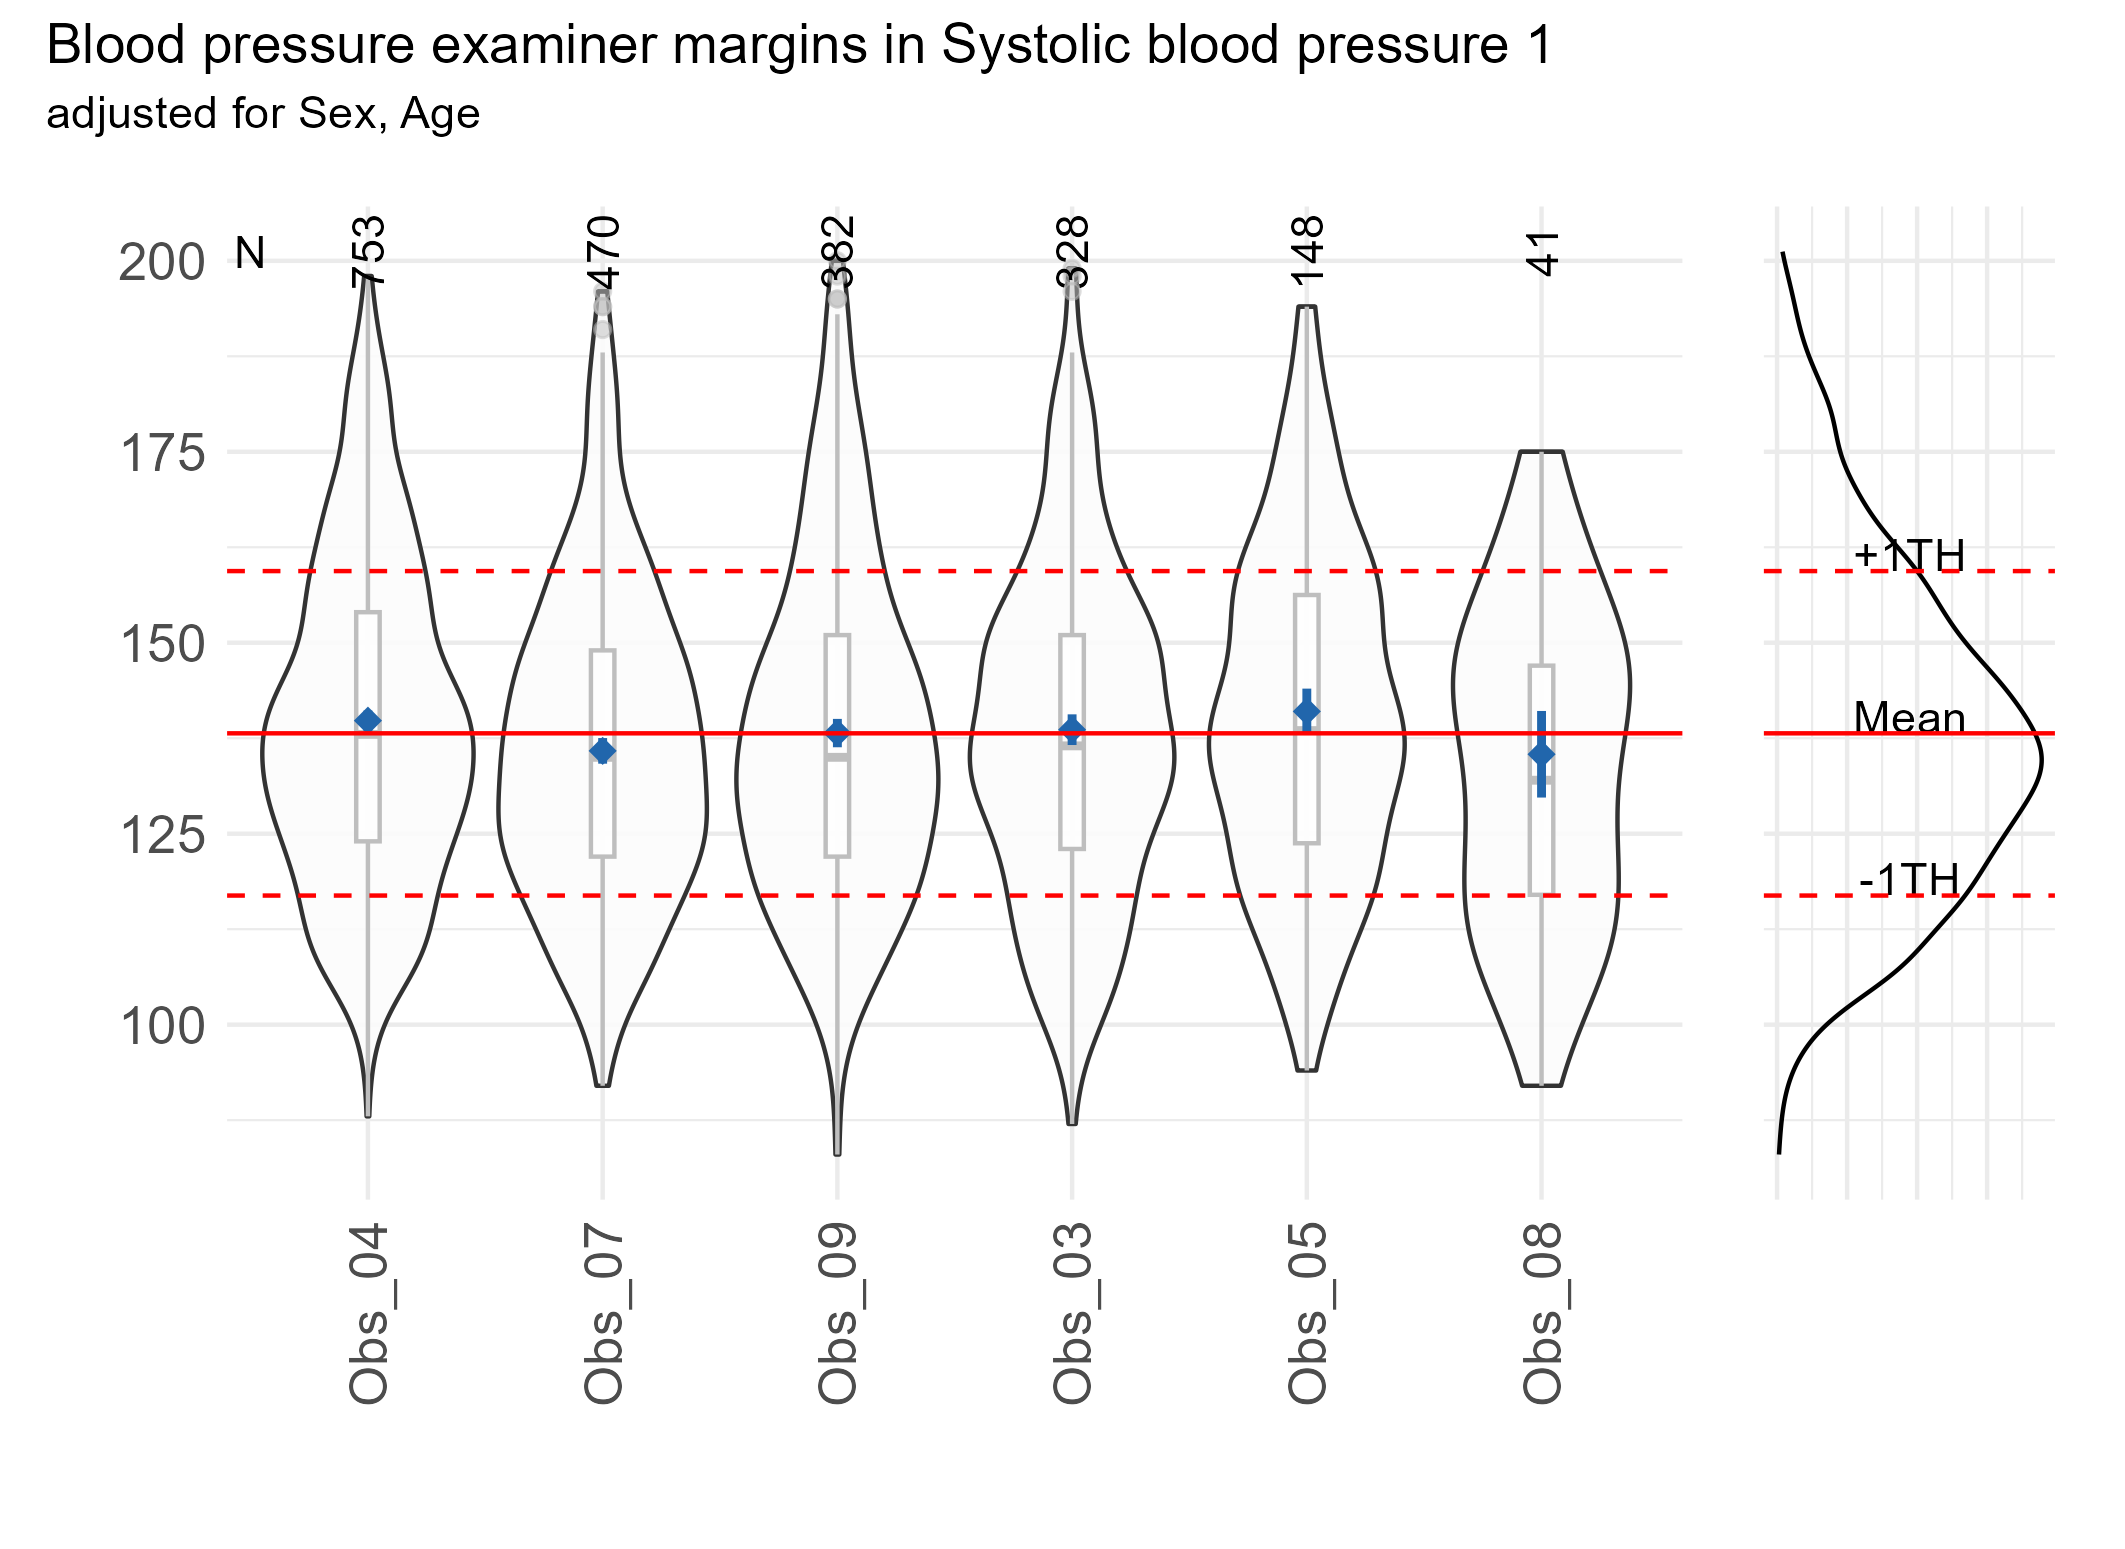
Distribution across observer
Marginal distribution per device or observer and overall distribution are reported to check for the presence of an effect of the instrument or observer on the measurements obtained. Background knowledge is needed to interpret the graphs.
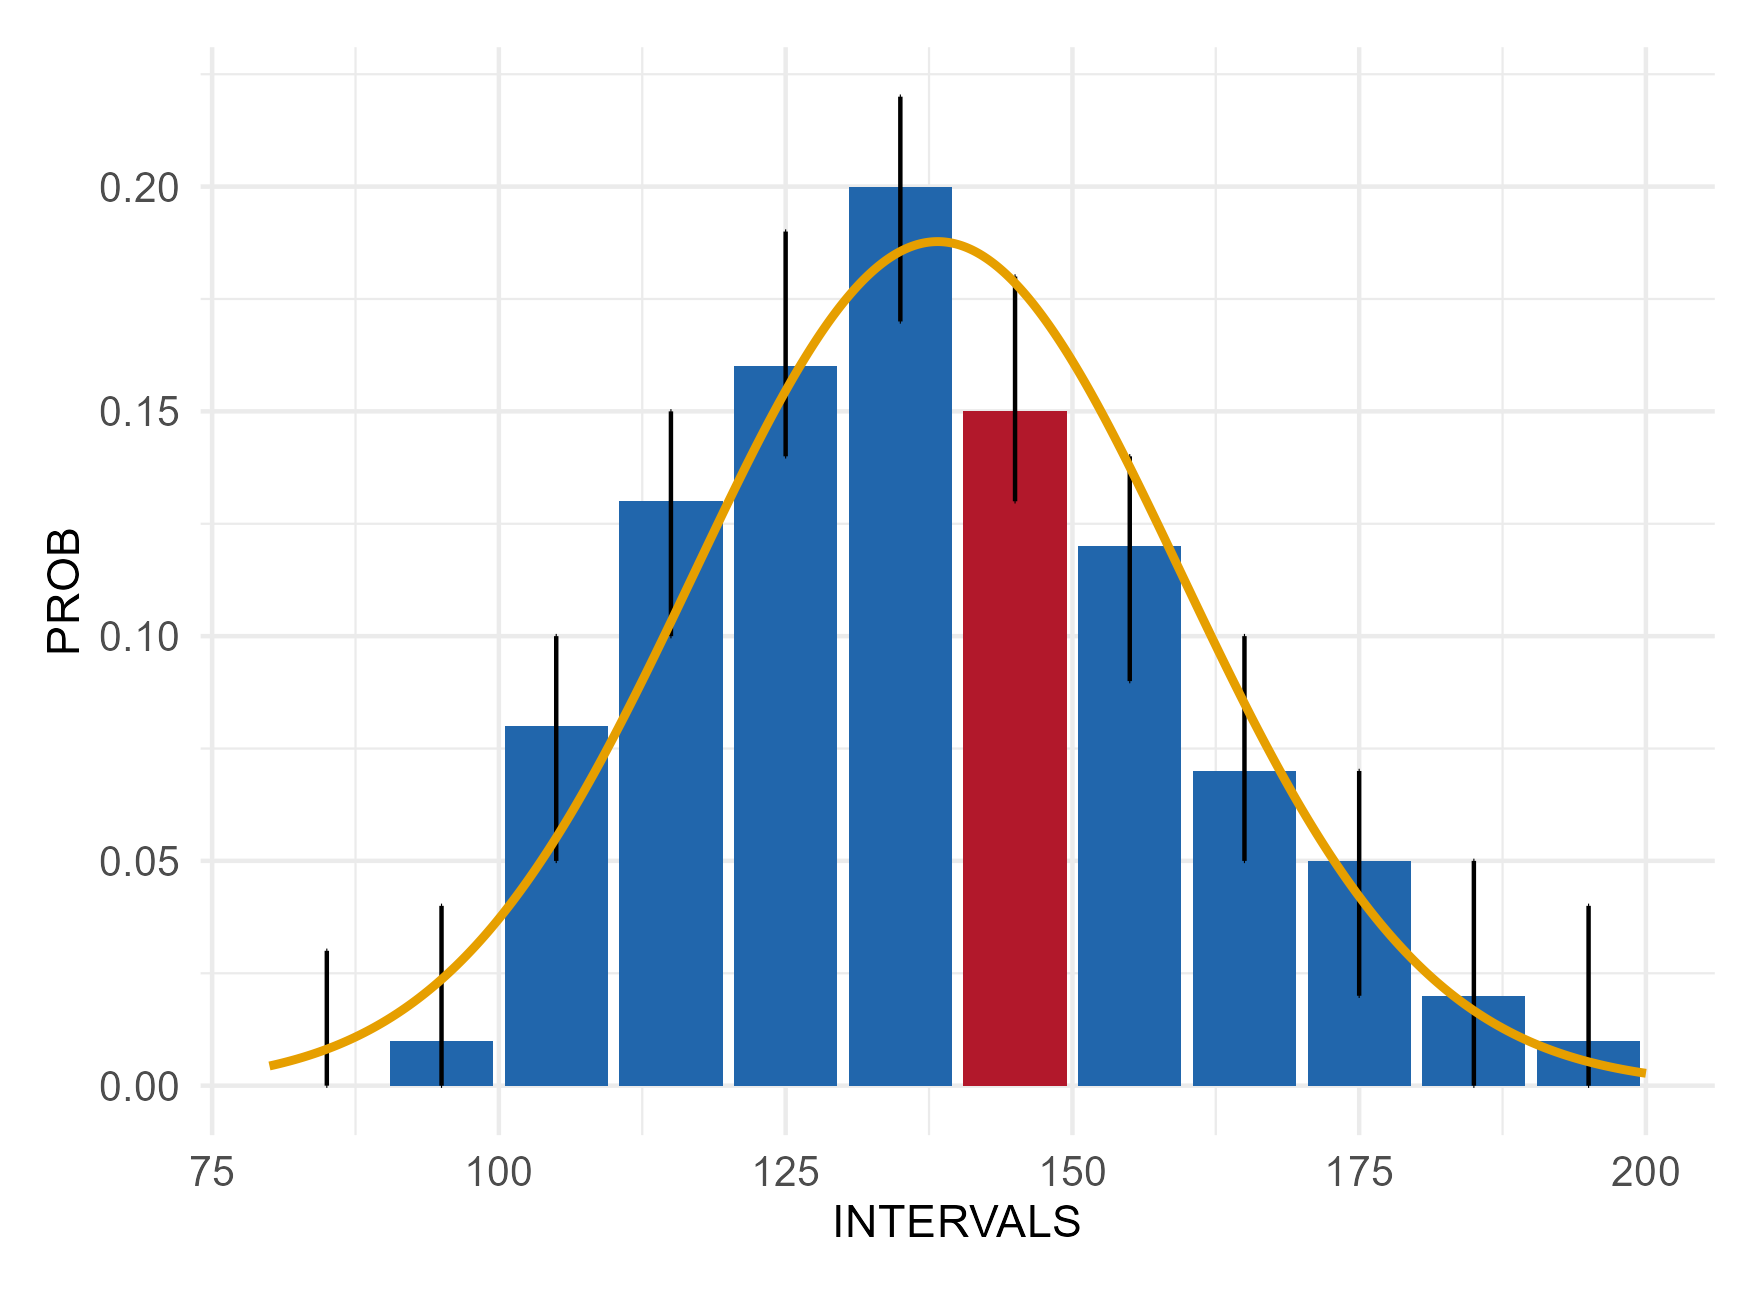
Unexpected distribution shape
Checks if single intervals in the graph created using the study data deviate significantly from a theoretical distribution expected from the metadata (solid yellow line). The distribution of a variable is defined in the column DISTRIBUTION in the metadata (e.g., normal), whereas the parameters are derived from the empirical data.
The higher the number of identified intervals deviating from the expected distribution, the lower potentially the data quality.
Note: sample size considerations and the graph should be taken into account in addition to the test results.
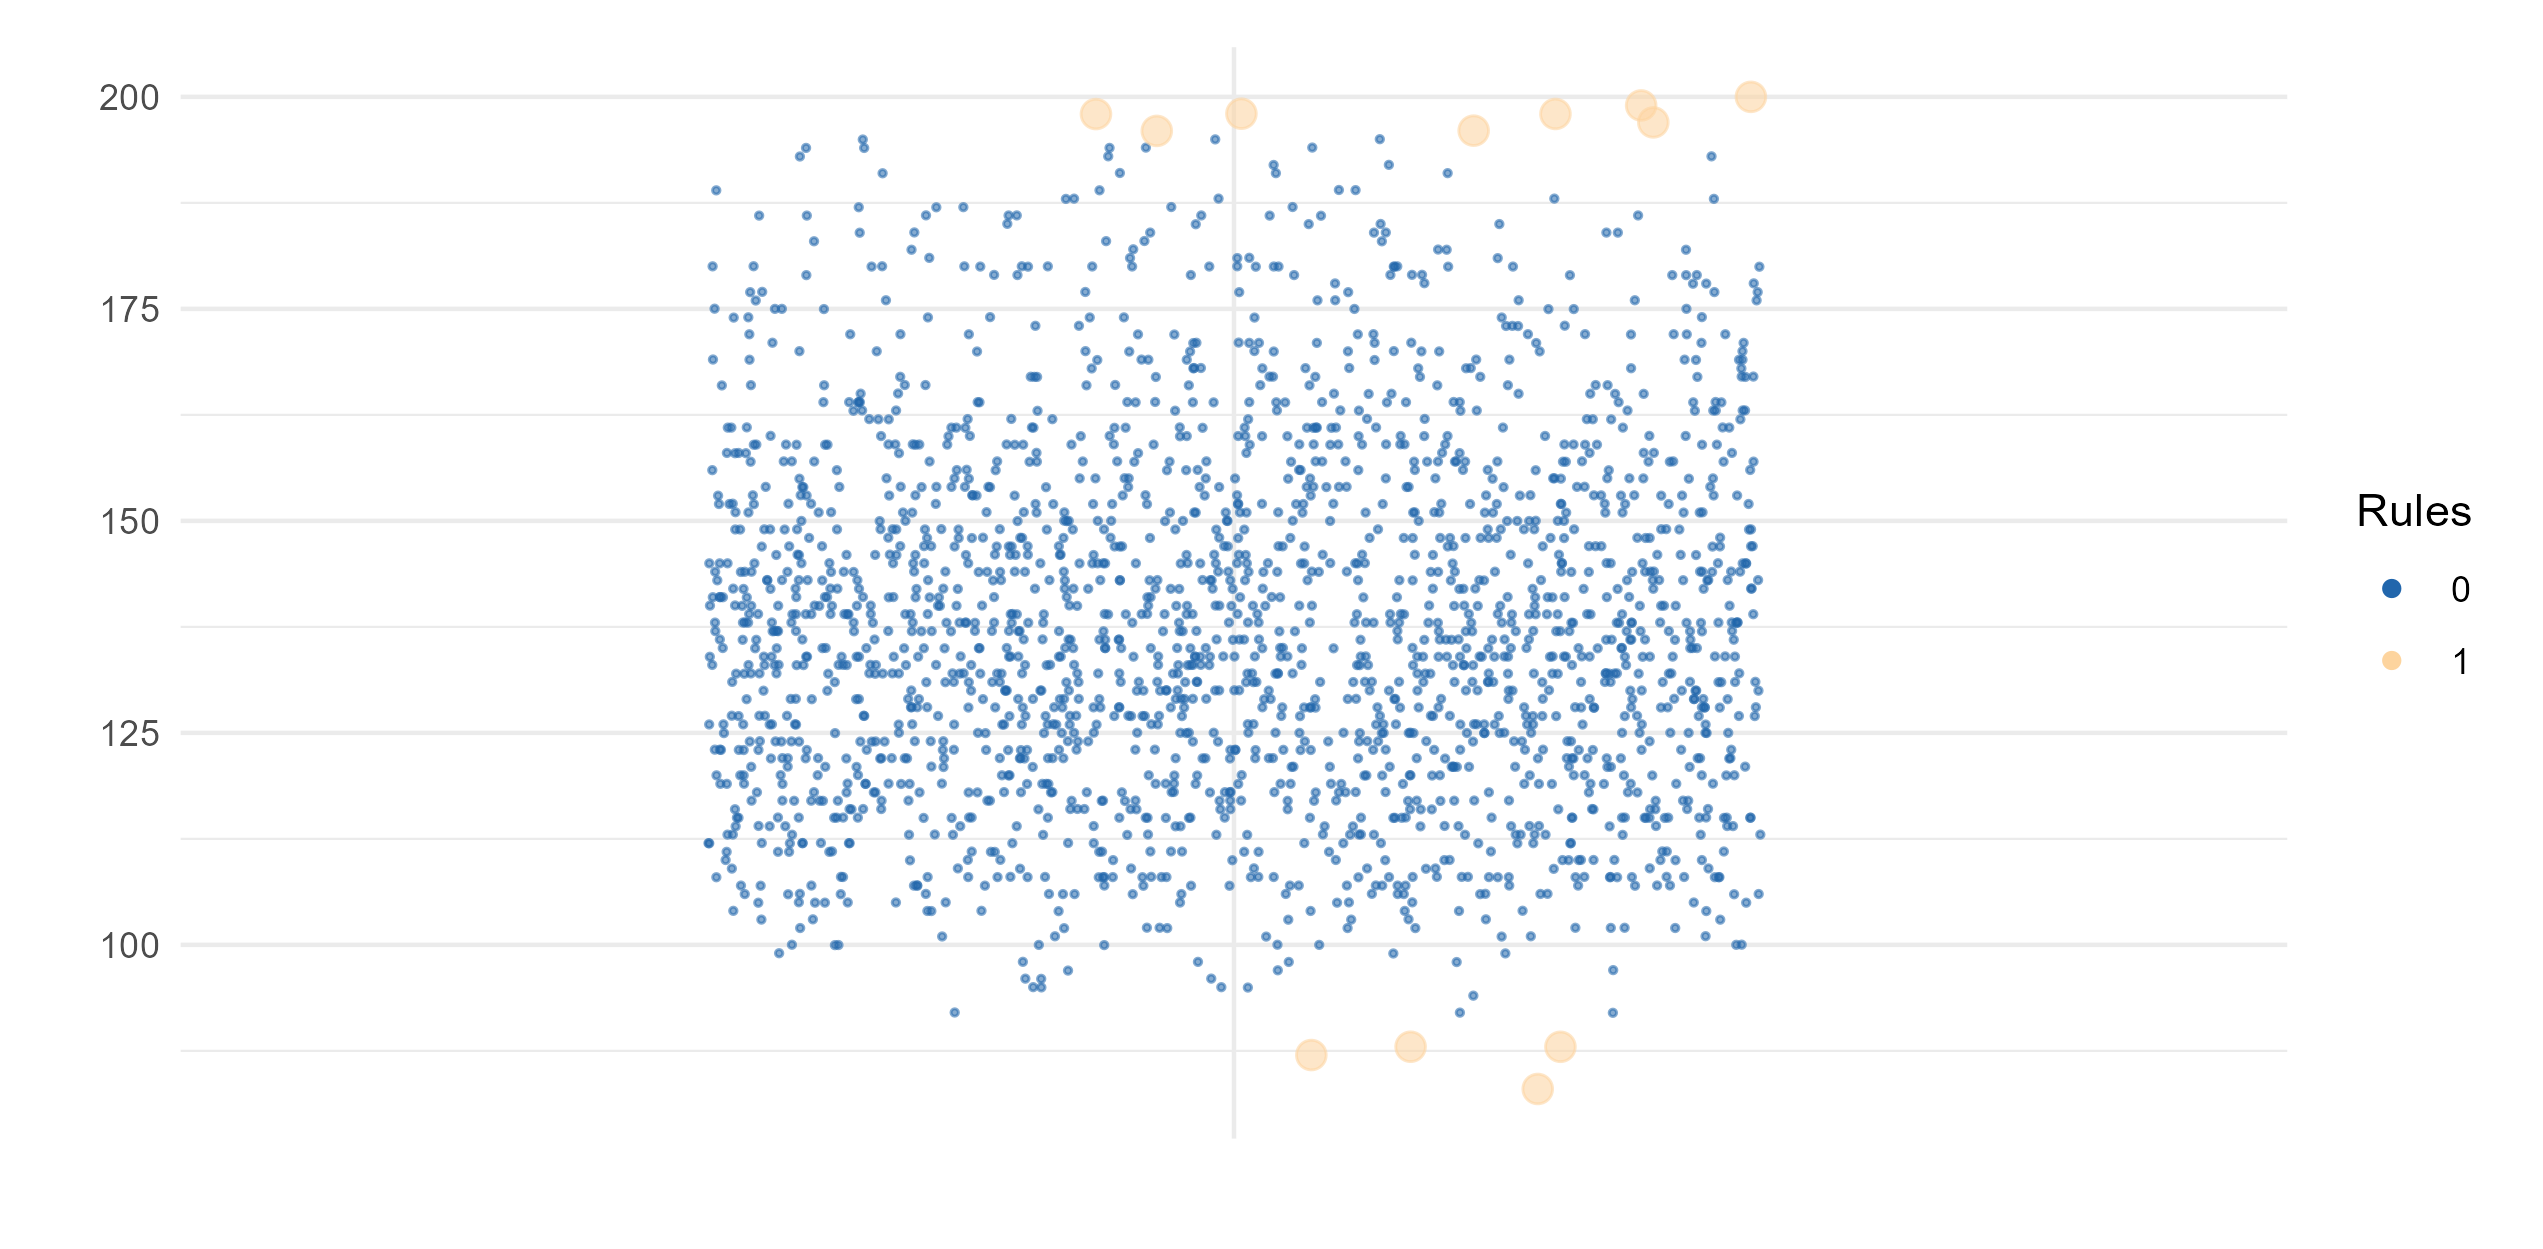
Univariate outliers
Presence of outliers in the study data are checked using 4 approaches (Tukey, 3SD, Hubert, and SigmaGap). For each value it is indicated how many approaches identifies it as outlier (0 = not an outlier, 4 = an outlier based on 4 approaches).
The higher the number or percentage of identified outliers, the lower potentially the data quality.
Variance proportion device
Checks the effect of different devices or observers on measurements through variance based models and intra-class correlations (ICC).
The closer to 1 the ICC value is, the lower the data quality.
Note: this check employs a model.
Variance proportion observer
Checks the effect of different devices or observers on measurements through variance based models and intra-class correlations (ICC).
The closer to 1 the ICC value is, the lower the data quality.
Note: this check employs a model.