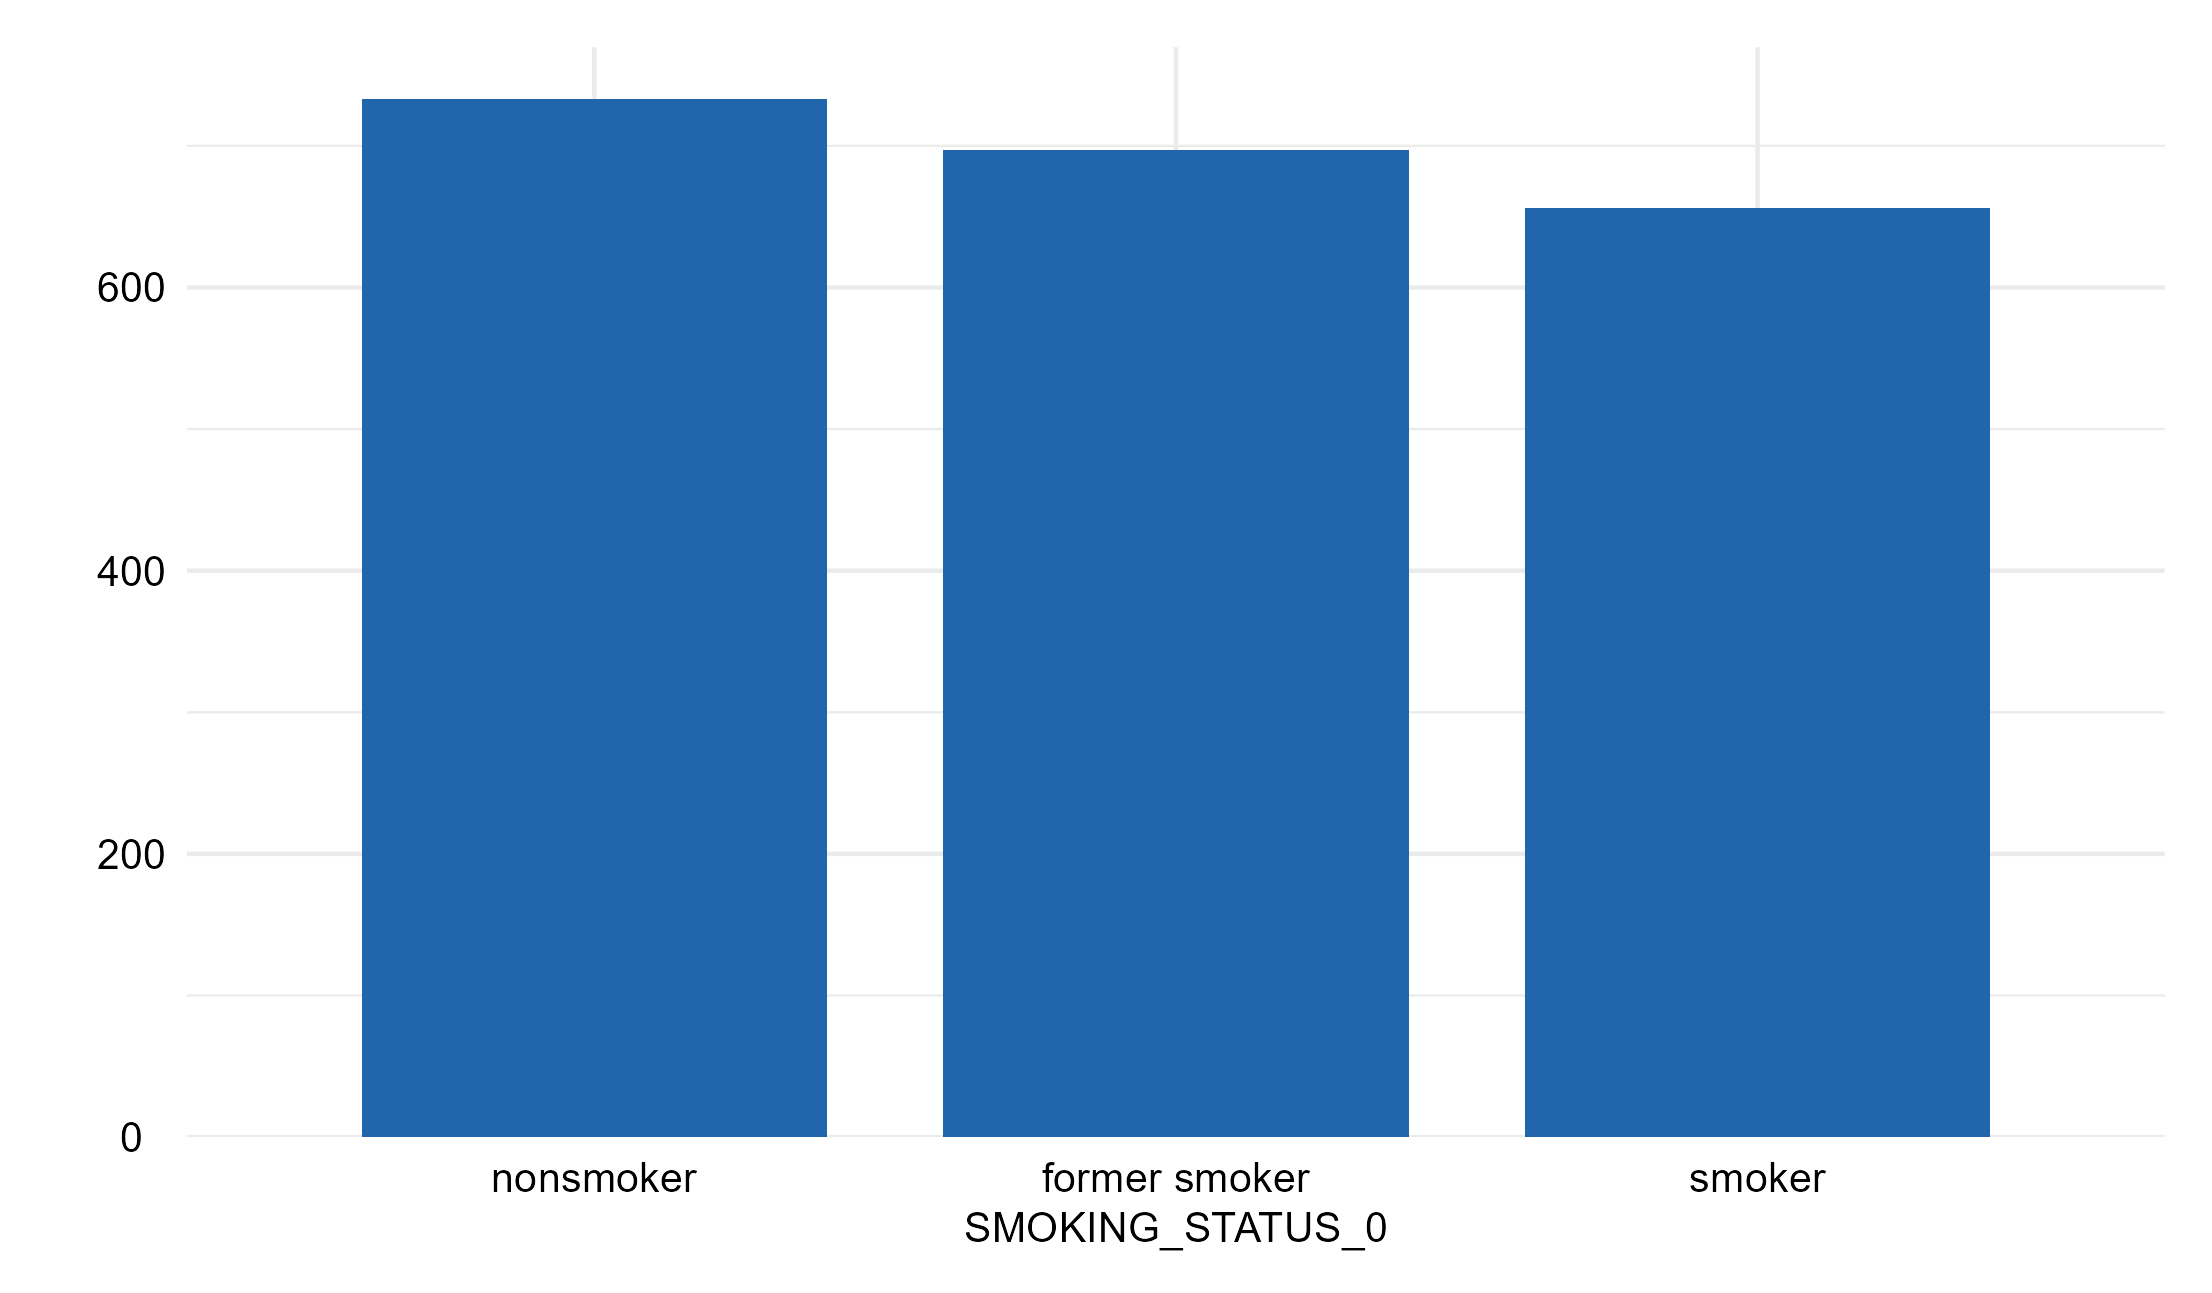
Smoking status
smoking SMOKING_STATUS_0
Descriptive statistics (Categorical)
Provides descriptive statistics for a subset or all categorical variables in the study data
Data type mismatch
Check if the declared data types in the metadata match the observed data types in the study data.
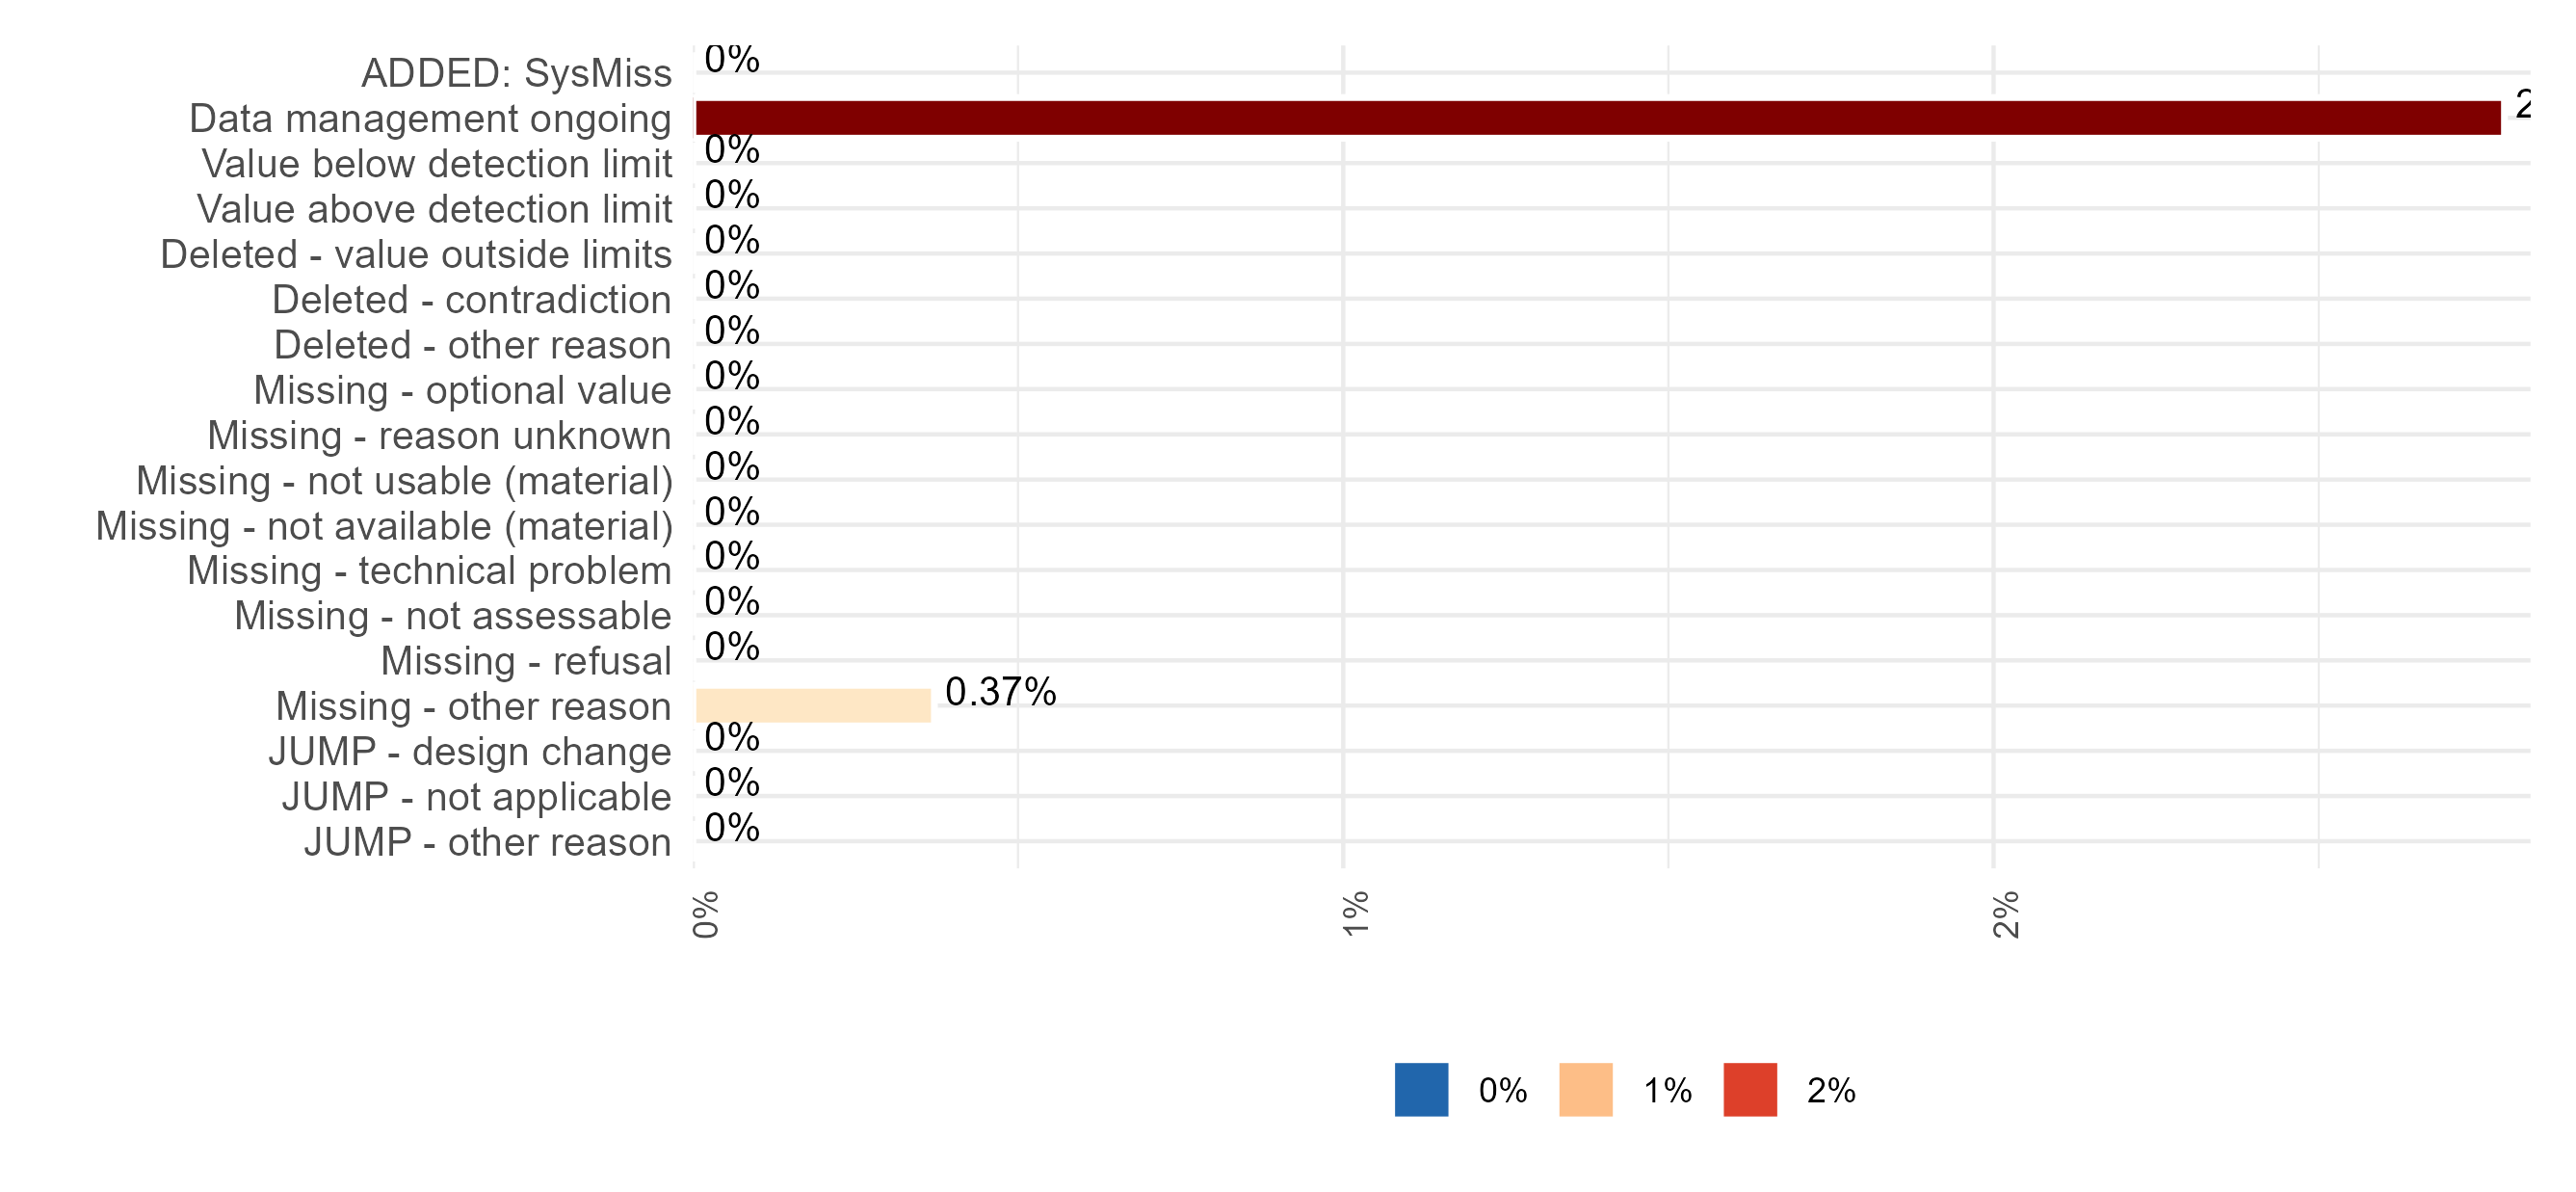
Missing values (Item-level)
Presence and amount of missing data for each variable, separated by class of missingness (i.e., system missingness (NA), used missing codes and jump codes). The higher the number or percentage of missing values, the lower the data quality.
Note:
1. “ADDED: SysMiss” or “Sysmiss N” refers to NA’s (i.e., system-indicated missing values);
2. The percentage of all the columns in the table (except Measurements N (%)) are calculated over the Observation N. The percentage of Measurement N is calculated by dividing the value (Measurement N) by the difference between the number of observations and the number of jumps (Observation N - Jumps N).
Response-rates (Item-level)
The higher the rate, the lower the data quality. For further information, see here
Inadmissible categorical values
Check applied to categorical variables. The categories observed in the study data should be present in the allowed categories listed in the metadata. The higher the number or percentage of non-matching categories, the lower the data quality.
Note: OBSERVED_CATEGORIES = categories present in the study data; DEFINED_CATEGORIES = categories defined in the metadata; NON_MATCHING = categories present in the study data but not defined in the metadata; NON_MATCHING_N = total number of observational units with mismatches; NON_MATCHING_N_PER_CATEGORY = number of observational units with mismatches per undefined but found category.
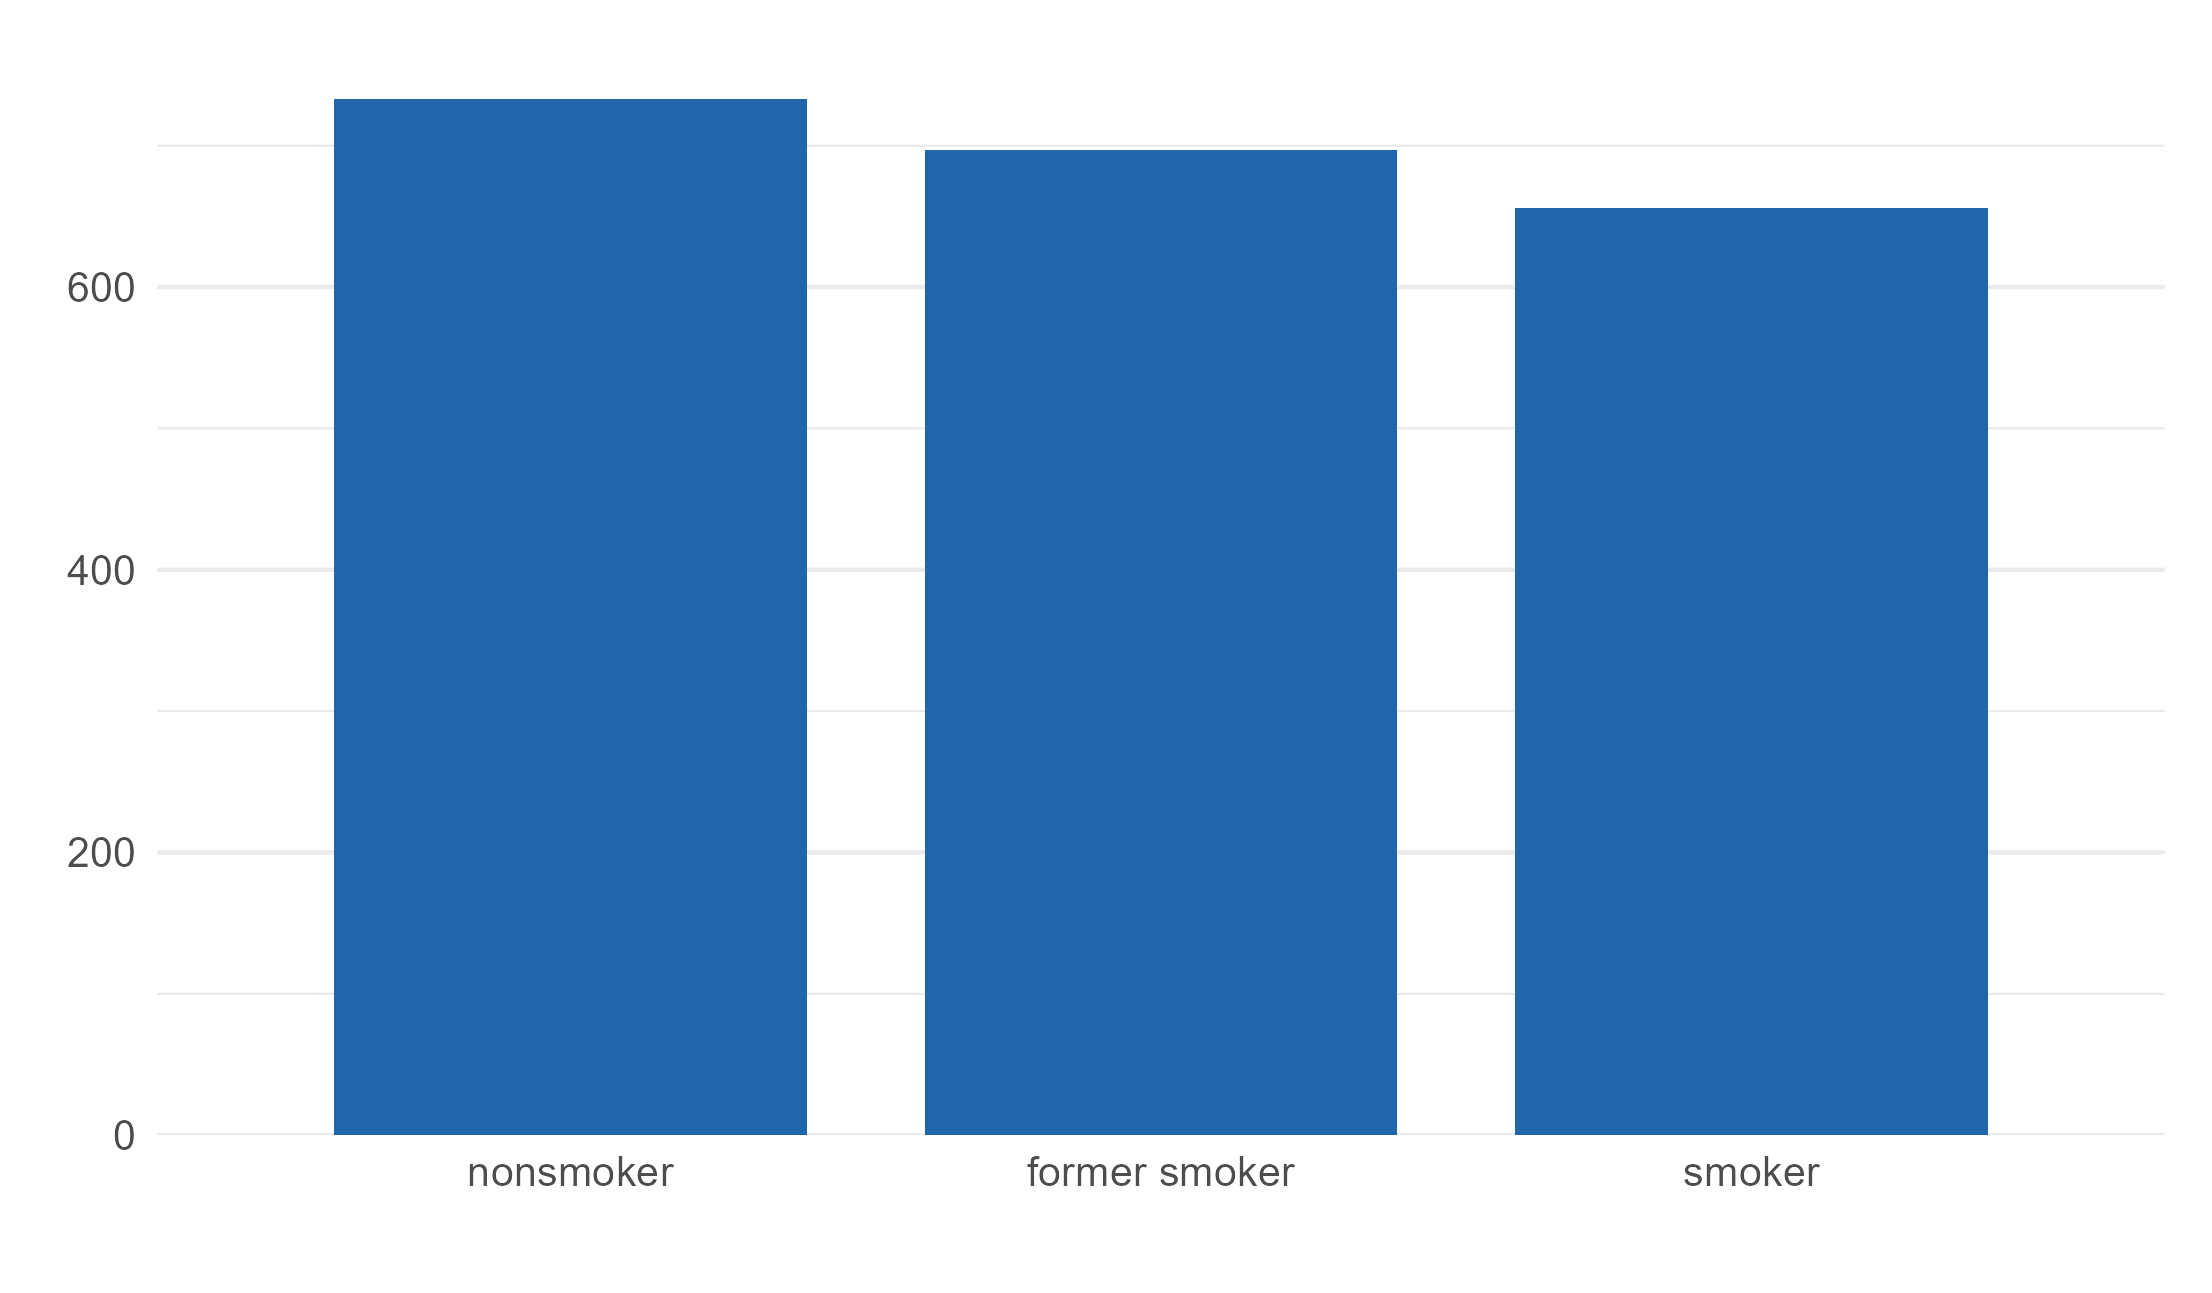
Distribution (Categorical)
The higher the number of variables with unexpected location or proportions, the lower the data quality. Deviations from the expected central tendency or unexpected proportions might indicate data issues and should be further investigated. There is no formal interpretation rule for the histograms and bar plots; expert background knowledge on expected distribution of the targeted outcome variable in the studied sample is necessary.
Distribution (Categorical) observer
The higher the number of variables with unexpected location or proportions, the lower the data quality. Deviations from the expected central tendency or unexpected proportions might indicate data issues and should be further investigated. There is no formal interpretation rule for the histograms and bar plots; expert background knowledge on expected distribution of the targeted outcome variable in the studied sample is necessary.
Distribution
Distribution plots for the variables in the study data (distributions are described using bar plots in case of categorical data and histograms for numerical data).
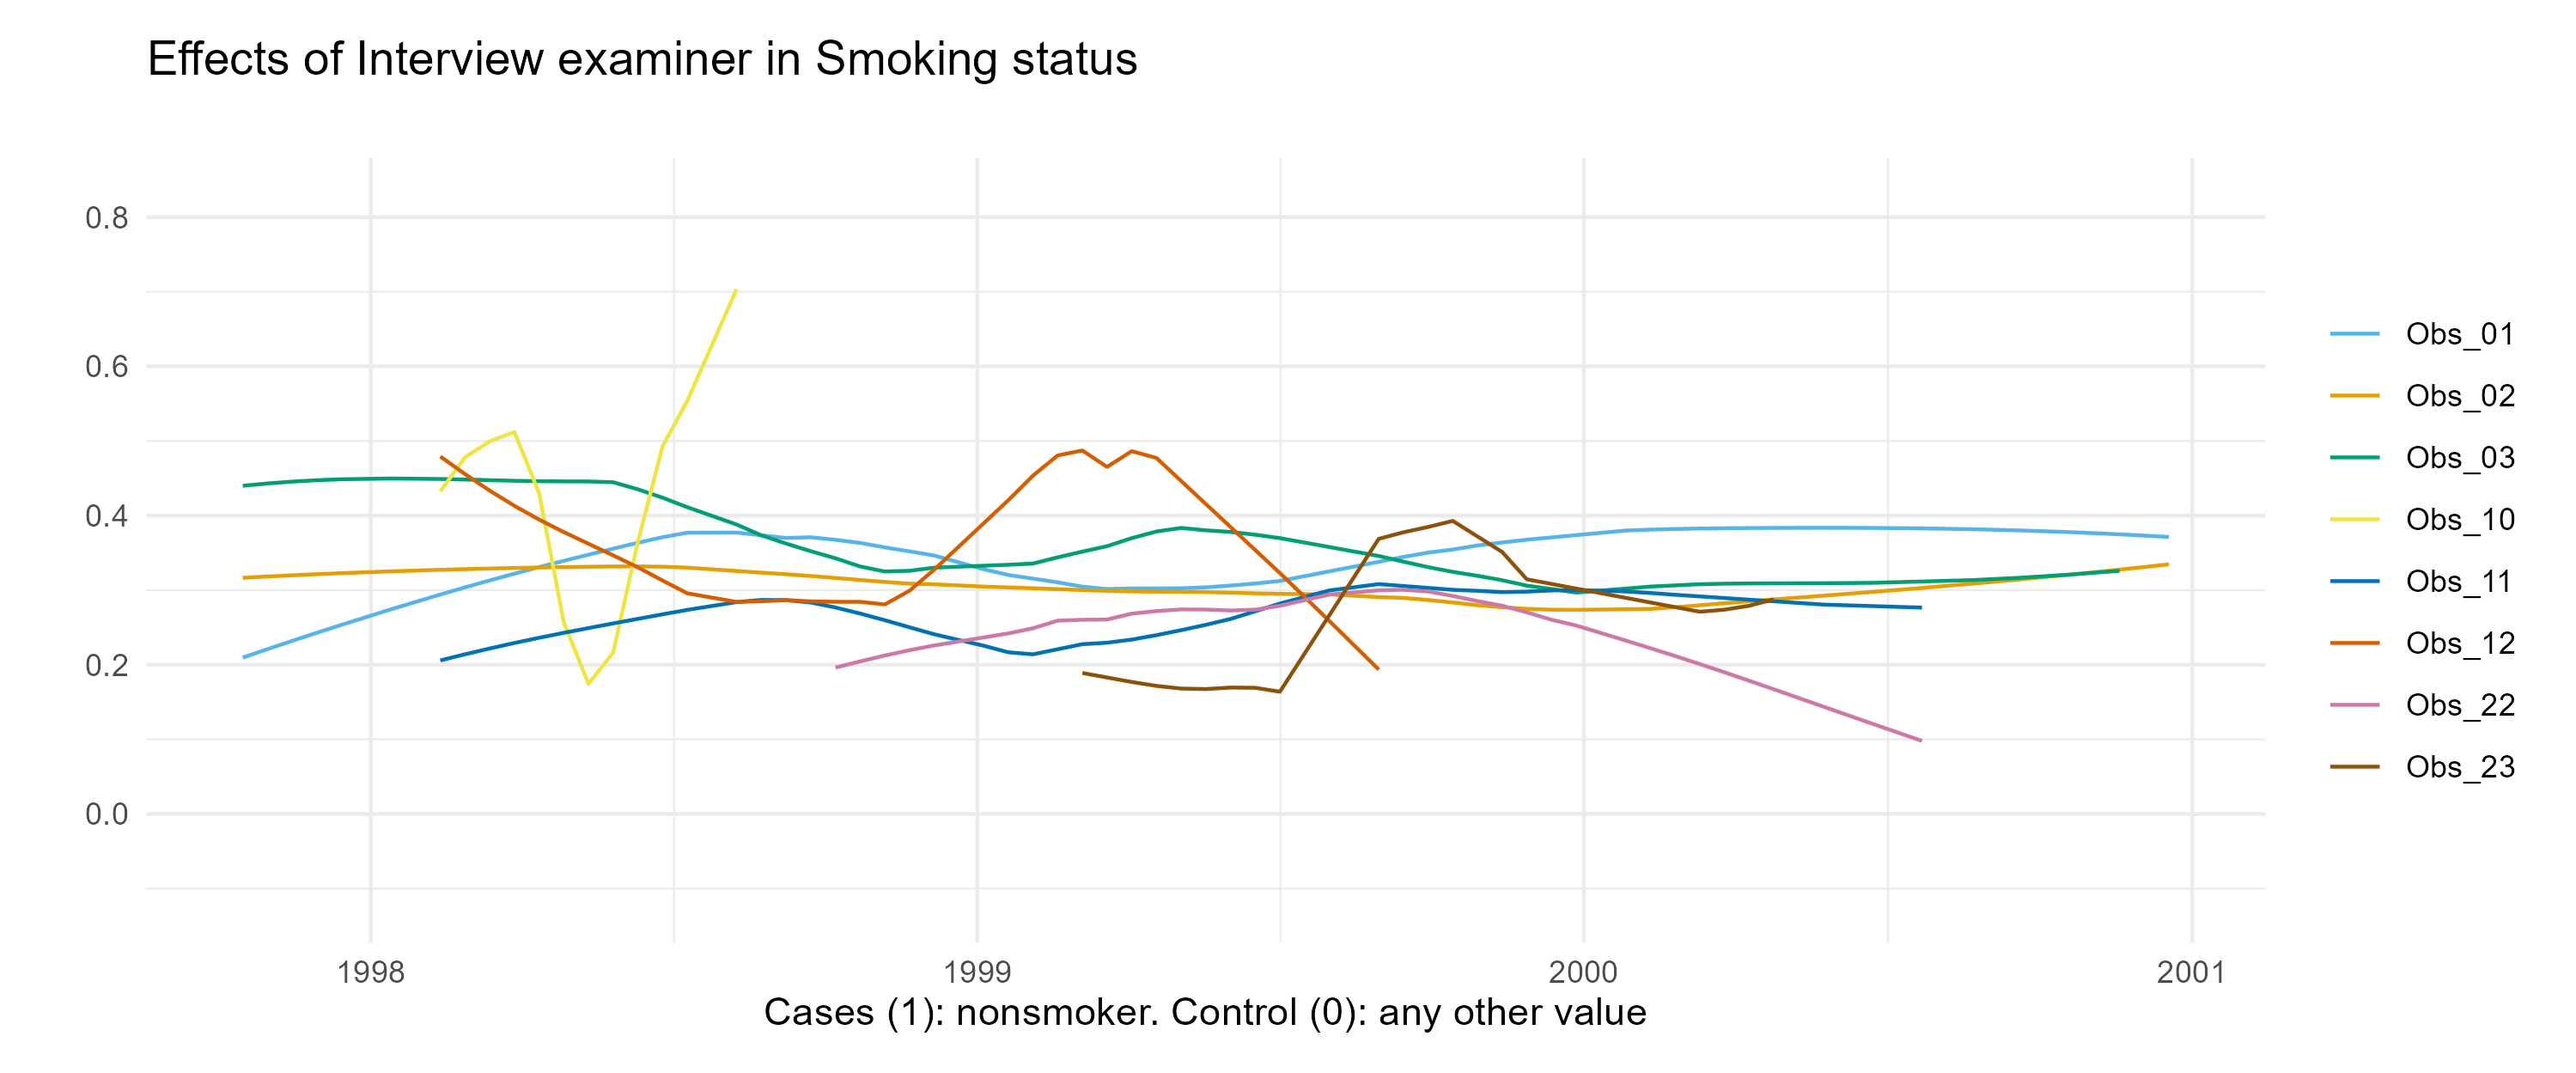
Time trend observer
Lowess regression models are used to display time trends and potential effects of instruments used or examiners on the measurements. Background knowledge is needed to interpret the graph. Typically the further the graphs for different devices or examiners are apart from each other, the bigger the instruments or examiners effect.
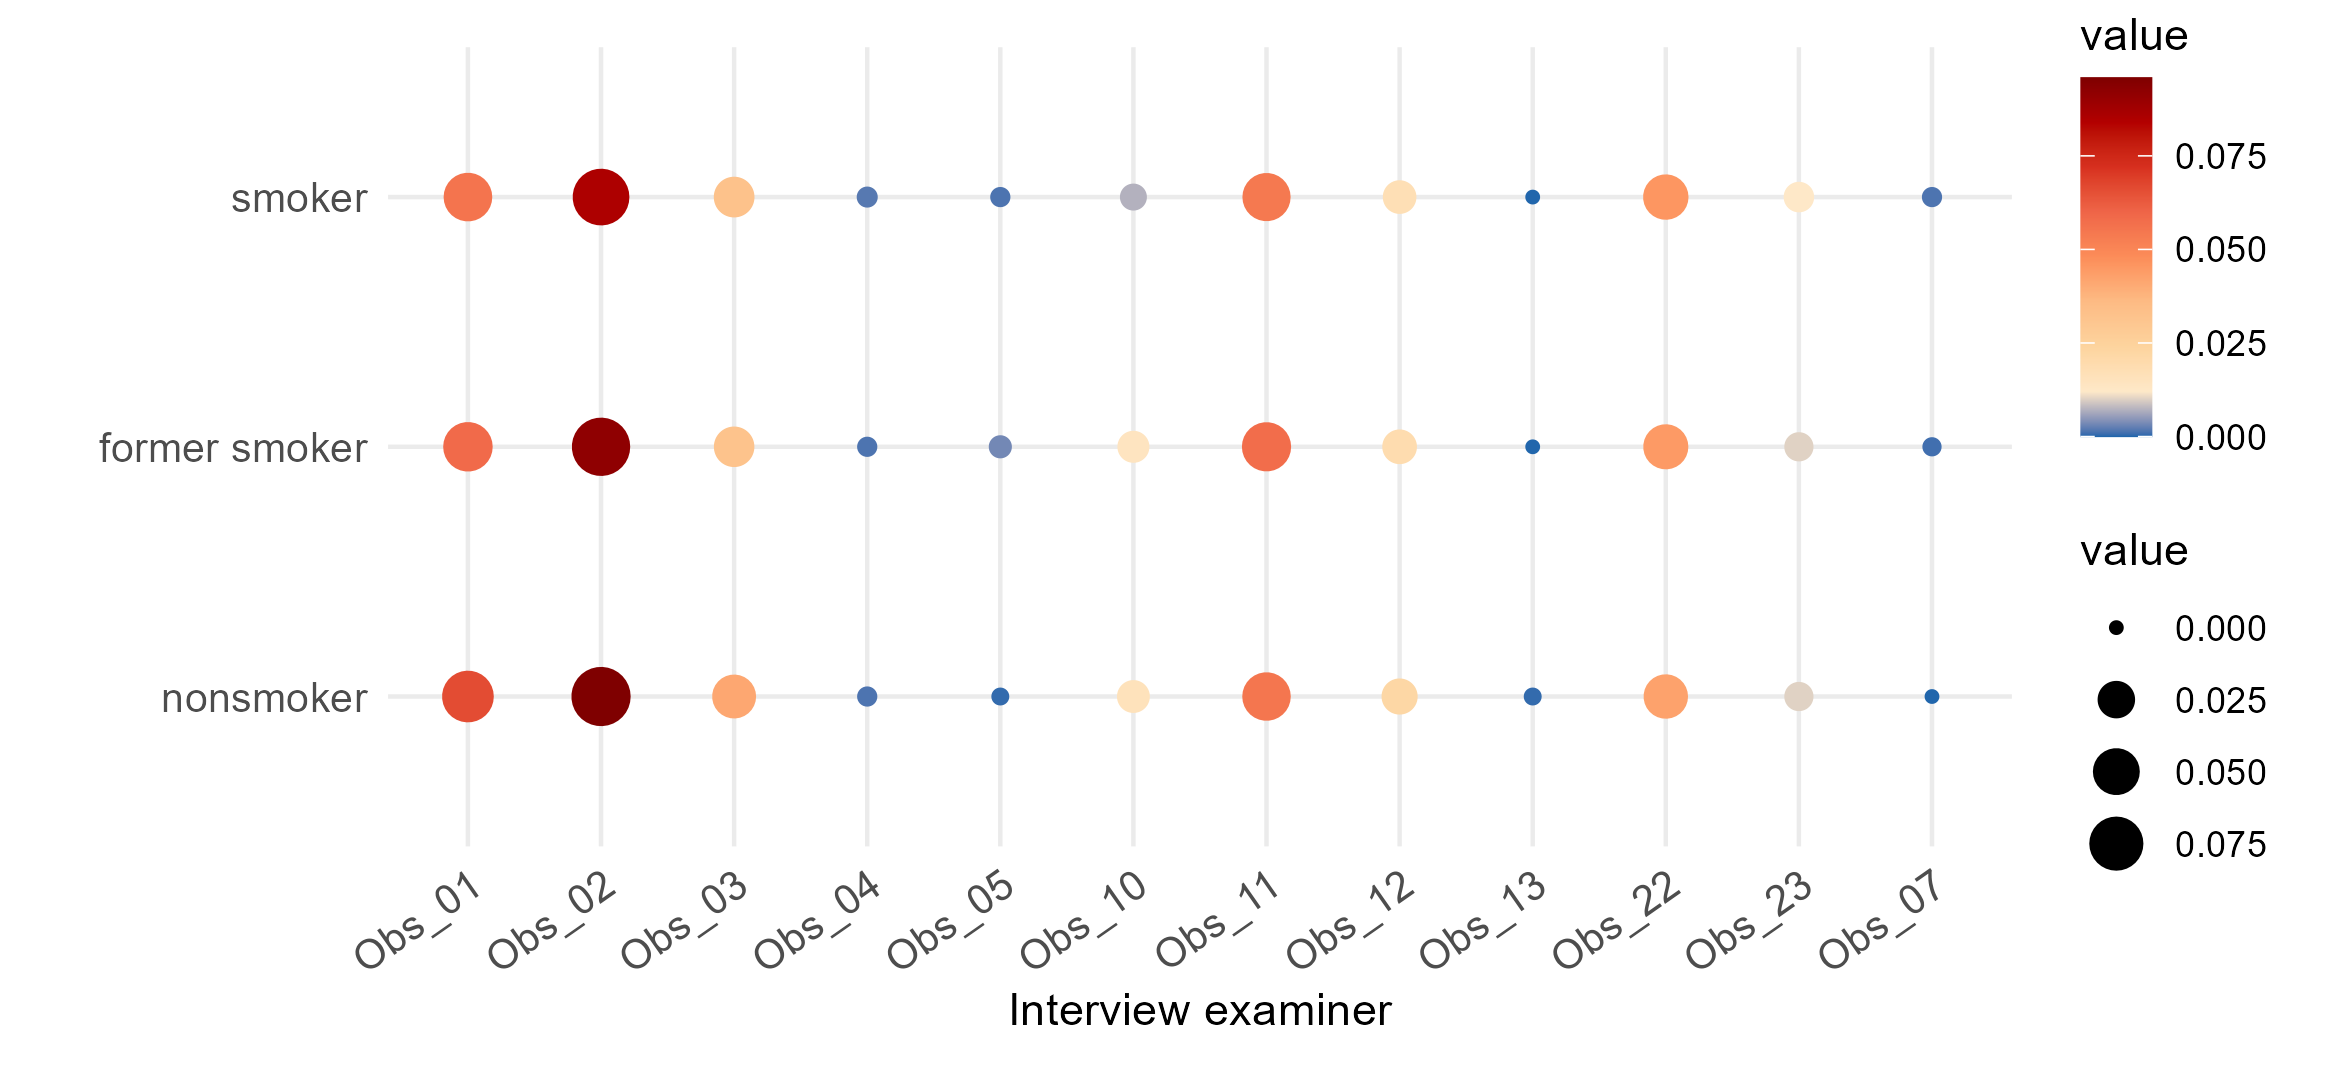
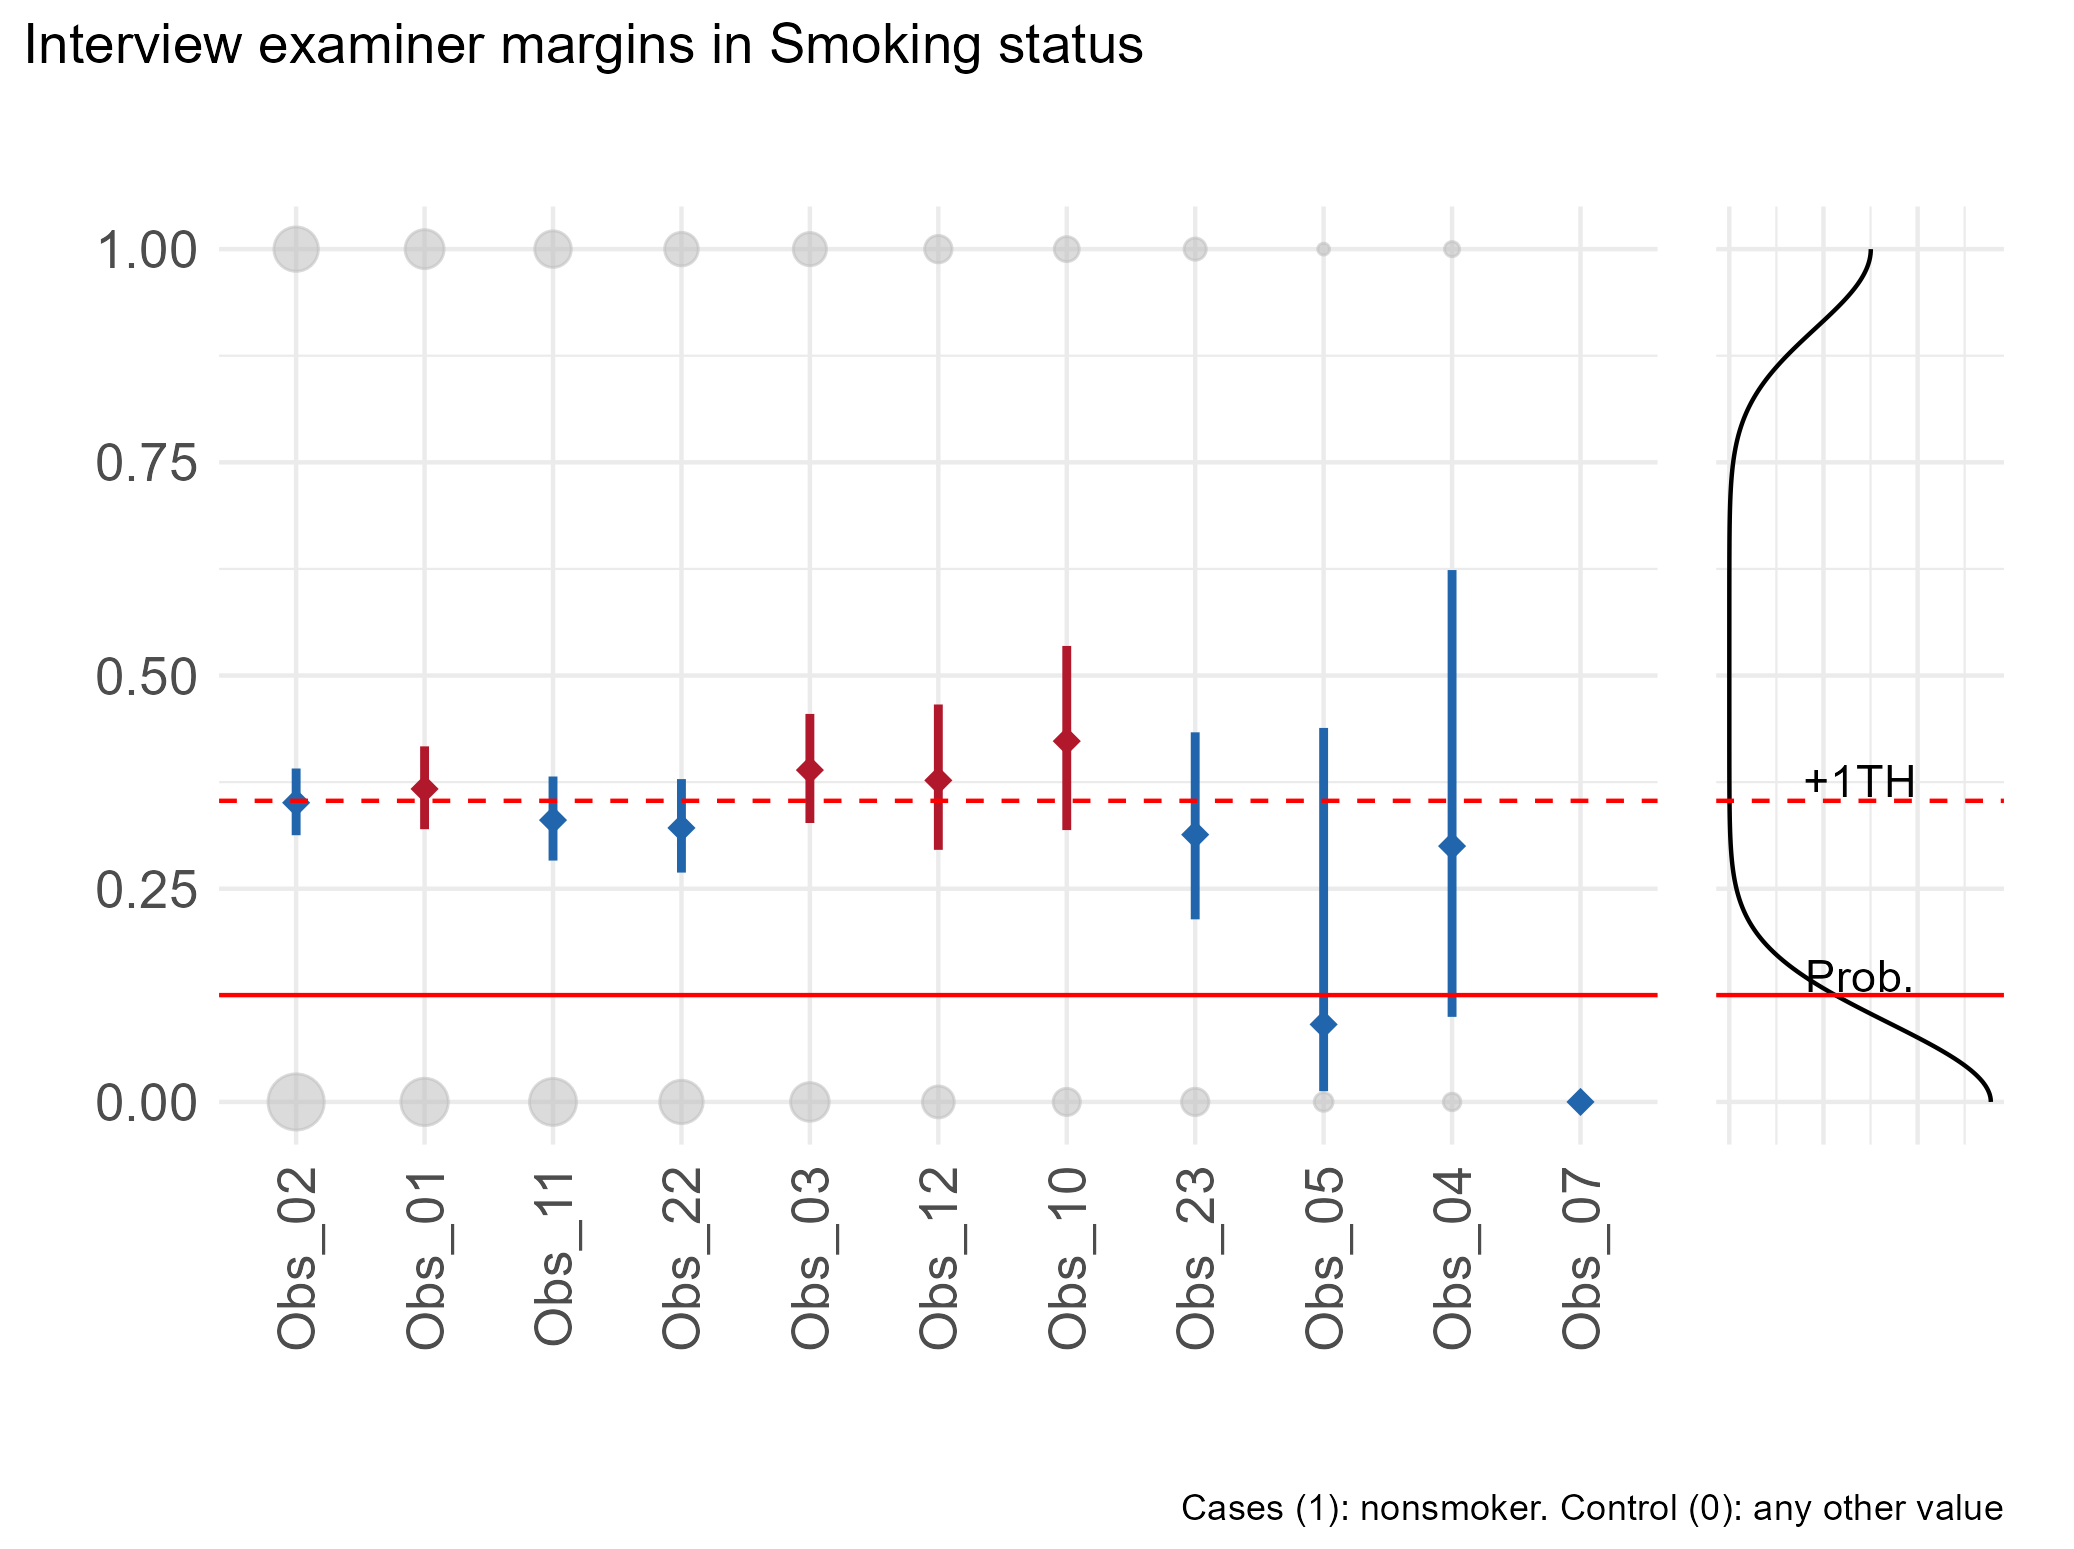
Distribution across observer
Marginal distribution per device or observer and overall distribution are reported to check for the presence of an effect of the instrument or observer on the measurements obtained. Background knowledge is needed to interpret the graphs.
Variance proportion observer
Checks the effect of different devices or observers on measurements through variance based models and intra-class correlations (ICC).
The closer to 1 the ICC value is, the lower the data quality.
Note: this check employs a model.