Somatometry examiner
obs_soma OBS_SOMA_0
Descriptive statistics (Categorical)
Provides descriptive statistics for a subset or all categorical variables in the study data
Data type mismatch
Check if the declared data types in the metadata match the observed data types in the study data.
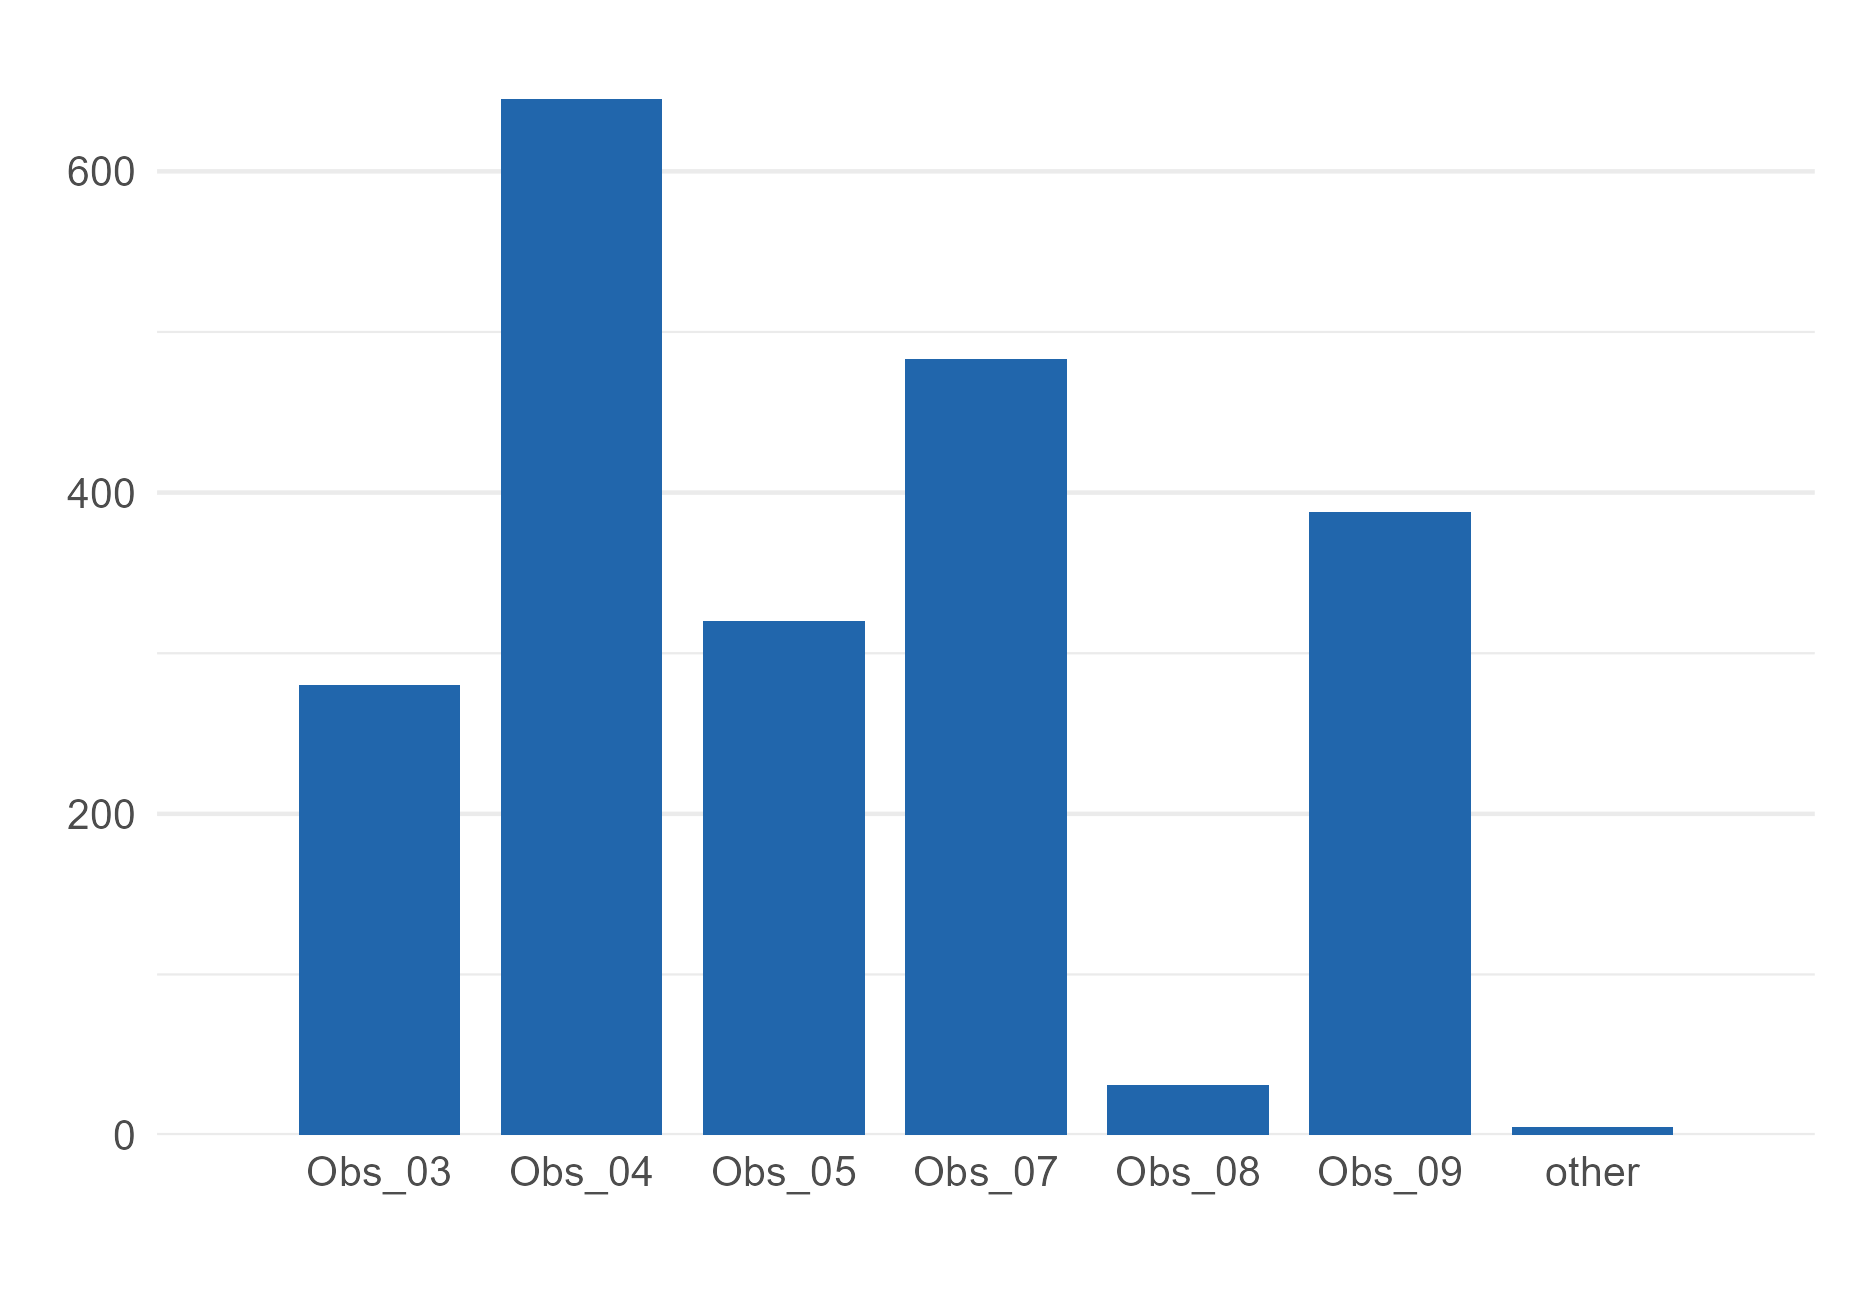
Distribution (Categorical)
The higher the number of variables with unexpected location or proportions, the lower the data quality. Deviations from the expected central tendency or unexpected proportions might indicate data issues and should be further investigated. There is no formal interpretation rule for the histograms and bar plots; expert background knowledge on expected distribution of the targeted outcome variable in the studied sample is necessary.
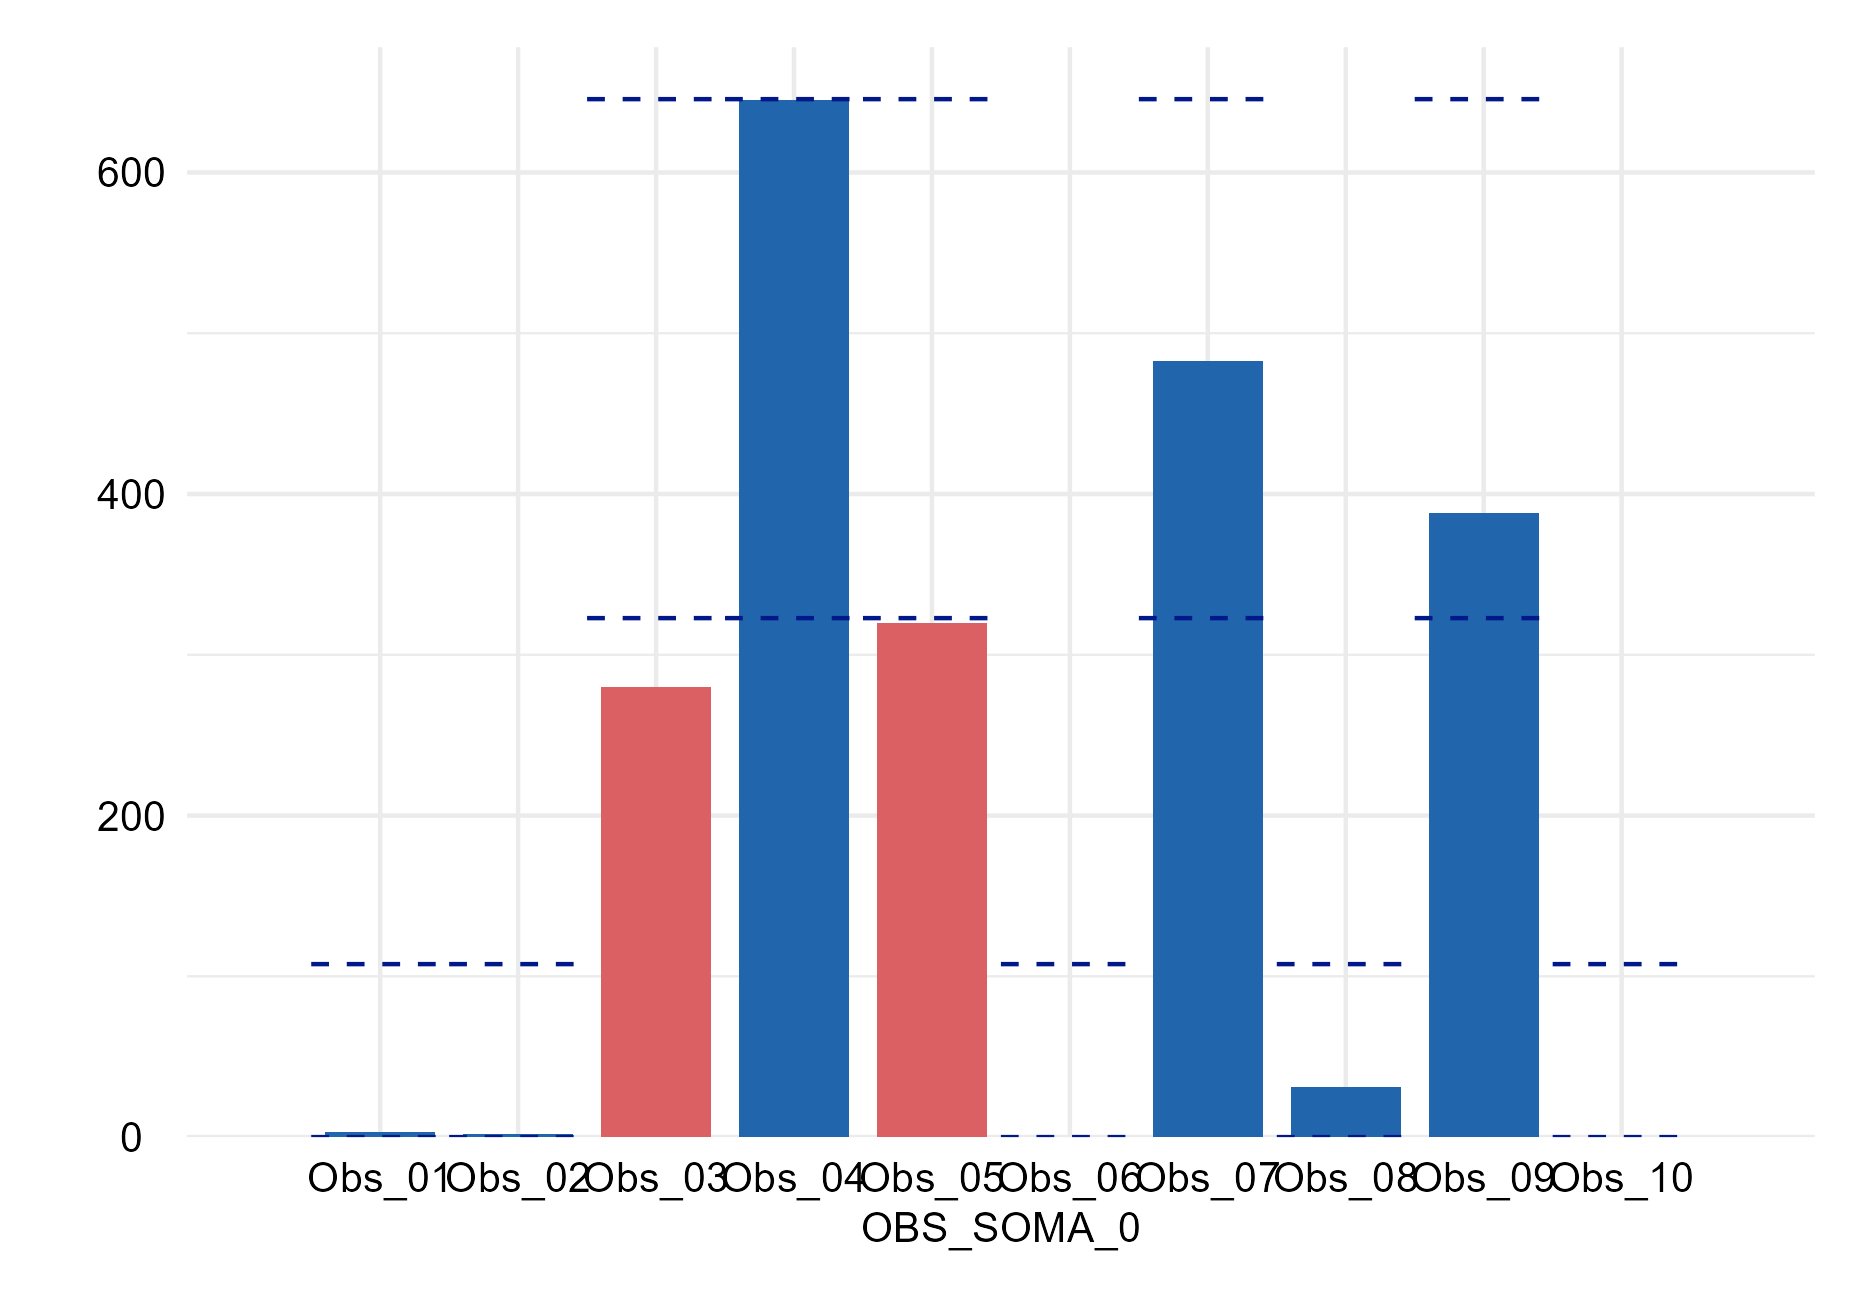
Unexpected proportion
Bar plot representing the absolute frequencies of observations per category. The plot is created only if the column PROPORTION_RANGE in the metadata contains a range of possible values for all the categories, e.g., [49, 51], or a list containing the range of expected values per category, e.g., low in [20, 22] | medium in [20, 22] | high in [60, 62].